LEHNINGER PRINCIPLES OF BIOCHEMISTRY - VOLUME 1. THE FOUNDATIONS OF BIOCHEMISTRY: STRUCTURE AND CATALYSIS - 2011
PART I. STRUCTURE AND CATALYSIS
11. BIOLOGICAL MEMBRANES AND TRANSPORT
11.3. Solute Transport Across Membranes
Every living Cell must acquire Materials from its environment for Biosynthesis and energy production, and release metabolic by-products. While some nonpolar compounds can dissolve in The Lipid Bilayer and cross the membrane on their own, polar or charged substances and ions always require the participation of Membrane Proteins for transmembrane movement. In some cases, a membrane protein simply facilitates the diffusion of a substance down its concentration gradient, but transport frequently occurs against a concentration gradient, an electrical charge gradient, or both; in such instances, solutes must be "pumped" into The Cell via an energy-requiring process (Fig. 11-25).
Class="center">Fig. 11-25. Types of transport systems across the membrane.

This energy may be derived directly from ATP Hydrolysis or coupled to the movement of another solute down its electrochemical gradient. Ions may also cross the membrane through protein-lined Ion Channels, or be carried by ionophores—small molecules that shield the ionic charge, allowing them to diffuse across the lipid bilayer. With very few exceptions, the movement of small molecules across The Plasma Membrane is mediated by proteins such as transmembrane channels, transporters, or pumps. In Eukaryotic Cells, different compartments contain distinct concentrations of metabolic intermediates, products, and ions, which must likewise be transported across intracellular membranes through tightly regulated, protein-mediated processes.
Passive transport is facilitated by membrane proteins
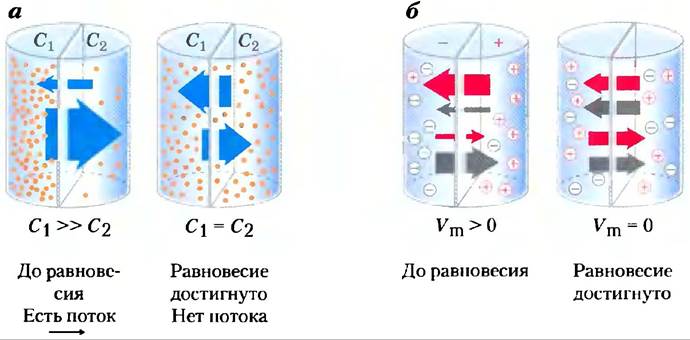
When two aqueous compartments containing unequal concentrations of a solute or ion are separated by a permeable barrier (a membrane), the solute moves across the membrane by simple diffusion from a region of higher concentration to one of lower concentration until equal concentrations are reached in both compartments (Fig. 11-26a). When oppositely charged ions are separated by a membrane, a transmembrane electrical gradient is established—the Membrane Potential Vm (expressed in volts or millivolts). This membrane potential Vm acts as a force opposing The transfer of ions that would increase Vm, whereas ions move in a direction that reduces Vm (Fig. 11-26b). Thus, the direction in which a charged solute spontaneously moves across a membrane depends on both its chemical gradient (the concentration difference) and the electrical gradient (Vm). Together, these two factors constitute the electrochemical gradient or Electrochemical Potential. This behavior of
solutes conforms to The Second Law of Thermodynamics: the spontaneous distribution of molecules is characterized by maximal disorder and minimal energy.
Fig. 11-26. Movement of solutes across a permeable membrane. (a) Net movement of electrically neutral solutes is directed toward the lower concentration until equilibrium is reached. Solute concentrations to the left and right of the membrane are designated C1 and C2, respectively. The rate of transmembrane movement (indicated by the large arrows) is proportional to the concentration gradient C1/C2. (b) Net movement of electrically charged solutes is determined by a combination of the electrical potential (Vm) and the chemical concentration difference; net ion movement continues until this electrochemical potential reaches zero.
To cross the lipid bilayer, a polar or charged solute must first shed its hydrating Water molecules (its Hydration shell), and then diffuse a distance of ≈3 nm (30 Å) through a solvent (the lipid) in which it is poorly soluble (Fig. 11-27). The energy expended to strip away the hydration shell and transfer the polar solute from water into the lipid is recovered when the solute exits the membrane on the other side and becomes rehydrated. The intermediate stage of transmembrane passage represents a high-energy state (analogous to the Transition State in an enzyme-catalyzed chemical reaction). In both cases, an activation barrier must be overcome to reach the intermediate stage (Fig. 11-27; cf. Fig. 6-3). The activation energy (ΔG*) for the translocation of a polar solute across the bilayer is so large that pure Lipid bilayers are practically impermeable to polar and charged species over timeframes exceeding even the periods of Cell Growth and Division.
Fig. 11-27. Energy Changes During the passage of a hydrophilic solute through the lipid bilayer of a biological membrane. (a) In simple diffusion, stripping the hydration shell is an extremely endergonic process, and the activation energy ΔG* for diffusion across the bilayer is very high. (b) A transport protein decreases ΔG* for solute diffusion across the membrane. It achieves this through noncovalent interactions with the dehydrated solute, replacing hydrogen bonding with water and providing a hydrophilic transmembrane pathway.

Membrane proteins lower the activation energy for The transport of polar compounds and ions by providing specific solutes with an alternative pathway across the bilayer. Proteins that mediate such Facilitated Diffusion (passive transport) are not Enzymes in the traditional sense; their "substrates" move from one compartment to another but undergo no chemical change. Membrane proteins that accelerate solute movement across the membrane via facilitated diffusion are called transporters or permeases.
Like enzymes, transporters bind their substrates with stereochemical Specificity through multiple weak noncovalent interactions. The negative free-energy change resulting from these weak interactions (ΔGbinding) counterbalances the positive free-energy change that accompanies the loss of substrate hydration water (ΔGhydration), thereby lowering ΔG* of the transmembrane transition (Fig. 11-27). Transporters span the lipid bilayer multiple times, forming a transmembrane channel lined with hydrophilic amino acid side chains. This channel provides the specific substrate with an alternative route to cross the lipid bilayer without the need to dissolve in the lipid, further reducing ΔG* of transmembrane diffusion. The result is an increase of several orders of magnitude in the rate of substrate transmembrane passage.
Transporters can be grouped into superfamilies based on their structures
Genomic studies reveal that transporters constitute a substantial fraction of all proteins encoded in the genomes of both simple and complex organisms. The Human Genome likely encodes over 1,000 different transporters. Transporters are divided into two very broad categories: carriers and channels (Fig. 11-28). Carriers bind their substrates with high stereospecificity, catalyze transport at rates much lower than those of free diffusion, and are saturable in the same sense as enzymes: above a certain Substrate Concentration, further increases do not increase the transport rate. Channels typically permit transmembrane movement at rates several orders of magnitude higher than those characteristic of carriers, approaching the rate of free diffusion. Channels exhibit lower stereospecificity than carriers and are nonsaturable. Most channels are oligomeric complexes composed of multiple, often identical, subunits, whereas many transporters function as monomeric proteins. The division into carriers and channels represents the coarsest Classification of transporters. Within each category, various superfamilies exist, defined not only by primary sequences but also by Secondary Structure. Some channels are built primarily of helical transmembrane segments, while others adopt a ξta-barrel structure. Some transporters simply facilitate diffusion down a concentration gradient; this superfamily comprises passive transporters. Active transporters can move substrates across the membrane against a concentration gradient, with some utilizing energy released directly from a chemical reaction (primary active transporters) and others coupling the energy-requiring transport of one substrate in one direction to the energetically favorable transport of another substrate in the opposite direction (secondary active transporters). We will now examine several well-studied members of the major transporter superfamilies. In subsequent chapters, we will encounter some of these transporters again when discussing the Metabolic Pathways in which they participate.
Fig. 11-28. Classification of transporters.

The erythrocyte glucose transporter mediates passive transport
Energy-yielding METABOLISM in erythrocytes depends on a continuous supply of glucose from Blood Plasma, where glucose is maintained at a concentration of 5 mM. Glucose enters erythrocytes via facilitated diffusion through a specific transporter at a rate 50,000 times greater than that of uncatalyzed diffusion. The erythrocyte glucose transporter (designated GLUT1 to distinguish it from similar glucose carriers in other Tissues) is a type III integral protein (Mr ≈ 45,000) containing 12 hydrophobic segments, each presumed to form a membrane-spanning helix. Although the detailed structure of GLUT1 is not yet known, a plausible model proposes that a parallel, side-by-side arrangement of several helices forms a transmembrane channel lined with hydrophilic residues that can hydrogen-bond with glucose as it moves through the channel (Fig. 11-29).
Fig. 11-29. Proposed structure of GLUT1. (a) Transmembrane helices are represented as slanted rows of three or four amino acid residues, with each row depicting one turn of an α-Helix. Nine of the 12 helices contain three or more polar or charged amino acid residues (blue and red), frequently separated by several hydrophobic residues (yellow). This representation does not reflect the three-dimensional structure. (b) A helical wheel diagram shows the distribution of polar and nonpolar residues On the surface of a helical segment. The view is down the helical axis from the N-terminus. Adjacent residues are connected in linear sequence by arrows, and each residue is positioned in a circle corresponding to its Location in the helix; recall that 3.6 residues are required for one complete turn of an α-helix. In this example, polar residues (blue) lie on one side of the helix and hydrophobic residues (yellow) on the other. By definition, this helix is amphipathic. (c) The side-by-side localization of five or six amphipathic helices, each with its polar surface oriented toward the central cavity, creates a transmembrane channel lined with polar and charged residues. This channel provides ample opportunity for hydrogen bonding with glucose as it moves through the transporter.

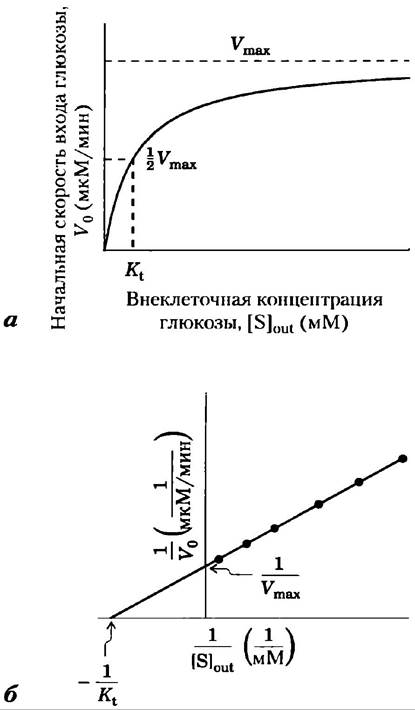
Glucose transport can be described by analogy with an enzymatic reaction, in which the "substrate" is extracellular glucose (Soutside), the "product" is intracellular glucose (Sinside), and the "enzyme" is the transporter (T). When the rate of glucose uptake is plotted as a function of external glucose concentration (Fig. 11-30), the resulting curve is a hyperbola, and at high external glucose concentrations, the uptake rate approaches Vmax. Formally, this transport process can be described by the following equations:

where r1, r-1, etc., are the rate constants for the forward and reverse reactions at each step; T1 is the outward-facing conformation of the transporter, and T2 is the inward-facing conformation. All stages of glucose transport are illustrated in Fig. 11-31. Because each step is reversible, the carrier is theoretically capable of both moving glucose into the cell and out of it. However, glucose normally moves down its concentration gradient; typically, this means it enters the cell. Glucose entering the cel-
lular environment undergoes immediate metabolic transformation, so its intracellular concentration is always kept low relative to that in the blood.
Figure 11-30. Kinetics of Glucose Transport into erythrocytes. (a) The initial rate of glucose entry into the erythrocyte, V0, depends on the initial extracellular glucose concentration, Sout(outside). (b) Double-reciprocal (Lineweaver-Burk) plot of the data in (a). The kinetics of facilitated diffusion parallels that of an enzymatic reaction (cf. Figs. 6-11 and 1 in Box 6-1). Note that Kt is analogous to the Michaelis constant, KM.
The rate equation for glucose transport can be derived in exactly the same way as for enzymatic reactions (Chapter 6), yielding an expression analogous to the Michaelis-Menten Equation:
 (11-1)
where V0 is the initial rate of intracellular glucose accumulation at an environmental concentration of [S]outside, and Kt is a constant analogous to the Michaelis constant, characteristic of the transport system. This equation describes the initial rate—that is, the rate observed when [S]inside = 0. As with enzymatic reactions, a double-reciprocal plot yields a linear relationship of 1/V0 versus 1/[S]outside, from which Kt and Vmax can be determined (Fig. 11-30b). When [S] = Kt, the uptake rate is half-maximal, and the carrier is half-saturated. With a normal blood glucose concentration of 4.5 to 5 mM (or ~3 Kt), it is safe to conclude that GLUT1 is nearly saturated with substrate and operates at a rate close to Vmax.
Figure 11-31. A model for glucose transport into erythrocytes mediated by GLUT1. The transporter exists in two Conformations: T1, with the glucose-binding site exposed on the outer surface of the plasma membrane, and T2, with the glucose-binding site located on the inner surface. Glucose transport proceeds in four stages: (1) Blood plasma glucose binds to a stereospecific site on T1; this lowers the activation energy for (2) a conformational change from Soutside • T1 to Sinside • T2, facilitating transmembrane passage of glucose. (3) Glucose is then released from T2 into the Cytoplasm, and (4) the transporter reverts to the T1 conformation, ready to transport another glucose molecule.

Because the transition from Soutside to Sinside neither creates nor breaks any chemical bonds, neither the substrate nor the product becomes more stable; consequently, the glucose transport process is fully reversible. As Sinside approaches Soutside, the rates of entry and exit become equal. Therefore, such a system cannot accumulate substrate (glucose) inside the cell at concentrations exceeding the extracellular concentration; equilibrium concentrations of glucose on both sides of the membrane are reached much faster than would occur in the absence of a specific transporter. GLUT1 is specific for D-glucose, with a measured Kt of ~1.5 mM. For closely related glucose analogues D-mannose and D-galactose, which differ only in the orientation of a single hydroxyl group, the Kt values are 20 and 30 mM, respectively; for L-glucose, Kt > 3,000 mM. Thus, GLUT1 exhibits three Characteristic Properties of passive transport: high diffusion rates down a concentration gradient, saturability, and specificity.
Table 11-3. Glucose transporters encoded in the human genome
Transporter |
Tissues of expression |
Role* |
|
GLUT1 |
Ubiquitous |
SLC2A1 |
Basal glucose uptake |
GLUT2 |
Liver, pancreatic islets, intestine |
SLC2A2 |
In the liver — removal of excess glucose from the blood; in the Pancreas — Regulation of Insulin release |
GLUT3 |
SLC2A3 |
Basal glucose uptake |
|
GLUT4 |
SLC2A4 |
Activity increased by insulin |
|
GLUT5 |
SLC2A5 |
Primary fructose transport |
|
GLUT6 |
Spleen, leukocytes, brain |
SLC2A6 |
Likely lacks transport function |
GLUT7 |
Liver microsomes |
SLC2A7 |
- |
GLUT8 |
Testes, blastocyst, brain |
SLC2A8 |
|
GLUT9 |
Liver, kidneys |
SLC2A9 |
- |
GLUT10 |
Liver, pancreas |
SLC2A10 |
- |
GLUT11 |
Heart, Skeletal Muscle |
SLC2A11 |
- |
GLUT12 |
Skeletal muscle, adipose tissue, Small Intestine |
SLC2A12 |
- |
* A dash indicates that the role has not yet been established.
MEDICINE. Impaired glucose and water transport in two forms of diabetes
When Digestion of a carbohydrate-rich meal leads to a higher-than-normal (~5 mM) glucose concentration between meals, the excess glucose is taken up by cardiac and skeletal muscle myocytes (which store it as Glycogen) and adipocytes (which convert it into triacylglycerols). Glucose entry into myocytes and adipocytes is mediated by the glucose transporter GLUT4. Between meals, some GLUT4 is present in the plasma membrane, but the majority resides in the membranes of small intracellular vesicles (Fig. 1). Insulin, released from The Pancreas in response to high blood glucose levels, triggers the movement of these intracellular vesicles toward the plasma membrane, where they fuse with it, thereby exposing GLUT4 molecules on the outer cell surface (see Fig. 12-6). As more and more GLUT4 molecules are recruited into action, the rate of glucose uptake increases 15-fold or more. When blood glucose levels return to normal, insulin release slows down, and most GLUT4 molecules are retrieved from the plasma membrane and stored in vesicles.
Figure 1. Insulin REGULATION OF GLUCOSE transport into a myocyte via GLUT4.

In type 1 Diabetes Mellitus (juvenile-onset), the inability to release insulin (and consequently to mobilize glucose transporters)
leads to a reduced rate of glucose uptake into muscle and adipose tissue. One consequence of this is a prolonged period of elevated blood glucose levels following a carbohydrate-rich meal. This forms The basis of the glucose tolerance test used for diagnosing diabetes (Chapter 23).
The water permeability of the epithelial cells lining the renal collecting duct is due to the presence of aquaporin-2 (AQP-2) in their apical Plasma Membranes (facing the lumen). Antidiuretic hormone (ADH) regulates water retention by mobilizing AQP-2 molecules stored in vesicular membranes within the epithelial cells, in a manner very similar to how insulin mobilizes GLUT4 in muscle and adipose tissue. When these vesicles fuse with the epithelial cell plasma membrane, water permeability increases dramatically, allowing more water to be reabsorbed from the collecting duct and returned to the blood. When ADH levels drop, AQP-2 is internalized back into vesicles, reducing water retention. In a relatively rare human condition known as nephrogenic diabetes insipidus, a genetic defect in AQP-2 impairs renal water reabsorption, resulting in The excretion of massive volumes of severely diluted urine.
The human genome encodes 12 glucose transporters, each with unique kinetic properties, tissue distribution patterns, and biological Functions (Table 11-3). In the liver, GLUT2 transports glucose out of hepatocytes to replenish blood glucose levels when liver glycogen stores are depleted. For GLUT2, Kt ≈ 66 mM, allowing it to respond to increases in intracellular glucose concentration (generated by glycogen breakdown) by enhancing outward Transport from the cell. In skeletal muscle, cardiac muscle, and adipose tissue, a different glucose transporter operates—GLUT4 (Kt = 5 mM)—which is uniquely characterized by insulin stimulation: its activity increases when insulin release signals high blood glucose concentrations, thereby accelerating glucose uptake by muscle and adipose tissues (Box 11-2 describes certain defects associated with this transporter).
The chloride-bicarbonate exchanger catalyzes electroneutral anion cotransport across the plasma membrane
Erythrocytes contain another facilitated diffusion system—an anion exchanger that is essential for transporting CO2 from tissues such as skeletal muscle and liver to the Lungs. The respiratory product CO2, released into the blood plasma from oxygen-consuming tissues, enters erythrocytes, where it is converted to bicarbonate HCO3- by the enzyme Carbonic anhydrase. (Recall that HCO3- serves as the primary buffer for maintaining blood pH; see Fig. 2-20.) HCO3- is returned to the blood plasma for transport to the lungs (Fig. 11-32). Because the solubility of HCO3- in plasma is much higher than that of CO2, this roundabout pathway greatly enhances the capacity of the blood to carry carbon dioxide from tissues to the lungs. In the lungs, HCO3- reenters the erythrocytes and is converted back into CO2, which is ultimately released into the alveolar space and eliminated by exhalation. To function efficiently, this shuttle mechanism requires extremely rapid transport of HCO3- across The erythrocyte membrane.
Fig. 11-32. The chloride-bicarbonate exchanger of the erythrocyte membrane. This cotransport system allows HCO3- to enter and exit without altering the membrane potential. Its physiological role is to increase the CO2-carrying capacity of the blood.

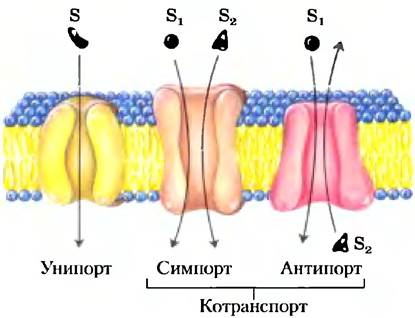
The chloride-bicarbonate exchanger, also known as the anion exchanger (AE) protein, increases the permeability of the erythrocyte membrane to HCO3- by more than a million-fold. Like the glucose transporter, the AE protein is an integral membrane protein that spans the lipid bilayer at least 12 times. This protein mediates the simultaneous movement of two anions: for each HCO3- ion that moves in one direction, one Cl- ion moves in the opposite direction (Fig. 11-33), resulting in no net charge transfer; thus, the exchange is electroneutral. The coupling of Cl- and HCO3- is obligatory; in the absence of chloride, bicarbonate transport ceases. In this regard, the anion exchanger is typical of all cotransport systems, which simultaneously transfer two solutes across a membrane. When, as in this case, the two substrates move in opposite directions, the process is called antiport. In symport, two substrates move simultaneously in the same direction. Transporters that handle only a single substrate, such as the erythrocyte glucose transporter, are termed uniport systems (Fig. 11-33).
Fig. 11-33. Three principal classes of transport systems. Transporters are classified by the number of solutes they carry and the direction of transport for each substrate. Examples of all three types are discussed in the text. Note that this classification does not indicate whether the processes are energy-requiring (Active Transport) or energy-independent (passive transport).
The human genome contains genes for three closely related chloride-bicarbonate exchangers, all having a similar membrane topology. Erythrocytes contain the AE1 transporter, AE2 is predominantly found in the liver, and AE3 is present in the plasma membranes of the brain, heart, and retina. Similar anion exchangers have also been identified in plants and microorganisms.
Active transport results in the movement of solutes against a concentration or electrochemical gradient
In passive transport, solutes always move down their electrochemical gradient and never accumulate at concentrations exceeding equilibrium. Active transport, conversely, results in the accumulation of solutes above their equilibrium concentrations. Active transport is thermodynamically unfavorable (endergonic) and proceeds only when coupled (directly or indirectly) to an exergonic process—such as the absorption of sunlight, an oxidation reaction, The breakdown of ATP, or the coupled flow of another solute down its electrochemical gradient. In primary active transport, solute accumulation is directly coupled to an exergonic chemical reaction, such as The conversion of ATP to ADP + Pi (Fig. 11-34). Secondary active transport occurs when the endergonic ("uphill") transport of a solute is coupled to the exergonic ("downhill") flow of a second solute that was originally pumped uphill by primary active transport.
Fig. 11-34. Two Types of active transport. (a) In primary active transport, The energy released by ATP hydrolysis drives a solute against its electrochemical gradient. (b) In secondary active transport, the gradient of an ion X (often Na+) established by primary active transport provides the energy to drive the cotransport of a second solute (S) against its own electrochemical gradient.

The amount of energy required to transport a solute against a concentration gradient can be calculated from the initial gradient. For a chemical process in which S is converted to P, the free-energy change is given by:
∆G = ∆G°′ + RT ln ([P] / [S]) (11-2)
where R = 8.315 J/(mol·K) is the gas constant, and T is the absolute Temperature. When a substance undergoes simple diffusion from a region of concentration C1 to a region of concentration C2, no chemical bonds are formed or broken, and the standard free-energy change ∆G°′ = 0. The free-energy change for this transport process, ∆Gt, is therefore
∆Gt = RT ln (C2/C1) (11-3)
If the concentrations of a substance in two compartments differ by a factor of 10, the energy required to transfer 1 mol of an uncharged solute across the dividing membrane at 25 °C is
∆G = (8.315 J/(mol·K)) (298 K) ln (10/1) = 5,700 J/mol = 5.7 kJ/mol
Equation 11-3 is valid for all uncharged solutes.
■ Worked Example 11-1. Energy Cost of Pumping Uncharged Solutes
Calculate the energy cost (free-energy change) for pumping an uncharged solute against a 1.0 × 10⁴-fold concentration gradient at 25 °C.
Solution. Use Equation 11-3. Substitute 1.0 × 10⁴ for (C2/C1), 8.315 J/(mol·K) for R, and 298 K for T:
∆Gt = RT ln (C2/C1) = (8.315 J/(mol·K)) (298 K) ln (1.0 × 10⁴) = 23 kJ/mol
When an ion is transported, its movement unaccompanied by a counterion leads to an endergonic Separation of positive and negative charges, generating a membrane potential; such a process is termed electrogenic transport. The energetic "cost" of moving an ion depends on the electrochemical potential (p. 634), which is the sum of the chemical and electrical gradients:
∆Gt = RT ln (C2/C1) + Z F ∆Ψ (11-4)
where Z is the charge of the ion, F = 96,480 J/(V·mol) is the Faraday constant, and ∆Ψ is the membrane potential (in volts). For the plasma membrane of eukaryotic cells, ∆Ψ ≈ 0.05 V (interior negative relative to the exterior), meaning that the second term of Equation 11-4 makes a substantial contribution to the overall free-energy change during ion translocation. Because ionic concentrations across plasma or intracellular membranes differ by factors of 10 or more in most cells, active transport accounts for a major portion of the energy consumption in many Cells and Tissues.
■ Box 11-2. Energy Cost of Pumping a Charged Solute
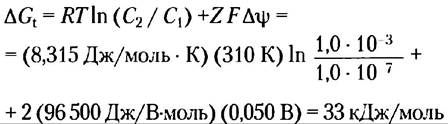
Determine The Energetic Cost (free-energy change) of pumping Calcium Ions out of the Cytosol, where their concentration is about 1.0 • 10-7 M, into the extracellular fluid, where their concentration is approximately 1.0 mM. Assume a temperature of 37 °C (mammalian body temperature) and a standard membrane potential for the plasma membrane of 50 mV (negative inside the cell).
Solution. This calculation requires taking into account both the concentration gradient of the solute and the magnitude of the electrical potential. We use Equation 11-4. Substitute R = 8.315 J/(mol • K), T = 310 K, C2 = 1.0 • 10-3, C1 = 1.0 • 10-7, F = 96,500 J/(V • mol), Z = +2 (for Ca2+), and ∆Ψ = 0.050 V. Note that the membrane potential is 50 mV (negative on the inside of the cell), so the potential change as an ion moves from the inside to the outside of the cell is 50 mV.
The Mechanism of active transport is of fundamental importance in biology. As we will see in Chapter 19, the generation of ATP in Mitochondria and Chloroplasts occurs via the reverse Mechanism of ATP-dependent ion transport. The energy supplied by the spontaneous flow of protons across the membrane can be calculated using Equation 11-4; recall that ∆G for movement down an electrochemical gradient is negative, whereas ∆G for the transport of ions against a gradient is positive.
P-type ATPases Undergo Phosphorylation during the Catalytic Cycle
The family of active transporters known as P-type ATPases comprises cation pumps that are reversibly phosphorylated by ATP (the designation "P-type" refers to the involvement of a phosphate group) as part of their transport cycle; phosphorylation triggers a conformational transition that is key to moving the cation across the membrane. The human genome encodes at least 70 P-type transport ATPases; they share similar Amino acid sequences and structures, especially near the phosphorylated Asp residue. All of them are integral proteins consisting of a single polypeptide chain with eight or ten transmembrane segments (Type III in Fig. 11-8) and are sensitive to inhibition by vanadate, a phosphate analogue.

P-type transporters are widely distributed among eukaryotes and Bacteria. In virtually all animal tissues, Na+/K+-ATPases (a Na+ and K+ antiporter) and Ca2+-ATPases (a Ca2+ uniporter) operate as P-type ATPases that maintain the differences in ionic composition between the cytosol and the extracellular environment. Parietal cells lining the mammalian Stomach contain a P-type ATPase that pumps H+ and K+ across the plasma membrane, thereby maintaining the acidity of The Stomach contents. In vascular plants, P-type ATPases pump protons out of the cell, establishing an electrochemical gradient of 2 pH units and 250 mV across the plasma membrane. A similar P-type ATPase in the bread mold Neurospora pumps protons out of the cell to establish a negative internal membrane potential, which is utilized to drive the uptake of substrates and ions from the environment via secondary active transport. Bacteria employ P-type ATPases to export toxic heavy Metal Ions such as Cd2+ and Cu2+.
The P-type Ca2+ pump, which maintains a low concentration of Ca2+ in the cytosol of virtually all cells, is the most thoroughly studied. The plasma membrane Ca2+ pump transports calcium ions out of the cell, whereas another P-type pump in The Endoplasmic reticulum moves Ca2+ into the ER lumen—a compartment segregated from the cytosol. In myocytes, Ca2+ is sequestered in a specialized form of the endoplasmic reticulum known as the sarcoplasmic reticulum; the release of these Ca2+ ions serves as the trigger for Muscle contraction.
Sarcoplasmic and endoplasmic reticulum calcium pumps (SERCA) are P-type ATPases that are very similar in structure and mechanism. The SERCA pump of the sarcoplasmic reticulum, which accounts for 80% of the protein in this membrane, consists of a single polypeptide (Mr ~ 100,000) that spans the membrane ten times (Fig. 11-35). Three cytoplasmic domains formed by long loops connect the transmembrane helices: the N domain, which binds the ATP nucleotide and Mg2+; the P domain, which contains the phosphorylated Asp residue characteristic of all P-type ATPases; and the A domain (actuator domain), which mediates contact between the N and P domains and the two Ca2+-binding sites. The M domain contains transmembrane helices and Ca2+-binding sites located near the middle of the membrane bilayer, some 40–50 Å away from the phosphorylated Asp residue, meaning that the phosphorylation and dephosphorylation of Asp do not directly affect calcium ion binding.
Figure 11-35. Sarcoplasmic reticulum Ca2+ pump: SERCA (PDB ID 1EUL). Ten transmembrane helices surround the channel through which Ca2+ moves across the membrane. Two of these helices are interrupted near the middle of the bilayer, and their non-helical regions form binding sites for two Ca2+ ions (purple). The carboxylate groups of an Asp residue in one helix and a Glu residue in the other are critical for the Ca2+-binding sites. Three globular domains project into the cytoplasm: the N domain (nucleotide-binding; outlined in green) contains the ATP-binding site; the P domain (phosphorylation domain) contains the Asp351 residue (circled in orange), which undergoes reversible phosphorylation; and the A domain (actuator; cyan triangle) mediates structural transitions that alter the affinity of the Ca2+-binding site for Ca2+ and its orientation toward either the cytoplasm or the lumen of the reticulum. Note the large distance between the phosphorylation site and the Ca2+-binding sites. This architecture of the SERCA pump serves as the prototype for all P-type ATPases; it reveals several residues (highlighted in red) that are conserved across all members of the P-type ATPase family.
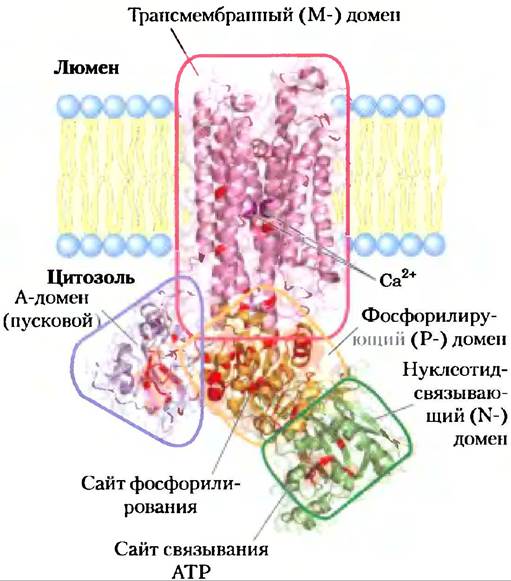
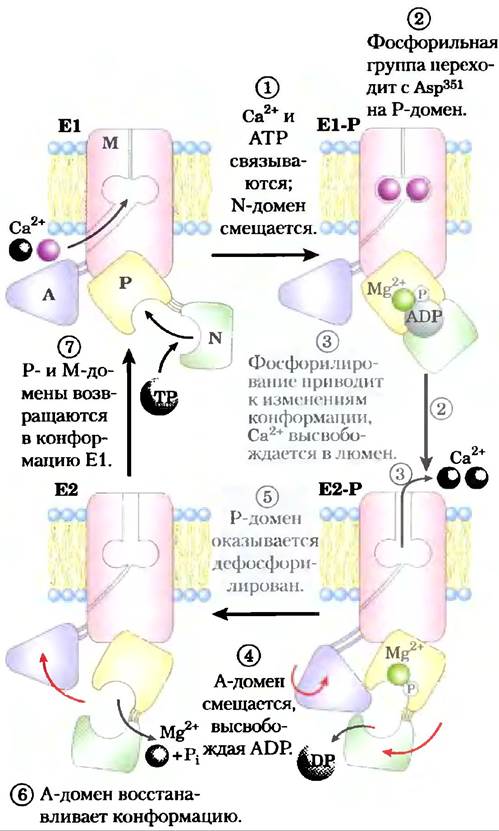
The putative mechanism of SERCA pumps (Fig. 11-36) involves large conformational changes and the phosphorylation-dephosphorylation of a key Asp residue in the P domain, which are known to occur during the catalytic cycle. In each catalytic cycle, two calcium ions are translocated across the membrane while an ATP molecule is converted to ADP and Pi. The function of ATP binding and hydrolysis is to drive a Transition Between Two conformations of the transporter (E1 and E2). In the E1 conformation, the two Ca2+-binding sites face the cytosolic side of the endoplasmic or sarcoplasmic reticulum and bind Ca2+ ions with very high affinity. ATP binding and the phosphorylation of Asp trigger a conformational shift from E1 to E2, in which the Ca2+-binding sites now face the inner (luminal) side of the membrane, their affinity for Ca2+ drops dramatically, and Ca2+ is released into the reticular lumen. Through this mechanism, the energy of ATP hydrolysis during a single phosphorylation-dephosphorylation cycle drives Ca2+ across the membrane against a steep electrochemical gradient.
Figure 11-36. MECHANISM OF ACTION of the SERCA pump. At THE START OF the transport cycle, the protein exists in the E1 conformation, with the calcium ion-binding sites facing the cytosol. Two Ca2+ ions bind, followed by the binding of an ATP molecule to the transporter, which phosphorylates the Asp351 residue to form E1–P. Phosphorylation drives the transition to the E2–P conformation, in which the calcium-binding sites (now exhibiting low affinity for Ca2+ ions) are exposed to the opposite side of the membrane (facing the extracellular space/lumen), allowing the calcium ions to dissociate and leave. Finally, E2–P undergoes dephosphorylation, returning the protein to the initial E1 state and resetting the transport cycle.
Variations on this basic mechanism are found in the plasma membrane Na+/K+-ATPase, discovered by Jens Skou in 1957. This cotransporter couples the phosphorylation-dephosphorylation of a crucial Asp residue to the simultaneous movement of Na+ and K+ against their respective electrochemical gradients (Fig. 11-37). The Na+/K+-ATPase is responsible for maintaining a low intracellular Na+ concentration and a high intracellular K+ concentration relative to the extracellular fluid (Fig. 11-38). For every molecule of ATP converted to ADP and Pi, two K+ ions are imported and three Na+ ions are exported across the plasma membrane. Consequently, this cotransport is an electrogenic process that results in charge separation across the membrane, establishing a resting membrane potential of -50 to -70 mV (negative inside relative to outside) in animal cells. This property is shared by many cell types and is critically important for conducting action potentials in Neurons. The Central Role of the Na+/K+-ATPase is reflected in the energy devoted to this single reaction—accounting for approximately 50% of all energy expended by a resting human!

Figure 11-37. Proposed mechanism of Na+ and K+ transport by the Na+/K+-ATPase.
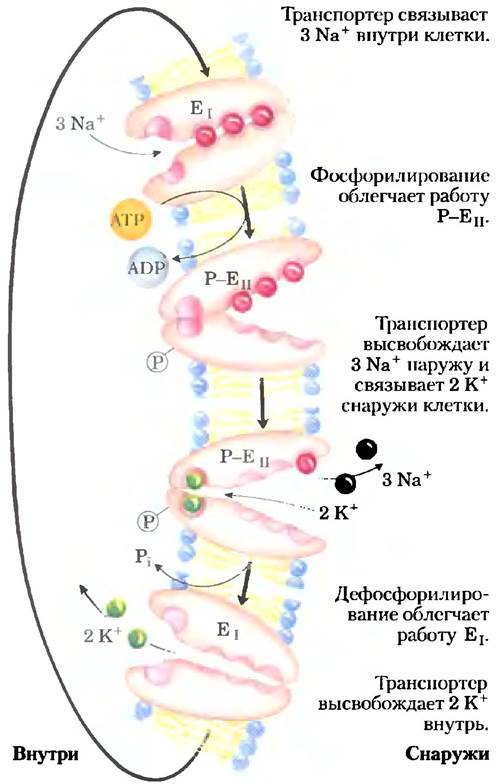
Figure 11-38. Role of the Na+/K+-ATPase in animal cells. In animal cells, this active transport system is primarily responsible for establishing and maintaining intracellular Na+ and K+ concentrations and for generating the transmembrane electrical potential. This is achieved by pumping three Na+ ions out of the cell for every two K+ ions brought in. The electrical potential plays a major role in electrical signaling in neurons, and the Na+ gradient is utilized to drive uphill cotransport of various solutes in many cell types.

P-type ATPases Are Reversible, ATP-Driven Proton Pumps
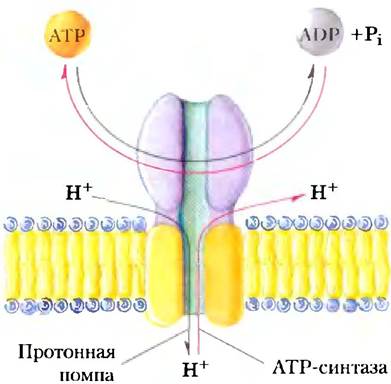
Active transport ATPases of the F-type catalyze the uphill Transmembrane Movement of protons driven by ATP hydrolysis. The designation "F-type" stems from the identification of these ATPases as energy-coupling factors. The integral membrane protein complex F0 (Fig. 11-39; the subscript "0" derives from oligomycin, its inhibitor) forms a transmembrane proton pore, whereas the peripheral protein F1 (the subscript 1 indicating that it was the first of several factors isolated from mitochondria) is a molecular motor that utilizes the energy of ATP to move protons against their gradient (into a region of higher H+ concentration). The F0F1 proton-pumping system apparently evolved at a very early stage in evolution. Bacteria such as E. coli use the F0F1 ATPase complex in their plasma membrane to pump protons outward, whereas archaea possess a homologous proton pump, the A0A1-ATPase.
Figure 11-39. STRUCTURE OF THE F0F1-ATPase/ATP synthase. F-type ATPases contain a peripheral F1 domain consisting of three α subunits, three β subunits, one δ subunit (purple), and a central stalk (γ subunit, green). The integral membrane portion of F-type ATPases, F0 (orange), contains multiple copies of the c subunit, along with one a subunit and two b subunits. F0 forms a transmembrane channel through which an average of four Protons are pumped (red arrows) for each ATP molecule hydrolyzed at the F1 β subunits. The remarkable mechanism by which these two events are coupled is described in detail in Chapter 19; it involves the rotation of F0 relative to F1 (black arrow). The structures of V0V1 and A0A1 are virtually identical to that of F0F1, and their Mechanisms of action are likely very similar as well.

The reaction catalyzed by F-type ATPases is reversible; the proton gradient can supply energy to drive the reverse reaction—ATP synthesis (Fig. 11-40). F-type ATPases operating in this direction are more commonly called ATP synthases. ATP synthases play a central role in ATP production in mitochondria during Oxidative Phosphorylation, in chloroplasts during Photophosphorylation, and in eubacteria and archaea. The proton gradient required to power ATP synthesis is generated by other proton pumps that are fueled by substrate oxidation or sunlight. We will return to a detailed Discussion of these processes in Chapter 19.
Fig. 11-40. Reversibility of F-type ATPases. An ATP-dependent proton transporter can also catalyze ATP synthesis (red arrows) when protons move down their electrochemical gradient. This is a central reaction in OXIDATIVE PHOSPHORYLATION AND photophosphorylation (both described in detail in Chapter 19).
V-type ATPases (where V stands for vacuolar), a class of proton-transporting ATPases structurally (and perhaps mechanistically) similar to F-type ATPases, are responsible for the acidification of intracellular compartments in many organisms. Proton pumps of this type maintain a pH between 3 and 6 in the vacuoles of Fungi and higher plants, which is much lower than the pH of the surrounding cytosol (pH 7.5). V-type ATPases also ensure the acidification of Lysosomes, endosomes, the Golgi apparatus, and secretory vesicles in animal cells. All V-type ATPases share a similar complex architecture: an integral (transmembrane) V0 domain that acts as a proton channel, and a peripheral V1 domain that contains the ATP-binding site and exhibits ATPase activity. The mechanism by which V-type ATPases couple ATP hydrolysis to uphill proton transport is not yet fully understood.
ABC transporters use ATP to power The active transport of numerous substrates
ABC transporters (Fig. 11-41) constitute a large family of ATP-dependent transporters that pump Amino Acids, Peptides, proteins, metal ions, various Lipids, Bile salts, and many hydrophobic compounds—including drugs—out of the cell against a concentration gradient. One human ABC transporter, the multidrug resistance transporter (MDR1), is responsible for the striking resistance of certain tumors to chemotherapeutic agents that are otherwise effective. MDR1 exhibits a broad substrate specificity for hydrophobic compounds, including such chemotherapeutic agents as adriamycin, doxorubicin, and vinblastine. By pumping these drugs out of the cell, the transporter prevents their accumulation in the tumor and thus blocks their therapeutic effects. MDR1 is an integral membrane protein (Mr ~ 170,000) with 12 transmembrane segments and two ATP-binding domains (cassettes), which give the family its name: ATP-binding cassette transporters. ■
All ABC transporters contain two nucleotide-binding domains (NBDs) and two transmembrane domains (Fig. 11-41). In some cases, all of these domains are part of a single long polypeptide; other ABC transporters consist of two subunits, each containing an NBD and a domain with six (or sometimes ten) transmembrane helices. Although many ABC transporters reside in the plasma membrane, some are also found in the Endoplasmic reticulum and in the membranes of mitochondria and lysosomes. Most ABC transporters function as pumps, but at least some members of this superfamily operate as ion channels that open and close upon ATP hydrolysis. The CFTR transporter (Box 11-3) is a Cl- channel driven by ATP hydrolysis.
Fig. 11-41. An E. coli ABC transporter. The vitamin B12 importer BtuCD (PDB ID 1L7V) is a homodimer with 10 helical transmembrane domains (cyan). Two nucleotide-binding domains (NBDs; red) are exposed to the cytoplasm. Residues involved in ATP binding and hydrolysis are shown as Ball-and-stick models.

MEDICINE. Ion Channel Defects in Cystic Fibrosis
Cystic fibrosis (CF) is a serious and relatively common inherited human disease. About 5% of white Americans are carriers, possessing one defective and one normal copy of the corresponding gene. Only individuals with two defective copies develop overt symptoms of the disease: obstruction of the gastrointestinal and respiratory tracts, usually leading to bacterial infection and death from respiratory failure before the age of 30. In CF, the thin layer of mucus that normally coats the inner surface of the lungs becomes abnormally thick, obstructing airflow and harboring pathogenic bacteria, especially Staphylococcus aureus and Pseudomonas aeruginosa.
The defective gene in CF patients was discovered in 1989. It encodes a membrane protein called the cystic fibrosis transmembrane conductance regulator (CFTR). This protein has two segments, each containing six transmembrane helices, two nucleotide-binding domains (NBDs), and a regulatory region (Fig. 1). Thus, CFTR is structurally very similar to ABC transporters. Normally, CFTR functions as a Cl--specific channel. The channel conducts chloride ions across the plasma membrane when both NBDs are bound to ATP, and it closes when the ATP at one of the NBDs is hydrolyzed to ADP and Pi. The chloride channel is regulated by the phosphorylation of several Ser residues in the regulatory domain, catalyzed by a cAMP-dependent protein kinase (Chapter 12). When the regulatory domain is not phosphorylated, the Cl- channel is closed. The CFTR mutation that causes cystic fibrosis in 70% of cases is a deletion of the Phe residue at position 508. This results in improper folding of the mutant protein and, consequently, upon its insertion into the plasma membrane, a reduction in Cl- conductance across the membranes of epithelial cells lining the respiratory tract (Fig. 2), the digestive tract, and exocrine glands (pancreas, Sweat Glands, bile ducts, and vas deferens).
Fig. 1. Three states of the cystic fibrosis transmembrane conductance regulator (CFTR). The protein consists of two segments, each with six transmembrane helices; in addition, three functionally important domains are located on the cytoplasmic surface of the membrane: NBD1 and NBD2 (green), which are nucleotide-binding domains that bind ATP, and a regulatory domain (blue), which is a site of phosphorylation by cAMP-dependent protein kinase. When this R domain is phosphorylated but no ATP is bound to the NBD domains (left), the channel is closed. ATP binding opens the channel (center), which remains in this state until ATP hydrolysis occurs. If the regulatory domain is not phosphorylated (right), it interacts with the NBD domains, preventing ATP binding and channel opening. The most common mutation leading to cystic fibrosis is the deletion of the Phe508 residue in the NBD1 domain (left). CFTR is a typical ABC transporter, but with two distinctive features: first, most ABC transporters lack a regulatory domain; second, CFTR acts as an ion channel (for Cl- ions), which is atypical for a transporter.
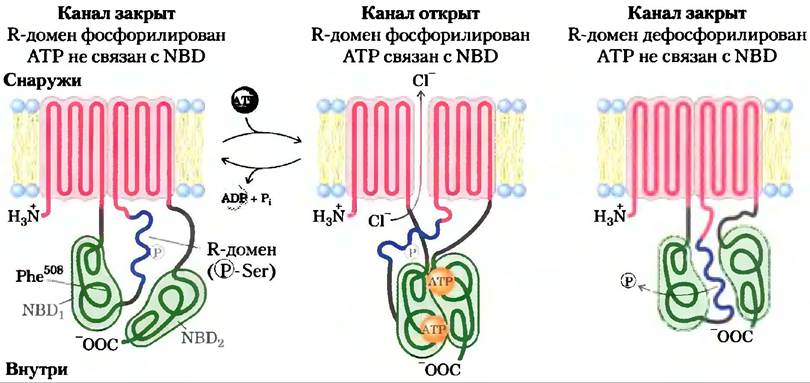
Fig. 2. Lung mucus traps bacteria. In healthy lungs, these bacteria are cleared and swept away by cilia. In CF, this bactericidal activity is impaired, leading to recurrent infections and progressive lung damage.
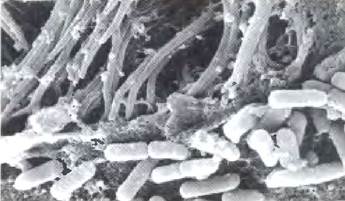
The impaired export of Cl- is accompanied by a decrease in water secretion from cells, causing the surface mucus to dry out, thicken, and become excessively sticky. Normally, cilia on the epithelial cells lining the inner surface of the lungs continuously sweep away bacteria trapped in the mucus, but the thickened mucus in CF patients hinders this process. The constant presence of bacteria such as S. aureus and P. aeruginosa causes progressive damage to the lungs and diminishes respiratory efficiency. Respiratory disease is a common cause of death in individuals suffering from CF.
The nucleotide-binding domains of all ABC proteins share similar amino acid sequences and apparently similar three-dimensional structures; they represent a conserved molecular motor that can be coupled to a variety of pumps and channels. When coupled to a pump, the ATP-dependent motor moves substances against a concentration gradient; when coupled to an ion channel, the motor opens and closes the channel, using ATP as an energy source. The stoichiometry of ABC pumps is such that approximately one molecule of ATP is hydrolyzed for each substrate molecule transported, but neither the coupling mechanism nor the substrate-binding site is known.
Some ABC transporters exhibit very high specificity for a single substrate; others are less selective. The human genome contains at least 48 genes encoding ABC transporters, many of which are involved in maintaining the composition and state of the lipid bilayer, as well as in the transport of sterols, their derivatives, and Fatty acids within the body. Flippases, which transfer Membrane Lipids from one monolayer of the bilayer to the other, are also ABC transporters; an ABC transporter is likewise part of the cellular machinery for exporting excess Cholesterol. Mutations in genes encoding some of these processes cause Genetic Disorders, including cystic fibrosis (Box 11-3), Tangier disease (Box 21-3), retinal degeneration, anemia, and Liver failure.
ABC transporters are also found in simpler animals, plants, and microorganisms. Yeast possess 31 genes encoding ABC transporters, Drosophila melanogaster has 56, and E. coli has 80 (2% of its entire genome). The presence of ABC transporters, which confers Antibiotic Resistance to pathogenic microbes (Pseudomonas aeruginosa, Staphylococcus aureus, Candida albicans, Neisseria gonorrhoeae, Plasmodium falciparum), is of paramount importance to human health and makes these transporters attractive targets for drug design. ■
Table 11-4. Cotransport Systems Powered by Na+ and H+ Gradients
Organism / tissue / cell type |
Substance transported (moves against gradient) |
Cotransported substance (moves down gradient) |
Transport type |
E. coli |
Lactose Dicarboxylic acids |
H+ H+ H+ |
Symport Symport Symport |
Intestine, Kidney (vertebrates) |
Glucose Amino acids |
Na+ Na+ |
Symport Symport |
Vertebrate cells (many types) |
Ca2+ |
Na+ |
Antiport |
Higher plants |
K+ |
H+ |
Antiport |
Fungi (Neurospora species) |
K+ |
H+ |
Antiport |
Ion gradients provide the energy for secondary active transport
Ion gradients established by primary Na+ or H+ transport can, in turn, provide the driving force for the cotransport of other substances. Many cell types contain transport systems that couple the passive downhill flow of ions to the simultaneous uphill pumping of another ion, sugar, or amino acid (Table 11-4).
Lactose Carrier (Lactose Permease)
E. coli is a well-studied prototype of proton-translocating transporters. This protein consists of a single polypeptide chain (417 residues) that functions as a monomer, mediating the cotransport of one proton and one lactose molecule into the cell, thereby driving lactose accumulation (Fig. 11-42). In E. coli, a gradient of protons and charge across the plasma membrane is typically established by The oxidation of nutrients, with the resulting oxidation energy used to pump protons outward. (This mechanism is discussed in detail in Chapter 19.) The lipid bilayer is impermeable to protons, but the lactose carrier provides a pathway for proton reentry while simultaneously translocating lactose into the cell (symport). The endergonic accumulation of lactose is thus coupled to the exergonic influx of protons, yielding a net Free energy change of ∆G < 0 for the overall process.
Fig. 11-42. Lactose uptake in E. coli. (a) Primary transport of H+ out of the cell, driven by the oxidation of diverse metabolic fuels, establishes both a proton gradient and a membrane potential (inside negative). Secondary active transport of lactose into the cell involves the symport of H+ and lactose via the transporter. The uptake of lactose against its concentration gradient is entirely dependent on this inward H+ flux driven by the electrochemical gradient. (b) When energy-yielding oxidative metabolic reactions are blocked by cyanide ion (CN-), the lactose carrier equilibrates lactose inside and outside the cell via passive transport. Mutations affecting Glu325 or Arg302 produce the same effect as the cyanide ion. The dashed line indicates the extracellular concentration of lactose.

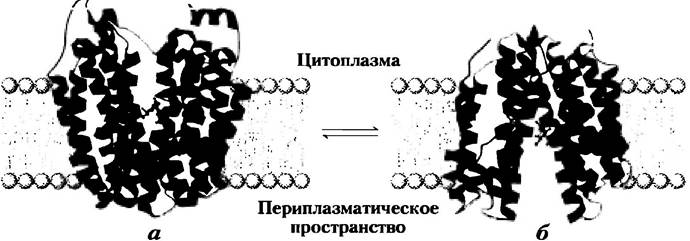
The lactose transporter is a member of the major facilitator superfamily (MFS), which comprises 28 families. Almost all proteins in this superfamily contain 12 transmembrane domains (with a few exceptions having 14). Although these proteins exhibit relatively low Sequence Homology, the similarity of their secondary structure and topology points to a common tertiary structure. Crystallographic Analysis of the E. coli lactose transporter, performed by Ron Kaback and So Iwata in 2003, provides insight into this structure (Fig. 11-43a). The protein contains 12 transmembrane helices and connecting loops that protrude into the cytoplasm or periplasmic space. The six N-terminal and six C-terminal helices form highly similar domains, yielding a structure with a loose twofold Symmetry. In the crystalline protein, a large aqueous cavity is exposed to the cytoplasmic side of the membrane. The substrate-binding site lies within this cavity, roughly in the middle of the membrane. The outward-facing side of the transporter (the periplasmic side) is tightly sealed, preventing The formation of a channel large enough for lactose entry. The proposed Mechanism of transmembrane substrate translocation (Fig. 11-43b) involves an oscillating movement between the two domains, driven by substrate binding and proton transit, which alternately exposes the substrate-binding site to the cytoplasm and the periplasm. This model, known as the alternating access or rocking-bundle model, is similar to the mechanism proposed for GLUT1 (Fig. 11-31).
Fig. 11-43. The E. coli lactose transporter (lactose permease). (a) A ribbon representation of the protein, viewed parallel to the membrane plane, reveals 12 transmembrane helices organized into two nearly symmetrical domains (colored in different shades of blue). In this crystal structure, the sugar substrate (red) is bound near the middle of the membrane, where it is exposed toward the cytoplasm (PDB ID 1PV7). (b) Proposed Introduction/11.html">Secondary structure of the transporter, deduced from large reversible Conformational Changes in which the two domains tilt apart, exposing the substrate-binding site first to the periplasm (right structure) for lactose capture, and then to the cytoplasm (left) for lactose release. The interconversion between these two forms is driven by changes in ion pairing (dependent on the transmembrane proton gradient) between charged (protonatable) side chains, such as Glu325 and Arg302 (green).
How is the inward movement of a proton coupled to lactose uptake? Extensive genetic analysis of the lactose transporter has revealed that out of the 417 amino acid residues in the protein, only six are strictly essential for the cotransport of H+ and lactose—some participate in lactose binding, while others mediate the transport of pro-
tons. A mutation in either of two residues (Glu325 and Arg302; Fig. 11-43) leaves the protein capable of catalyzing the facilitated diffusion of lactose, but abolishes its ability to couple the H+ flux to the uphill transport of lactose. A similar effect is observed in wild-type (nonmutant) cells when their capacity to generate a proton gradient is blocked by CN- ions: the carrier performs facilitated diffusion normally, but cannot pump lactose against its concentration gradient (Fig. 11-42b). The balance between the two conformations of the lactose transporter is modulated by changes in charge-pair formation between side chains. In intestinal epithelial cells, glucose and Certain amino acids are accumulated via symport driven by the inward Na+ gradient established by the plasma membrane Na+/K+-ATPase (Fig. 11-44). The apical surface of intestinal epithelial cells is covered with microvilli—long, slender projections of the plasma membrane that vastly increase the surface area exposed to the intestinal lumen.
2Na+out + glucoseout > 2Na+in + glucosein
Fig. 11-44. Glucose transport in intestinal epithelial cells. A glucose molecule is cotransported with Na+ across the apical plasma membrane into the epithelial cell. It moves across the cell toward the basal surface, where it enters the blood via GLUT2, a passive glucose transporter. The Na+/K+-ATPase continuously pumps Na+ outward to maintain the gradient that drives glucose uptake. Na+-glucose symporters in the apical plasma membrane capture glucose from the intestine through a process powered by the downhill flow of Na+ along its electrochemical gradient.
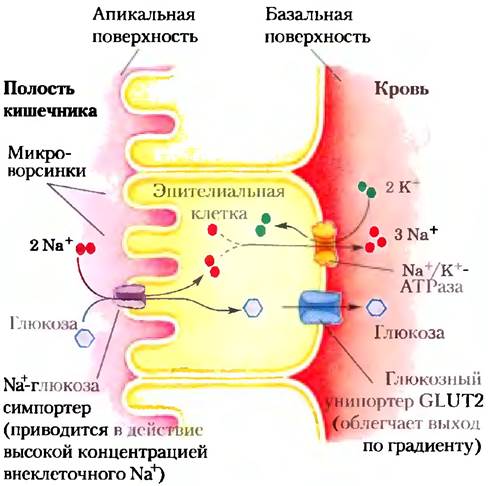
The energy required for this process is derived from two sources: a higher Na+ concentration outside than inside (chemical potential) and the transmembrane electrical potential, which is negative on the inside of the membrane, thereby drawing Na+ inward.
Box 11-3 Energetic Cost of Symport
Calculate the maximum ratio
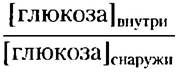
that can be achieved by Na+-glucose symporters in the plasma membrane of an epithelial cell, given that [Na+]in = 12 mM, [Na+]out = 145 mM, the membrane potential = -50 mV (inside negative), and the temperature is 37 °C.
Solution. Using Equation 11-4 (p. 559), we can calculate the Free energy of the Na+ electrochemical gradient—that is, the energy cost of moving a single Na+ ion against this gradient:

Substituting the numerical values for R, T, and F, the given value for [Na+] (in moles), Z = +1 (since the Na+ ion carries a single positive charge), and ∆ψ = 0.050 V. Note that the membrane potential is 50 mV (inside negative), so the potential change upon moving an ion from the cell to the exterior is 50 mV.

This value of ∆Gt represents the potential energy change associated with the transport of one mole of Na+ ions, and this energy can be harnessed to drive glucose transport. Given that the symport of a single glucose molecule is coupled to the influx of two Na+ ions down their electrochemical gradient, the total energy available for the transport of 1 mol of glucose is 2 × 11.2 kJ/mol = 22.4 kJ/mol. We can now determine the maximum glucose concentration gradient achievable by this pump using Equation 11-3 (p. 559):
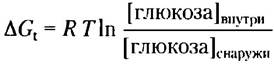
Substituting the values for ∆Gt, R, and T, we obtain
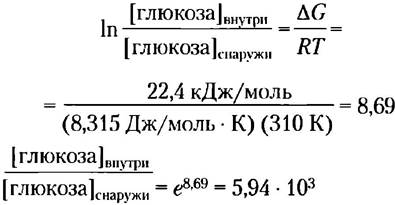
Thus, via the cotransport mechanism, glucose can continue to enter the epithelial cell until its intracellular concentration exceeds its extracellular concentration (in the intestine) by nearly 6,000-fold.
As glucose is transported from the intestine into the epithelial cell at the apical surface, it is simultaneously transferred from the cell into the bloodstream via passive transport mediated by the glucose transporter GLUT2 at the basal surface (Fig. 11-44). The critical role of Na+ in such symport and antiport systems necessitates the continuous extrusion of Na+ from the cell to maintain the transmembrane Na+ gradient.
Given The Importance of ion gradients for active transport and energy conservation, compounds that dissipate ion gradients across cell membranes act as potent poisons; those specific to infectious microorganisms can serve as Antibiotics. For instance, valinomycin, a cyclic peptide with hydrophobic properties, neutralizes the charge of K+ by encasing the ion with six carbonyl oxygen atoms (Fig. 11-45). It functions as a mobile carrier, shuttling K+ across the membrane down its concentration gradient and thereby diminishing that gradient. Compounds that transport ions across membranes via a shuttle mechanism are termed ionophores ("ion bearers"). Both valinomycin and monensin (a Na+-carrying ionophore) are antibiotics. They kill microbial cells by disrupting secondary transport processes and energy-conserving reactions. Monensin finds widespread application as an antifungal and antiparasitic agent. ■
Fig. 11-45. Valinomycin—a K+-binding peptide ionophore. Molecular surface contours are shown as a transparent mesh revealing the backbone structure of the peptide and the K+ ion (green). Oxygen atoms (red), which bind K+, are embedded within the central hydrophilic cavity. Hydrophobic amino acid side chains (yellow) coat the exterior of the molecule. Because the outer surface of the K+-valinomycin complex is hydrophobic, the complex readily diffuses across membranes, carrying K+ down its concentration gradient. The resulting loss of the transmembrane ion gradient kills microbial cells, making valinomycin a potent antibiotic.

Aquaporins form hydrophilic transmembrane channels for water transport
Integral membrane proteins include aquaporins (AQPs), which were discovered by Peter Agre. Aquaporins form channels that facilitate the rapid Movement of water molecules across the plasma membrane (Table 11-5 provides several examples). Mammals possess 11 distinct aquaporins, each exhibiting a specific tissue localization and specialized physiological role (Table 11-5). Erythrocytes—which rapidly swell or shrink in response to sharp shifts in extracellular osmolality as blood passes through the renal medulla—contain high levels of aquaporins in their plasma membrane (2 • 105 AQP-1 molecules per cell). Water secretion by exocrine glands, which produce sweat, saliva, and tears, occurs via aquaporin-mediated pathways. Urine Formation and water reabsorption in the nephrons (the functional units of the kidneys) involve seven different aquaporins. Each renal aquaporin is localized to a specific region of the nephron and possesses unique functional and regulatory properties. For example, AQP-2 in the renal collecting duct epithelial cells is regulated by vasopressin (also known as antidiuretic hormone): higher vasopressin concentrations lead to increased water reabsorption in the kidneys. Mutant mice lacking the AQP-1 gene exhibit severe polyuria (excessive urine production) and an impaired ability to concentrate urine, resulting from decreased water permeability in the proximal tubules. Genetic Defects in human aquaporins are known to cause various disorders, including a relatively rare form of nephrogenic diabetes insipidus (Box 11-2).

Table 11-5. Permeability Characteristics and Predominant Localization of Known Mammalian Aquaporins
Aquaporin |
Permeant Solute (Permeability) |
Tissue Localization |
Intracellular Localization* |
AQP-0 |
Water (low) |
Lens |
Plasma membrane |
AQP-1 |
Water (high) |
Erythrocytes, kidneys, lungs, vascular endothelium, brain, eyes |
Plasma membrane |
AQP-2 |
Water (high) |
Kidneys, vas deferens |
Apical plasma membrane, intracellular vesicles |
AQP-3 |
Water (high), glycerol (high), urea (variable) |
Kidneys, Skin, lungs, eyes, colon |
Basolateral plasma membrane |
AQP-4 |
Water (high) |
Brain, skeletal muscle, kidneys, lungs, stomach, small intestine |
Basolateral plasma membrane |
AQP-5 |
Water (high) |
Salivary Glands, lacrimal glands, sweat glands, lungs, cornea |
Apical plasma membrane |
AQP-6 |
Water (low), anions (NO3- > Cl-) |
Kidneys |
Intracellular vesicles |
AQP-7 |
Water (high), glycerol (high), urea (high), arsenite ion |
Adipose tissue, kidneys, testes |
Plasma membrane |
AQP-8** |
Water (high) |
Testes, kidneys, liver, pancreas, small and large intestines |
Plasma membrane, intracellular vesicles |
AQP-9 |
Water (low), glycerol (high), urea (high), arsenite ion |
Colon, leukocytes, brain, testes |
Plasma membrane |
AQP-10 |
Water (low), glycerol (high), urea (high) |
Small intestine |
Intracellular vesicles |
* For aquaporins stably expressed in either the apical or basolateral membrane, localization is indicated for that specific membrane; for those found in both, localization is designated as the plasma membrane.
** AQP-8 is also permeable to urea.
Aquaporins are found in All living organisms. The plant Arabidopsis thaliana possesses 38 genes encoding various types of aquaporins, reflecting the critical Role of water transport in plant physiology. Changes in turgor pressure, for example, require the rapid movement of water across membranes (see p. 85).
Water molecules flow through the AQP-1 channel at a rate of ~109 s-1. For comparison, the highest known turnover number for an enzyme is exhibited by catalase at 4 • 107 s-1, whereas most enzymes have turnover numbers ranging from 1 to 104 s-1 (Table 6-7). The low activation energy for water permeation through aquaporin channels (∆G* < 15 kJ/mol) suggests that water moves through the channels in a continuous single-file stream driven by an osmotic gradient (for a discussion of osmosis, see p. 85). Crucially, aquaporins exclude protons (hydronium ions, H3O+), the leakage of which would dissipate the membrane's electrochemical potential. And indeed, they do not permeate. What is the structural basis for this remarkable selectivity of aquaporins?
The answer is revealed by The structure of AQP-1, determined via X-ray crystallography. The AQP-1 molecule (Fig. 11-46a) is a tetramer composed of four identical monomers (each with an Mr of 28,000), with each monomer forming a transmembrane pore wide enough to allow water molecules to pass in single file. Each monomer consists of six helical transmembrane segments and two shorter helices, both containing the conserved Asn-Pro-Ala (NPA) sequence. The six transmembrane helices form the pore along the length of the monomer, whereas the two short loops containing the NPA motifs extend toward the middle of the bilayer from opposite sides, creating a "selectivity filter"—a structure that permits the passage exclusively of water molecules (Fig. 11-46b).
Fig. 11-46. Aquaporin. This protein is a tetramer composed of four identical monomers, each forming a transmembrane pore. (a) Monomer of spinach aquaporin SoPIP2;1 (PDB ID 2B5F), viewed parallel to the membrane plane. The helices form the central pore, and two short helical segments (green) interact with the Asn-Pro-Ala (NPA) sequences that form part of the water channel and are conserved in all aquaporins. (b) Diagram of bovine aquaporin-1 (PDB ID 1J4N) showing that the pore (brown; filled with water molecules depicted as red-and-white spheres) constricts near the residue His180 to a diameter of 2.8 Å (roughly the size of a water molecule), preventing the passage of molecules larger than water. The positive charge of Arg195 prevents cations, particularly H3O+, from permeating the pore. Two short helices (green) orient their dipole positive ends toward the pore, helping to reorient water molecules as they traverse the channel; this disrupts hydrogen-bonded chains of water molecules and prevents proton conduction via "proton hopping" (see Fig. 2-13).

At the center of the membrane, the water channel narrows to a diameter of 2.8 Å, which strictly limits the size of molecules capable of passing through. The positive charge of a conserved Arg residue at this constriction point repels cations, notably H3O+. The residues lining the channel of each AQP-1 monomer are generally nonpolar. However, backbone peptide carbonyl oxygens projecting into the narrow region of the channel can form Hydrogen Bonds with individual permeating water molecules, and two Asn residues (Asn76 and Asn192) within the NPA loops also hydrogen-bond with water. This architecture excludes nearby water molecules that could otherwise form a continuous chain capable of facilitating rapid proton hopping (see Fig. 2-13) across the membrane. The Arg and His residues, along with the electric dipoles generated by the short helices of the NPA loops, establish positive electrostatic fields that repel protons, preventing them from traversing the pores while also disrupting hydrogen bonding between adjacent water molecules.
The aquaporin isolated from spinach functions as a gated channel: it is open when two Ser residues near the intracellular Mouth of the channel are phosphorylated, and closed when they are dephosphorylated. This protein has been characterized in both states using X-ray crystallography. Phosphorylation promotes a conformation in which two adjacent Leu residues and a His residue project into the channel lumen, blocking further water progression and effectively occluding the channel. Although other aquaporins are regulated by distinct mechanisms, The ultimate outcome in all cases is a rapid modulation of membrane water permeability.
Typically, aquaporins are strictly water-selective, but certain family members also conduct glycerol and urea at high rates (Table 11-5). These aquaporins are thought to play a vital role in glycerol metabolism. For instance, AQP-7, located in the plasma membrane of adipocytes (fat cells), efficiently transports glycerol. Mice with an AQP-7 deficiency develop obesity and adult-onset diabetes, presumably due to an inability to transport glycerol into or out of adipocytes during the interconversion of triacylglycerols and fatty acids/glycerol.
Ion-selective channels enable the rapid movement of ions across membranes
Ion-selective channels, first discovered in neurons and now known to be present in the plasma membranes of all cells as well as in eukaryotic intracellular membranes, employ a distinct mechanism for translocating inorganic ions across membranes. Together with ion pumps such as the Na+/K+-ATPase, ion channels dictate the plasma membrane permeability to specific ions, regulate cytosolic ion concentrations, and govern the membrane potential. In neurons, extremely rapid gating of ion channels produces shifts in membrane potential (action potentials) that transmit signals from one end of the neuron to the other. In myocytes, the rapid opening of Ca2+ channels in the sarcoplasmic reticulum releases Ca2+ ions that trigger muscle contraction. We examine the signaling roles of ion channels in Chapter 12. Here, we focus on the structural basis of ion channel function, using the bacterial K+ channel, the neuronal Na+ channel, and the Acetylcholine Receptor ion channel as prime examples.
Ion channels differ from ion transporters in at least three fundamental respects. First, the translocation rate through ion channels can be several orders of magnitude greater than the turnover number of a transporter—ranging from 107 to 108 ions per second for an ion channel, which approaches the theoretical limit for uninhibited diffusion. Second, ion channels are non-saturating: their transport rate does not reach a plateau at high substrate concentrations. Third, ion channels are gated—they open or close in response to specific cellular triggers. In Ligand-gated channels (which are typically oligomers), the binding of an extracellular or intracellular small molecule induces an allosteric conformational shift in the protein that opens or closes the channel. In voltage-Gated ion channels, Changes in the transmembrane electrical potential (Vm) drive the movement of a charged protein domain relative to the membrane, thereby opening or closing the channel. Both regulatory mechanisms can be extremely rapid. A channel typically opens within fractions of a millisecond and may remain open for only a few milliseconds, making these molecular devices exceptionally well-suited for ultra-fast signal transmission in The Nervous system.
Ion channel activity is measured and characterized using electrical parameters
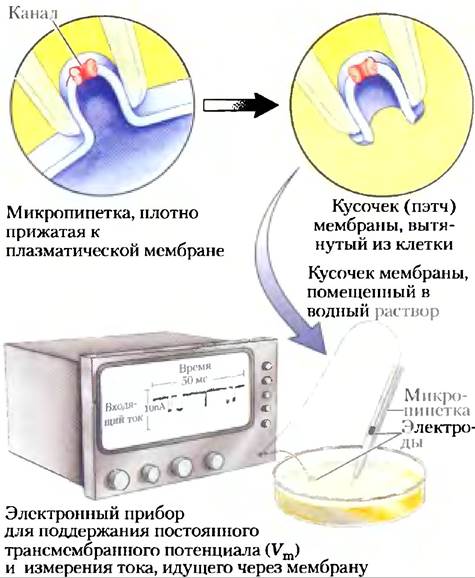
Because an individual ion channel typically remains open for only a few milliseconds, capturing this event directly is beyond the limits of most biochemical experiments. Consequently, ion fluxes must be quantified either as changes in potential Vm (in the millivolt range) or as electrical currents I (in the microampere or picoampere range) using microelectrodes and specialized amplifiers. The patch-clamp technique, developed by Erwin Neher and Bert Sakmann in 1976, measures minuscule currents passing through a tiny patch of the membrane surface containing as few as one or a few ion channel molecules (Fig. 11-47). Researchers can measure the magnitude and duration of the current flowing during a single channel opening event, determine the frequency of channel opening, and assess the effects of the transmembrane potential, regulatory ligands, toxins, and other agents on channel kinetics. Patch-clamp studies have demonstrated that 104 ions can traverse a single open ion channel in 1 ms. Such ionic currents represent an enormous Amplification of the initial signal; for example, opening the acetylcholine receptor channel requires the binding of only two acetylcholine molecules (see below).
Fig. 11-47. Electrical measurements of ion channel function. Channel "activity" is assessed by measuring the ion current flowing through it using the patch-clamp technique. A fine-tapered Glass pipette (micropipette) is pressed against the cell surface, and negative pressure inside the pipette creates a tight seal between the glass and the membrane. As the pipette is pulled away from the cell, it tears off a tiny patch of membrane (which may contain one or more channels). Once the pipette and the excised patch on its tip are placed in an aqueous solution, channel activity can be measured as the electrical current flowing between the pipette interior and the aqueous bathing solution. In effect, this creates an electrical circuit where a specific transmembrane potential is maintained, and the current required to maintain this voltage is measured. Using highly sensitive detectors, currents flowing through a single ion channel—typically on the order of a few picoamperes—can be recorded. By plotting current as a function of time (in milliseconds), one can determine how rapidly a channel opens and closes, how frequently it opens, and how long it remains open. Conducting such measurements at various Vm values makes it possible to evaluate The Effect of Changes in membrane potential on these kinetic parameters.

The structure of the K+ channel dictates its specificity
The structure of the potassium channel from the bacterium Streptomyces lividans was solved by Roderick MacKinnon in 1998 using X-ray crystallography, providing crucial insights into how the channel functions. The Amino Acid Sequence of this bacterial ion channel is homologous to all other known K+ channels, including the voltage-gated K+ channels of Nerve Cells. Within this protein family, sequence conservation is highest in the "pore region," which contains the ion-selectivity filter. This filter allows K+ ions (radius 1.33 Å) to pass 10,000 times faster than Na+ ions (radius 0.95 Å)—at a rate (approx. 108 ions/s) that approaches the theoretical limit of unhindered diffusion.

The K+ channel is composed of four identical subunits that span the membrane, forming an inverted cone surrounding the ion channel pore, with the wide end of the double cone facing the extracellular space (Fig. 11-48). Each subunit contains two transmembrane α-helices, as well as a third, shorter helix that contributes to pore formation. The outer cone is formed by one of the transmembrane helices from each subunit. The inner cone, formed by the other four transmembrane helices, lines the ion channel and Supports the ion-selectivity filter.
Fig. 11-48. The K+ channel from Streptomyces lividans. (PDB ID 1BL8) (a) View parallel to the membrane plane. The channel consists of eight transmembrane helices (two from each of the four identical subunits) forming a cone with its wide end opening toward the extracellular space. The inner helices of the cone (lighter shading) line the transmembrane pathway, while the outer helices interact with the lipid bilayer. Short segments from each subunit converge at the wide outer end of the cone to form the selectivity filter, (b) View looking down the central axis, perpendicular to the membrane plane, showing the four subunits arranged around a central pore that is wide enough to accommodate a single K+ ion. (c) Schematic cross-section of the K+ channel, highlighting key structural features essential for its function (see also Fig. 11-49).

Both the high ion selectivity and the rapid ion flux through the channel can be explained by our understanding of its atomic structure. Near the extracellular and intracellular entrances, the channel contains several negatively charged amino acid residues that presumably increase the local concentration of cations such as K+ and Na+. An ion's journey through the membrane begins (at the inner surface) via a wide, water-filled vestibule where the ion can retain its hydration shell. Further stabilization is provided in the pore region by short α-helices from each subunit, whose partial negative electric dipole charges are "aimed" at the K+ ion in the channel. About two-thirds of the way across the membrane, the pathway narrows into the selectivity filter, forcing the ion to shed its hydrating water molecules. Carbonyl oxygen atoms in the backbone of the selectivity filter replace the water molecules of the hydration shell, creating a series of perfectly coordinated sites through which the K+ ion moves. This favorable interaction with the filter is energetically impossible for a Na+ ion, which is too small to properly contact the potential oxygen ligands. This preferential stabilization of K+ favors the conductive conformation of the selectivity filter; mutations that alter amino acid residues in this site abolish ion selectivity. The filter binding sites are flexible enough to narrow to fit entering Na+ ions, but doing so triggers conformational changes that cause the channel to gate shut.
The selectivity filter contains four potential K+-binding sites, each formed by an oxygen "cage" that provides ligands for K+ ions (Fig. 11-49). In the crystal structure of the selectivity filter, two K+ ions are visible, spaced ~ 7.5 Å apart, with two water molecules occupying the intervening positions. K+ ions traverse the filter in single file; mutual electrostatic repulsion between the ions counteracts the attractive interaction with the filter and facilitates their movement. The movement of the two K+ ions is coupled: they simultaneously occupy sites 1 and 3, and then jump to sites 2 and 4 (Fig. 11-48c). The energy difference between these two configurations (1/3 and 2/4) is extremely small. Energetically, the selectivity pore is not a series of hills and valleys, but rather a nearly flat energy landscape optimized for rapid ion transit. The channel structure has clearly been evolutionarily optimized to achieve both maximum flow rates and high specificity.
Fig. 11-49. K+-binding sites within the selectivity pore of the K+ channel. (PDB ID 1J95) Carbonyl oxygen atoms (red) of the peptide backbone protrude into the selectivity pore, interacting with and stabilizing the permeating K+ ion. These ligands are positioned in an optimal geometric arrangement to coordinate each of the four K+ ions, but they cannot effectively coordinate smaller Na+ ions. This preferential interaction with K+ forms the basis of ion selectivity. Electrostatic repulsion between adjacent K+ ions ensures that only two of the four sites are occupied at any given time (both green or both blue), preventing a single K+ ion from binding too tightly to any one site. The combined effect of K+ coordination by carbonyl oxygens and interionic repulsion guarantees that an ion continues moving, shifting positions on a 10–100 ns timescale without encountering large energy barriers along its pathway through the membrane.

Voltage-Gated Potassium Channels have a more complex architecture than the simple channel shown in Fig. 11-48, but the core structural elements are conserved. For example, mammalian voltage-gated channels of the Shaker family share the same basic pore module as the bacterial channel in Fig. 11-48, but they possess additional Protein domains sensitive to membrane potential. These voltage-sensing domains move in response to changes in the membrane potential, thereby triggering the opening or closing of the K+ channel (Fig. 11-50). The most critical transmembrane helix of the Shaker K+ channel voltage sensor contains four conserved Arginine residues. The positive charges on these side chains cause the helix to physically move across the membrane in response to shifts in the electric field (membrane potential).
Fig. 11-50. Structure of Voltage-gated potassium channels. (PDB ID 2A79) The crystal structure of the rat brain Kv1.2–β2 complex reveals both the core K+ channel architecture (corresponding to Fig. 11-48) and the additional structural elements that confer voltage sensitivity: four transmembrane helical segments per subunit and four auxiliary β subunits. The entire complex is shown viewed parallel to the membrane plane (a) and perpendicular to the membrane from the extracellular side (b), with each subunit color-coded, and each β subunit matching the color of the adjacent pore-forming subunit. (b) All transmembrane helices of a single (red) subunit are numbered S1 through S6. Segments S5 and S6 from each of the four subunits form the central pore module, corresponding to the two transmembrane helices per subunit shown in Fig. 11-48. The S4 helix contains conserved arginine residues and acts as the primary gating charge carrier of the voltage-sensing mechanism. (c) Schematic diagram of a voltage-gated channel showing the central pore and the surrounding voltage-sensing domains. The S4 helix, containing the conserved arginine residues, is highlighted in orange. For clarity, β subunits are omitted from this view. Typically, the transmembrane electrical potential (negative inside the cell) exerts an electrostatic force on the positively charged arginine side chains of S4 from the cytosolic side. Upon membrane depolarization, this electrical force diminishes, and during a full Action Potential, the S4 segment is pushed outward toward the extracellular space. (d) These movements of S4 are coupled to the opening and closing of the potassium channel, depicted here in both open and closed conformations. Although K+ ions are present in the closed channel, the intracellular gate at the bottom of the pore remains shut, preventing ion flux.

Cells also express ion channels that selectively permit the passage of Na+ or Ca2+ ions while excluding K+. In each case, selectivity for a specific cation depends on the presence of a binding pocket of precisely the right dimensions—neither too large nor too small—to accommodate the ion, along with properly oriented carbonyl oxygen atoms that can strip away the ion's hydration shell. Such precise steric and chemical matching can even be achieved by molecules much smaller than proteins. For instance, valinomycin (Fig. 11-45) exhibits marked binding specificity for certain ions. Synthetic chemists have likewise engineered small molecules that bind lithium (radius 0.60 Å), sodium (0.95 Å), potassium (1.33 Å), or rubidium (1.48 Å) ions with exceptionally high affinity. However, biological structures—channel proteins—go a step further: they not only bind ions specifically, but also translocate them rapidly across the membrane.
Voltage-gated ion channels play a pivotal role in neuronal signaling
Virtually all rapid communication between neurons and target tissues (such as muscle) relies on the swift opening and closing of ion channels in the plasma membrane. For example, sodium channels in the neuronal plasma membrane sense the membrane potential and open or close in response to its fluctuations. These voltage-gated channels are highly selective for sodium ions over all other monovalent or divalent cations (which pass through these channels at less than 1% the rate of sodium ions) and support extremely high flow rates (> 107 ions/s). Under resting conditions, Na+ channels are activated (opened) by a drop in membrane potential, after which they undergo very rapid inactivation. They remain open for only a fraction of a millisecond, but stay closed (unresponsive) for much longer—several milliseconds. The processes of activation and inactivation of sodium channels form the Physiological Basis of Nerve Impulse propagation (see Fig. 12-25).
Another well-characterized ion channel is the nicotinic acetylcholine receptor, which mediates the transmission of electrical signals from motor neurons to muscle fibers at the Neuromuscular Junction (signaling the muscle to contract). (Nicotinic receptors were originally distinguished from muscarinic receptors by their sensitivity to nicotine versus the fungal alkaloid muscarine; they also differ significantly in structure and mechanism.) Acetylcholine released by a motor neuron diffuses across the narrow synaptic cleft to the muscle cell plasma membrane, where it binds to the acetylcholine receptor. This binding induces a conformational change in the receptor that opens its intrinsic ion channel. The resulting influx of positive charge depolarizes the plasma membrane, triggering muscle contraction. The acetylcholine receptor allows Na+, K+, and Ca2+ to cross the membrane with nearly equal facility, whereas other cations and all anions are excluded. The movement of Na+ through the acetylcholine receptor channel is non-saturating (current varies in direct proportion to extracellular [Na+]) and extremely rapid—about 2 • 107 ions/s under physiological conditions.
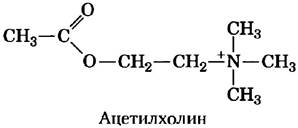
The acetylcholine receptor channel is a prototype for a large family of ion channels that generate or respond to electrical signals: it features a "gate" that opens in response to binding a signaling molecule (in this case, acetylcholine), along with an internal timer mechanism that closes the gate within a fraction of a second. Consequently, the acetylcholine signal is transient—a property essential for effective electrical signaling.
Based on sequence homology between other chemically gated ion channels and the acetylcholine receptor, receptor channels responsive to the extracellular signaling molecules γ-aminobutyric acid (GABA), Glycine, and serotonin are classified as members of the acetylcholine receptor superfamily and presumably share a common three-dimensional structure and gating mechanism. GABAA and glycine receptors are anion-specific channels permeable to Cl- and HCO3-, whereas the serotonin receptor, like the acetylcholine receptor, is cation-specific.
Another class of ligand-gated ion channels responds to intracellular ligands: 3',5'-cyclic guanosine monophosphate (cGMP) in vertebrate photoreceptors, cGMP and cAMP in olfactory neurons, and Inositol 1,4,5-trisphosphate (IP3) in numerous cell types. These channels are composed of multiple subunits, each typically containing six transmembrane helical domains. We will explore the signaling functions of these ion channels in greater detail in Chapter 12.
Several transporters listed in Table 11-6 are not discussed in this chapter; their mechanisms of action will be examined subsequently.
Table 11-6. Transport Systems Described in This Book
Transport system and localization |
Figure number |
Function |
Adenine nucleotide antiporter of The inner mitochondrial membrane |
19-28 |
Imports ADP substrate for oxidative phosphorylation and exports ATP product |
Acylcarnitine/carnitine transporter of the inner mitochondrial membrane |
17-6 |
Imports fatty acids into the matrix for β-oxidation |
Pi/H+ symporter of the inner mitochondrial membrane |
19-28 |
Supplies Pi for oxidative phosphorylation |
Malate/α-ketoglutarate transporter of the inner mitochondrial membrane |
19-29 |
Transports reducing equivalents (as malate) from the matrix to the cytosol |
Glutamate/aspartate transporter of the inner mitochondrial membrane |
19-29 |
Completes the transfer initiated by the malate/α-ketoglutarate shuttle |
Citrate transporter of the inner mitochondrial membrane |
21-10 |
Supplies citrate to the cytosol as a source of acetyl-CoA for lipid synthesis |
Pyruvate transporter of the inner mitochondrial membrane |
21-10 |
Part of the mechanism for transferring citrate from the matrix to the cytosol |
Fatty acid transporter of the myocyte plasma membrane |
17-3 |
Imports fatty acids for use as fuel |
Proton transporters of complexes I, III, and IV of the inner mitochondrial membrane |
19-6 |
Act as energy-conserving mechanisms in oxidative phosphorylation, converting electron flow into a proton gradient |
Thermogenin (uncoupling protein), proton pore of the inner mitochondrial membrane |
19-34 23-35 |
Dissipates the mitochondrial proton gradient as a mechanism of thermogenesis and/or disposal of excess fuel |
Cytochrome b6f complex, proton transporter of the chloroplast thylakoid |
19-59 |
Acts as a proton pump driven by electron flow in the Z-scheme; source of the proton gradient for photosynthetic ATP formation |
Bacteriorhodopsin, light-driven proton pump |
19-66 |
Light-driven source of a proton gradient for ATP Synthesis in halophilic bacteria |
F0F1 ATPase/ATP synthase of the inner mitochondrial membrane, chloroplast thylakoid, and bacterial plasma membrane |
19-61 |
Interconverts the energy of the proton gradient and ATP during oxidative phosphorylation and photophosphorylation |
Pi/triose phosphate antiporter of the inner chloroplast membrane |
20-15, 20-16 |
Exports photosynthetic products from the stroma; imports Pi for ATP synthesis |
Bacterial protein transporter |
27-44 |
Exports secreted proteins across the plasma membrane |
Protein translocase of the endoplasmic reticulum |
27-38 |
Transports proteins destined for the plasma membrane, secretion, or Organelles into the ER |
Nuclear pore protein translocase |
27-42 |
|
LDL receptor in the animal cell plasma membrane |
21-42 |
Imports lipid-carrying particles via receptor-mediated endocytosis |
Glucose transporter of the animal cell plasma membrane; insulin-regulated |
12-16 |
Increases the capacity of muscle and adipose tissue to clear excess glucose from the blood |
IP3-dependent Ca2+ channel of the endoplasmic reticulum |
12-10 |
Enables signal Transduction via changes in cytosolic Ca2+ concentration |
cGMP-dependent Ca2+ channel of retinal rods and cones |
12-36 |
Enables signal transduction in the vertebrate eye via rhodopsin coupling with cGMP phosphodiesterase |
Voltage-gated Na+ channel of the neuron |
12-25 |
Generates action potentials during nerve impulse transmission |
Defective ion channels can lead to adverse physiological consequences
The importance of ion channels in physiological processes becomes clear from the effects of mutations in specific channel-forming proteins (Table 11-7, Box 11-3). Genetic defects in the voltage-gated Na+ channel of the myocyte plasma membrane lead to disorders in which Muscles either experience periodic paralysis (as in hyperkalemic periodic paralysis) or become stiff and rigid (as in paramyotonia congenita). As mentioned earlier, cystic fibrosis is caused by a mutation that alters a single amino acid in the CFTR protein, a Cl- ion channel; in this case, the impairment affects not nerve impulse transmission, but rather the secretion by cells of various exocrine glands whose activity is coupled to Cl- ion flux.
Table 11-7. Some Diseases Resulting from Ion Channel Defects
Ion channel |
Affected gene |
Disease |
Na+ (voltage-gated, skeletal muscle) |
SCN4A |
Hyperkalemic periodic paralysis (or paramyotonia congenita) |
Na+ (voltage-gated, neurons) |
SCN1A |
Generalized Epilepsy with febrile seizures |
Na+ (voltage-gated, heart muscle) |
SCN5A |
Long QT syndrome 3 |
Ca2+ (neurons) |
CACNA1A |
Familial hemiplegic migraine |
Ca2+ (voltage-gated, retina) |
CACNA1F |
Congenital stationary night blindness |
Ca2+ (polycystin-1) |
PKD1 |
|
K+ (neurons) |
KCNQ4 |
Dominant deafness |
K+ (voltage-gated, neurons) |
KCNQ2 |
Benign familial neonatal convulsions |
Nonspecific cation (cGMP-gated, retina) |
CNCG1 |
Retinitis pigmentosa |
Acetylcholine receptor (skeletal muscle) |
CHRNA1 |
Congenital myasthenic syndrome |
Cl- |
CFTR |
Cystic fibrosis |
Many natural toxins target ion channels, and their actions provide even more striking illustrations of the importance of proper ion channel function. Tetrodotoxin (produced by pufferfish of the genus Sphaeroides) and saxitoxin (produced by marine dinoflagellates of the genus Gonyaulax, which cause "red tides") exert their effects by binding to voltage-gated Na+ channels in neurons, preventing the generation of
normal action potentials. Pufferfish are prepared as the Japanese delicacy fugu, but can only be prepared by chefs specially trained to separate the succulent edible flesh from the deadliness of the toxic Organs. Consumption of shellfish fed on Gonyaulax can also be lethal; the shellfish are insensitive to saxitoxin but accumulate it in their tissues, which become profoundly toxic to organisms higher up the food chain. Black mamba venom contains dendrotoxin, which interferes with the function of voltage-gated K+ channels. Tubocurarine—the active component of curare (used as an arrow poison in the Amazon basin)—and two other snake venom toxins, cobrotoxin and bungarotoxin, block the acetylcholine receptor or prevent the opening of its ion channel. By blocking nerve-to-muscle signals, all these toxins cause paralysis and even death. Conversely, the extremely high affinity of bungarotoxin for the acetylcholine receptor (Kd = 10-15 M) has proved invaluable to researchers: the radiolabeled toxin has been used to quantify the receptor during its purification. ■
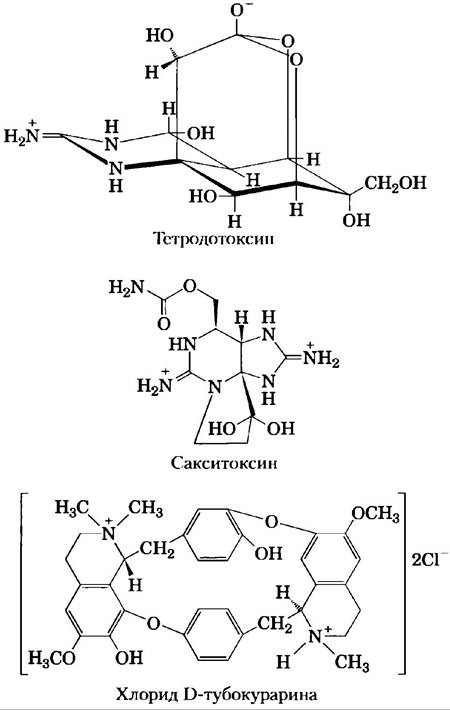
Summary of Section 11.3 Transport across Membranes
■ Carrier proteins (transporters) are required to move polar compounds and ions across Biological Membranes. Some transporters simply facilitate Passive Diffusion Across the membrane down a concentration gradient. Others carry out active movement of substances against an electrochemical gradient; such transport must be coupled to a source of metabolic energy.
■ Like enzymes, carriers exhibit saturation kinetics and stereospecificity for their substrates. Transport mediated by these systems can be either passive or active. Primary active transport is driven by ATP or electron-transfer reactions; secondary active transport results from the coupled movement of two substances, one of which (often H+ or Na+) moves down its electrochemical gradient while the other moves against its gradient.
■ GLUT transporters, such as erythrocyte GLUT1, transport glucose into cells via facilitated diffusion. These transporters are uniporters, carrying only a single substrate. Symporters enable the simultaneous transport of two substances in the same direction; examples include the E. coli lactose transporter driven by the proton gradient (lactose/H+ symporter) and the intestinal epithelial cell glucose transporter driven by the Na+ gradient (glucose/Na+ symporter). Antiporters mediate the simultaneous transport of two substances in opposite directions; examples include the chloride-bicarbonate exchanger in erythrocytes and the ubiquitous Na+/K+-ATPase.
■ In animal cells, the Na+/K+-ATPase maintains the difference between cytosolic and extracellular concentrations of Na+ and K+, and the resulting Na+ gradient is used as an energy source for A wide variety of secondary active transport processes.
■ The plasma membrane Na+/K+-ATPase and the sarcoplasmic and endoplasmic reticulum Ca2+ transporters (SERCA pumps) are examples of P-type ATPases; they undergo reversible phosphorylation during the catalytic cycle and are inhibited by the phosphate analog vanadate. F-type ATPases, which include proton pumps (ATP synthases), are central to energy-conserving mechanisms in mitochondria and chloroplasts. V-type ATPases generate proton gradients across certain intracellular membranes, including plant vacuolar membranes.
■ ABC transporters pump a wide variety of substrates out of cells, including many drugs, using ATP as an energy source.
■ Ionophores are lipid-soluble molecules that bind specific ions and passively carry them across membranes, dissipating the energy of electrochemical ion gradients.
■ Water is transported across membranes via aquaporins. Some aquaporins are regulated; certain aquaporins are also capable of transporting glycerol or urea.
■ Ion channels create hydrophilic pores through which selected ions can diffuse down an electrical or chemical concentration gradient; they are generally non-saturating and exhibit very high flow rates. Many ion channels are highly specific for a single ion, and most are gated by either voltage or ligands (chemically gated). In bacterial K+ channels, the selectivity filter allows ions with the correct geometry to replace the water hydrating the K+ ion as it passes through the membrane. Some K+ channels are voltage-gated. The acetylcholine receptor/channel is gated by acetylcholine, which induces subtle conformational changes that open and close the pathway across the membrane.
Last update: 06/08/2026
Editorial and Educational Adaptation: This material has been compiled based on the primary/original source text. The project team performed an editorial review, corrected technical inaccuracies, structured sections, and adapted the content for an educational format.
What was processed:
- elimination of formatting defects (OCR errors, structural breaks, corrupted characters);
- editorial organization of content;
- standardization of terminology in accordance with academic sources;
- verification of factual statements against the original source text.
All mentions of the author, publication year, and origin of the primary text have been preserved in accordance with the source.