Biochemistry - The Chemical Reactions of Living Cells Volume 2 - D. Metzler 1980
Enzymes: Protein Catalysts of Cells
Mechanisms of Enzymatic Catalysis
Transition State
Kinetic studies provide insight into The rate of enzyme action, yet they reveal little about how Enzymes actually catalyze reactions—that is, they shed no light on the catalytic mechanism. By mechanism, we mean a complete Description of the sequential steps through which a reaction proceeds. Most of these steps involve the breaking of one chemical bond and the simultaneous formation of another. Consider, for example, a simple displacement reaction in which a hydroxyl ion reacts with methyl iodide to yield methanol and an iodide ion as products:
Class="center">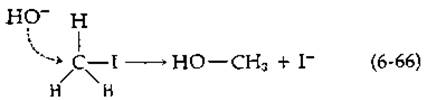
During the course of the reaction, the hydroxyl ion "attacks" the carbon atom of the methyl group while simultaneously displacing the iodide ion.
A chemical reaction like the one depicted in scheme (6-66) does not occur instantaneously. Instead, it involves the gradual stretching and partial Cleavage of the C—I bond coupled with the simultaneous formation of a new C—O bond. Such an intermediate Structure differs from ordinary chemical compounds and is energetically less stable than either the starting Materials or the products. It is known as a transition state. For the displacement reaction shown in scheme (6-66), The structure of the transition state can be represented as follows:
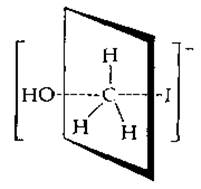
The negative charge is shared between the attacking OH group and the departing iodide. Note that the arrangement of bonds around the central carbon atom is no longer tetrahedral: the C—H bonds lie in a single plane, whereas the bonds indicated by dashed lines—connecting the carbon to the OH group and the I atom—are oriented at right angles to this plane.
When discussing reaction mechanisms, it is useful to construct a transition state diagram that illustrates how the Free energy1) G changes along the reaction coordinate (Fig. 6-12, A). The reaction coordinate has no strict physical meaning.
It merely reflects the transition from reactants to products, characterizing the degree of stretching and cleavage of an existing bond or the extent of formation of a new one. The point of highest energy corresponds to the transition state.
A more comprehensive picture of this state can be obtained from diagrams analogous to the one presented in Fig. 6-12, B. Here, contour lines of equal free energy are plotted as a function of two Bond Lengths. For reaction (6-66), the ordinate represents the length of the newly forming C— — —O bond, while the abscissa represents the length of the breaking C — — —I bond. The dashed
line passing through the "col" (or saddle point), which corresponds to the transition state, represents the locus of points of minimum energy.
The difference in free energy (G) between the initial reactants and the products on a transition state diagram corresponds to the overall free energy change (∆G) for the reaction under study, whereas the difference in free energy between the reactants and the transition state corresponds to the Free energy of activation (∆G*). ∆G≠ represents the "energy barrier" that must be overcome for the reaction to take place; this value largely determines the reaction rate.
Transition state diagrams for enzymatic reactions, which typically proceed through multiple intermediates, are more complex than the simple diagram shown in Fig. 6-12. They encompass several transition states (each corresponding to a specific step) separated by "valleys" (representing intermediate species, some of which are highly unstable). The progression from reactants to products in an enzymatic reaction can be likened to a journey across mountain ranges of varying heights, culminating in a descent to a plain.

FIG. 6-12. A. Transition state diagram illustrating The change in free energy along the reaction coordinate for The conversion of reactants to products in a chemical reaction. B. Free energy surface in bond-length space for the reaction B+X—A→-BX+A.
1) Energy E or enthalpy H may also be plotted on the ordinate. Authors frequently omit specifying which particular quantity (G, E, or H) is being used.
Last update: 06/08/2026
Editorial and Educational Adaptation: This material has been compiled based on the primary/original source text. The project team performed an editorial review, corrected technical inaccuracies, structured sections, and adapted the content for an educational format.
What was processed:
- elimination of formatting defects (OCR errors, structural breaks, corrupted characters);
- editorial organization of content;
- standardization of terminology in accordance with academic sources;
- verification of factual statements against the original source text.
All mentions of the author, publication year, and origin of the primary text have been preserved in accordance with the source.