Biological Membranes - A. N. Ogurtsov 2012
Electrogenesis of Biomembranes
Ion Channels
Membrane Channels and Transporters as Enzymes
Up to this point, we have examined the operation of membrane transport Proteins at a microscopic molecular level. It turns out that applying the exact opposite—a phenomenological approach—allows researchers to experimentally determine many parameters of transport proteins without having to conduct microscopic studies using molecular biology Methods.
The Eyring-Polanyi transition-state kinetic theory, commonly used in Enzymatic Catalysis, is successfully applied to describe various transport systems, including quantitative models for the functioning of carrier molecules and ion channels.
This approach is based on the assumption that a system can exist in several discrete states, each corresponding to a standard Electrochemical Potential value. Transitions between these states involve overcoming energy barriers, with the rate constants of these transitions depending on the height of the respective barriers.
Figure 99 shows a diagram of an ion channel along with its corresponding free-energy profiles.
Class="center">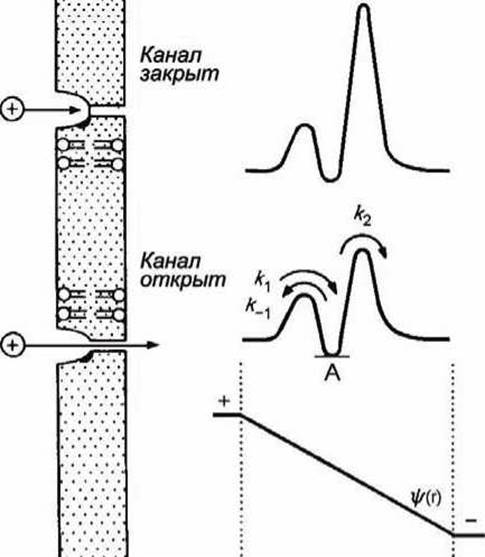
Figure 99 - Changes in the free-energy profile of an ion within an ion channel upon membrane depolarization
These profiles correspond to the case where the channel contains a single binding site located somewhere near the channel entrance. The depth of the well (point A) represents weak binding.
In the presence of a transmembrane potential difference, the electric potential profile ψ/(r) is superimposed onto the free-energy profile. Consequently, the heights of the energy barriers corresponding to k1 and k2 decrease, and The rate of cation transport through the channel increases. The minima on the free-energy curves correspond to the binding sites of the transported substances. It can be assumed that a channel or carrier possesses one or more binding sites for the transported molecules.
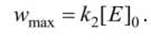
At sufficiently high concentrations of the transported substance, all these sites become occupied, and the transport rate reaches its maximum value, wmax, which equals the maximum velocity of the enzyme.
For the sake of simplicity, let us assume that ions are initially present on only one side of the membrane, that There is a single binding site inside the channel, and that ions cannot freely enter or leave the channel interior.
The case where a channel contains multiple sequential binding sites through which an ion is successively passed can be formally reduced to the situation where the channel has a single binding site, and The kinetics of such an enzyme simplify to steady-state Michaelis-Menten kinetics [9].
Assuming that the Membrane Potential φM is zero, this "enzymatic reaction" can be represented as follows
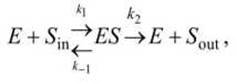
where E is the channel protein (enzyme) in the "open" state; Sin and Sout are the transported substance (substrate) inside and outside the membrane; and ES is the substrate-binding site complex within the channel.
Figure 99 illustrates the free-energy profiles for closed and open channels.
Ion Channels in the Michaelis-Menten Model. A phenomenological Treatment of Ion transport across the membrane does not require knowing the microscopic mechanism of channel gating, which may involve, for instance, a conformational shift in an α-Helix or a side chain of the membrane protein.
It is sufficient to assume that the kinetics of ion transport by a carrier protein (or an ion-channel protein) can be described by enzyme kinetics models, the simplest of which is the Michaelis-Menten model [9].
In this case, the ion transport rate (the number of transported ions per unit time) will obey the Michaelis equation
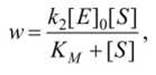
where
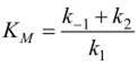
is the Michaelis constant; [E]0 is the total concentration of carriers (ion channels, ion pumps, etc.).
Let us consider two limiting cases.
1. Substrate excess [s] ≫ KМ, under which all binding sites are occupied ([E]0 ≈ [ES]), and the rate reaches its maximum value, determined by the height of the energy barrier for exiting the channel
2. Low Substrate Concentration [S] ≪ КM, where a linear dependence of the rate on substrate concentration is observed
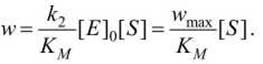
The resulting equation well describes the operation of most (if not all) ion channels.
It should be noted that even for such a simple case, the rate constant is not a true microscopic rate constant, but rather a combination of rate constants
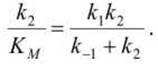
Thus, the measured rate constant that determines the transport rate through an open ion channel contains information about the apparent affinity of the ion for the binding site (КM) and the turnover number k2.
In the absence of a membrane potential, this rate constant is directly related to single-channel permeability.
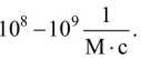
If the right-hand barrier (Figure 99) is small (k2≫ k-1), the transport rate constant will be equal to k1, the second-order rate constant for an ion entering the channel. Diffusion can be the rate-limiting factor for this reaction, with k1 being
If the right-hand energy barrier (Figure 99) is high (k2≪ k-1), the transport rate constant will be equal to the product of 
The dependence of the transport rate on the membrane potential is determined by conductance. This is easy to understand by examining how the voltage drop across the membrane affects the individual rate constants k1, k-1, and k2.
If a straight line representing a linear potential change across the membrane is superimposed on the Free energy profile (Figure 99), the energy barriers corresponding to k1 and k2 will decrease, while k-1 will increase (recall that we are considering the movement of a cation).
Simple Michaelis-Menten-type models do not predict the linear (i.e., ohmic) current-voltage relationship observed experimentally. However, additional energy barriers can be introduced into such models, after which the curve of ion flux density versus membrane potential becomes nearly linear.
The phenomenological Michaelis kinetic model is also useful for investigating the ion selectivity of channels.
Selectivity is the ability of a channel to pass certain ions better than others; it can be quantified as The ratio of permeabilities or conductances for the compared ions.
Since the expression for the transport rate constant 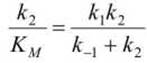 includes both k1 and k2, the cause of selective ion
conductance can be either a lower energy barrier at the channel entrance (k1) or a lower barrier for movement within the channel (k2) for a specific type of ion.
For example, if negative charges or dipoles are present near the channel entrance, the transport rate of anions may decrease, meaning the channel will be cation-selective. This phenomenon is observed in several receptor channel proteins and gramicidin A.
The sizes of the transported substances also affect the transport rate. If the size of a transported molecule exceeds the diameter of the channel, the substance cannot enter it (the molecular sieve effect).
Finally, selectivity may be related to differences in the transport rates of various ions within the channel. For instance, in the case of a selective Na+ channel, the energy barrier for The transport of this ion inside the channel is significantly lower than for other ions such as K+, leading to an increase in Na+ conductance.
It is unlikely that ion selectivity is caused by an increase in the affinity of the ion for the channel. Such a change, corresponding to a deeper well in the potential profile (marked with the letter A in Figure 99), would lead to a decrease in the rate of ion exit from the channel, i.e., to a reduction in
the maximum flux through the channel, as well as a decrease in the ion concentration required for channel saturation, i.e., a decrease in КM. However, the КM values for channels that predominantly pass Na+ or K+ are quite high (200-300 mM), which exceeds the normal physiological concentrations of these ions.
Membrane carriers. Let us consider a simple carrier with a single binding site that transports molecules across the membrane. Figure 100 illustrates the transformations of the transmembrane free energy profile during the operation of an active carrier.
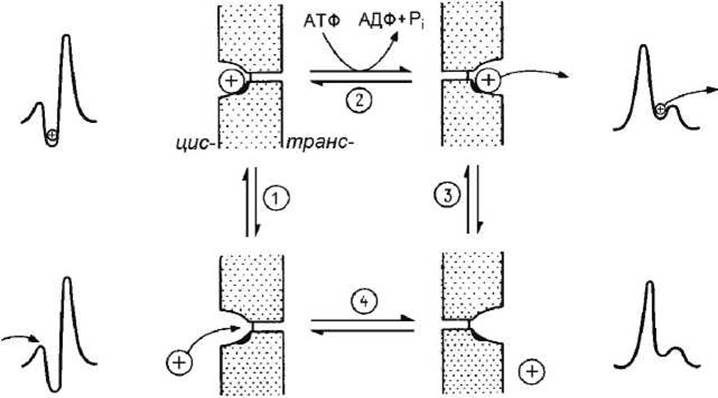
Figure 100 - Operating cycle of an active carrier
Let us consider four states of the carrier protein:
1) facing inward / bound to the substrate,
2) facing inward / unbound to the substrate,
3) facing outward / bound to the substrate,
4) facing outward / unbound to the substrate.
Then transport can be represented as the following sequence of four elementary reversible steps (Figure 100).
1. The substrate binds to the site facing one side of the membrane (defined as the cis-side).
2. A conformational change occurs, which significantly decreases the kinetic barrier for the ion to move toward the channel exit and increases the energy barrier for movement in the opposite direction. This conformational change can be spontaneous or driven by energy consumption (e.g., ATP Hydrolysis energy). The carrier site with the bound substrate now faces the opposite side of the membrane (defined as the trans-side).
3. The substrate is released from the carrier complex and exits on the opposite side of the membrane. For active carriers, the substrate affinity for the protein is lower when the binding site faces the trans-side of the membrane.
4. A conformational change occurs, returning the carrier protein to its initial conformation in which the binding site faces the cis-side once again.
Figure 101 shows a kinetic diagram, corresponding to the scheme in Figure 100, for a specific case of membrane permeases (see Section 7.6) that facilitate the diffusion of ions, Amino Acids, and sugars.

Figure 101 - Permease operation cycle
The permease spontaneously transitions from the Ei state, in which the binding site faces The Cell interior, to the E0 state with the binding site facing outward; this transition does not affect the carrier's affinity for the bound substrate. Figure 101 presents the interconversion rates for the glucose carrier from The erythrocyte membrane (at 23°C) and the anion exchanger protein (erythrocyte band 3 protein) (at 37°C). In both cases, the substrate increases the rate of conformational transition 2. Reaction 4 for the "unloaded" band 3 protein proceeds very slowly, which is why this protein catalyzes only anion exchange.
A key aspect in the operation of all carriers is the presence of a high energy barrier, which the respective proteins must undergo conformational changes to overcome. If Energy is required for this, the system can function as an active carrier (an example is the Ca2+ pump, which transports Ca2+ ions using the energy of ATP hydrolysis). If the conformational change requires the transported molecule to be bound to the protein—i.e., step 4 is absent—the protein will catalyze only substance exchange across the bilayer, since it cannot isomerize in the "unloaded" form (an example is the erythrocyte band 3 protein).
Many models and schemes have been developed to describe the operation of ion channels and various types of carriers. Although transition-state kinetic theory has certain limitations, especially regarding the kinetic properties of channels, its application simplifies the solution of many complex problems and provides a unified approach to various transport mechanisms, particularly when detailed information on the molecular Structure of membrane transport proteins is lacking.
Steady-state analysis. To kinetically characterize transport systems that catalyze Facilitated Diffusion or Active Transport, various steady-state analysis approaches can be employed. All these approaches are based on measuring the rate of solute Transport Across the membrane, but under different conditions.
As an example, we will consider experiments performed on permeases incorporated into membrane vesicles. Typically, radioactive labels are used for such measurements. The key point is that the permease must not only transport the substance across the bilayer (cis → trans) but also return back (trans → cis). The transport rate may depend on any of these steps. Let us briefly outline some approaches to the analysis.
1. The substrate is present on only one side of the membrane (cis). The initial transport rate is measured for a unidirectional flux. Importantly, to ensure a continuous flux of the transported substance, the carrier (permease) must return unladen. The flux is measured as a function of [S]cis for a process proceeding in either direction (e.g., for solute transport into or out of vesicles).
2. Equilibrium exchange. The substrate is present at equal concentrations on both sides of the membrane, but the radioactive label is present on only one side (cis). In this case, the permease can return while bound to the unlabeled substance. The flux is measured as a function of [S].
3. The labeled substrate is located on the cis-side of the membrane and is present at a saturating concentration on the opposite (trans) side. The flux is measured as a function of [S]. As in the first case, a unidirectional flux (cis → trans) is recorded. Such a flux is also termed exchange diffusion, because the labeled substance is transported against its chemical gradient.
4. The specific radioactivity of the substrate is identical on both sides of the membrane. The substrate is present at a saturating concentration on the trans-side, while [S]cis is varied. In this case, net transport is measured, as the radioactive substance crosses the membrane in both directions. Under these measurement conditions, the system is close to equilibrium.
In all cases, wmax and KM are determined, which do not necessarily coincide for different approaches. Kinetic equations for the steady state can be derived and tested for various models.
As in classical enzymology studies, The Use of inhibitors can be extremely beneficial. Moreover, inhibitors can be introduced from either side of the membrane, providing additional insight.
METABOLISM/35.html">Selection/41.html">Review Questions and exercises
1. What are non-Gated ion channels?
2. How many protein subunits make up a potassium channel?
3. Which Secondary structure elements of ion channel subunits form the selectivity filter?
4. What determines the selectivity of a potassium channel?
5. Describe the two-site model of potassium channel conduction.
6. What is The Essence of the patch-clamp technique for studying ion channels?
7. Compare the four standard configurations of patch-clamp recording for ion channel activity.
8. How does the transmembrane free energy profile change upon ion channel opening?
9. How does the scheme 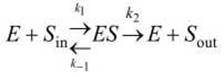 describe the operation of an ion channel?
10. Write down the Michaelis-Menten Equation and explain its constituent parameters.
11. What determines the selectivity of an ion channel in the Michaelis-Menten model when [S] ≪ KM?
12. What four elementary reversible steps constitute the kinetic cycle of a membrane carrier, viewing membrane transporters as Enzymes?
13. What four approaches are used in the steady-state kinetic analysis of membrane transport systems?
Last update: 13/08/2026
Editorial and Educational Adaptation: This material has been compiled based on the primary/original source text. The project team performed an editorial review, corrected technical inaccuracies, structured sections, and adapted the content for an educational format.
What was processed:
- elimination of formatting defects (OCR errors, structural breaks, corrupted characters);
- editorial organization of content;
- standardization of terminology in accordance with academic sources;
- verification of factual statements against the original source text.
All mentions of the author, publication year, and origin of the primary text have been preserved in accordance with the source.