Nephrology for the Family Physician - O.I. Bakaliuk 2003
Methods of Laboratory and Instrumental Examination in Kidney Diseases
While acknowledging the positive Significance of the robust compensatory mechanisms of normal Kidneys, one must also note the negative impact these very mechanisms have on the Diagnosis of renal lesions. Indeed, well-known and widespread Methods for Assessing renal function—based on determining the clearance of specific substances, GFR values, tubular reabsorption, or electrolyte balance—change only when 50–60% of nephrons become non-functional. Classical tests, such as detecting pathological proteinuria or hypercreatininemia, also lack sufficiently high sensitivity.
According to the consensus view, an ideal test for assessing renal function should be non-invasive, specific, highly sensitive, and simple to perform. In our view, no such test currently exists, and therefore we present information on the most common methods for evaluating the functional state of the kidneys.
Evaluation of the general urinalysis. [Urinalysis is an extremely important stage in examining patients across all medical specialties. As Hippocrates wrote in his Aphorisms, "...the physician must observe whether the patient's urine resembles that of a healthy person; the less the resemblance, the more severe the disease."
The value of this research method can hardly be overstated, given its simplicity and the wealth of information it provides. Although the final diagnosis of Kidney disease relies largely on instrumental methods, abnormalities detected during clinical urinalysis frequently determine the strategy and direction of subsequent instrumental investigations.
For qualitative urinalysis, a single portion is usually used, most commonly the first morning specimen. The midstream portion, obtained during free urination, is analyzed. For specific investigations, the most convenient time and physiological state are chosen: for instance, before and after meals to detect alimentary glucosuria, or while lying in bed versus standing and walking for 30–60 minutes to detect orthostatic proteinuria, etc. In women, catheter-derived urine is preferred. Under certain conditions, urine is collected into three consecutive glasses, and each portion is examined separately. Urine analysis may also evaluate the volume and properties of urine collected over a specific time interval—4, 6, 12, or 24 hours. Urinalysis is likewise performed before and after administering so-called provocation tests (prednisolone, tuberculin, Water loading or restriction, etc.).
Urinalysis includes macro- and Cell/15.html">Microscopy, as well as chemical and physical examination.
Urine volume. Urine volumes below 0.5 L/day and above 2 L/day are considered pathological. Under pathological conditions, various previously described disorders of urine excretion may occur.
Urine color. Normal urine exhibits various shades of yellow. The color intensity depends on the concentration of urinary pigments (urochrome A and B, uroroseaestrin, uroerithrin, coproporphyrin).
In pathological states, quantitative and qualitative changes in urine color are observed. The prolonged excretion of nearly colorless urine is characteristic of Diabetes Mellitus and diabetes insipidus, diuretic use, the resolution of edema, interstitial nephritis, certain types of anemia, and Chronic Kidney Disease; intensely colored urine is typical of febrile states, hyperthyroidism, and tumors. Admixtures of fresh Blood or free Hemoglobin impart a pink-red color to the urine, which subsequently turns dark brown (due to The conversion of hemoglobin into hematin or methemoglobin). The presence of Myoglobin results in a red-brown hue. Urine containing bilirubin is colored saffron-yellow or greenish-brown. Upon standing, The excretion of porphobilinogen (acute porphyria) turns urine dark red, while the release of melanogen (melanoma) causes it to turn dark brown or black. Phenacetin colors urine brownish-green, riboflavin bright yellow, aspirin pink, methyldopa pink-red, and methylene blue blue or greenish-blue.
Urinary sediment can also exhibit various colors. In the presence of high uric acid levels, the sediment resembles yellow sand; urates appear as brick-red sand; phosphates form a dense white sediment; pus appears as a cream-like, green deposit; and mucus has a jelly-like consistency.
Urine odor. Normally, urine has a faint, specific aromatic odor due to minimal amounts of volatile Fatty acids. During alkaline Fermentation, urine acquires a pungent ammoniacal odor; in diabetic ketoacidosis, the smell of rotten apples; and in the decomposition of protein, blood, or pus, a putrid odor. A characteristic urine odor also appears after consuming strong coffee, onions, garlic, vinegar, alcohol, valerian, or certain Antibiotics.
Foam. Normally, urine foams only slightly. Foam becomes more abundant and persists longer in the presence of proteinuria and glucosuria. In bilirubinuria, the foam acquires a yellow color.
Transparency. Freshly voided urine is normally transparent. Urine clarity depends on the presence of salts, cellular elements, mucus, Bacteria, and fat droplets.
Upon standing, urine develops turbidity (nubecula). Mechanical and chemical methods are used to determine its cause. If the turbidity disappears after heating the urine to 60 °C, it is caused by urates and uric acid; if diluted Hydrochloric acid is added, by oxalates; if alcohol or ether is added, by fats; and if filtration or centrifugation clears it, by formed elements or mucus. Persistence of turbidity after all these measures indicates bacteriuria.
Urine reaction (pH). The urine of a healthy individual is normally slightly alkaline (pH 7.4), though urinary pH can vary across a wide range (from 4.5 to 8.5). Its acidity is closely linked to the renal function of maintaining acid-base balance through the reabsorption and excretion of bicarbonate ions and the active secretion of hydrogen ions. A diet rich in protein typically yields an acidic urine reaction, whereas a plant-based diet results in an alkaline reaction.
Urinary reaction can be roughly estimated within a pH range of 1.0 to 9.0 using litmus paper or test strips.
An alkaline urine reaction (pH > 8.0) is observed with the administration of alkalinizing solutions, acute respiratory alkalosis, loss of acids via gastric juice, hypokalemia, and Urinary Tract infections. A persistently alkaline urine reaction is seen in Renal Tubular Acidosis.
An acidic urine reaction (pH < 6.5) occurs with The Use of acidifying agents (ammonium chloride, calcium chloride, ascorbic acid), acidosis (other than renal), starvation, severe diarrhea, Gout, fever, and marked potassium deficiency. A sharply acidic reaction (pH < 5.5) promotes The formation of uric acid stones, whereas a sharply alkaline reaction (pH > 8.5) favors oxalate and phosphate stones.
Specific gravity. The specific gravity of urine depends on the concentration of osmotically active substances dissolved in it. Its value is also influenced by the size and Molecular Weight of these solutes. In a healthy person, urinary specific gravity varies over a wide range (from 1.002 to 1.030). Its maximum value provides insight into the renal concentrating ability. A direct relationship is observed between specific gravity and urine color, and an inverse relationship with urine volume. An exception is diabetes mellitus, which presents with the excretion of pale urine having a high specific gravity.
Urinary calculi. Urinary stones can be uniform or mixed in composition.
Oxalates are formed from calcium oxalate. Small oxalate stones feature a smooth surface and a light brown color, whereas large ones have an uneven surface, a dark brown color, and a hard consistency.
Urates consist of uric acid and ammonium urate. They have a smooth surface, a yellowish-brown color, and a hard consistency.
Phosphates are composed primarily of calcium phosphate; they are white, uneven-surfaced, brittle, and often eliminated as sand.
Carbonates are small, round, whitish stones with a smooth surface.
Cystine stones are characterized by a yellowish color and a soft consistency.
Cholesterol and xanthine calculi are relatively rare.
In mixed stones, the deposition of various salts typically occurs concentrically, with the core most frequently formed by oxalates or urates, and the outer shell by phosphates.
When assessing pathological changes in urine, proteinuria (PU) is of significant importance.
It is somewhat conventional to distinguish three variants of PU: prerenal, renal, and postrenal (K.T. Woo, 1997).
Prerenal PU is the excretion of pathological Proteins in the absence of primary renal damage, such as PU in multiple myeloma, myoglobinuria, or hemoglobin excretion during intravascular hemolysis. These are so-called overflow PUs, in which the Glomerular Filtration of protein exceeds the capacity of its tubular reabsorption.
Postrenal PU is the excretion of protein in the urine resulting from the secretion of the urinary tract and accessory glands.
Renal PU is the most consistent indicator of kidney disease, first established by R. Bright back in 1827. It is considered proven that in healthy individuals, only an insignificant fraction of Plasma Proteins is filtered through the glomerular filter, and the presence of a small amount of protein in the urine (30-50 mg/day) is not indicative of pathology. What is this protein? These are so-called mucoids—proteins formed As a result of tubular secretion, protein secretion by urinary tract Cells, proteins from degraded cells (blood and urinary tract epithelium), as well as certain plasma proteins (prealbumins, albumins, seromucoid, alpha-1-lipoprotein, haptoglobin, siderophilin, beta-globulin).
The barrier preventing protein penetration into the urine is the Capillary Wall—a specific glomerular filter, as mentioned above.
The most recent data regarding PU concern The Role of electrostatic forces, specifically the magnitude of the electrical charge of blood protein molecules and basement membrane (BM) proteins. Due to the presence of a negative charge in the intact BM, plasma protein molecules, which also carry a negative charge at physiological blood pH values, are repelled from the capillary wall. Naturally, any processes that disrupt the BM Structure or affect blood pH alter the magnitude of its electrostatic charge, which is accompanied by an increase in pore size. In addition, various deposits (circulating immune complexes, amyloid, hyaline) can accumulate in the BM, which also causes A change in the magnitude of the negative charge. Finally, congenital defects (reductions) in the magnitude of this charge exist.
The next barrier to protein is the renal tubular system. It has been proven that under normal conditions, practically all protein filtered through the glomerulus must be reabsorbed in the proximal tubule. This reabsorption pathway is enzymatic (vacuolar-lysosomal), as also mentioned above. This is important because various infections and intoxications can cause acute blockade of these enzyme systems—after all, the tubular epithelium is primarily subjected to the action of toxins during the elimination of the latter by the kidneys. In this aspect, the role of hereditary deficiency or reduced activity of these systems (hereditary tubular enzymopathies) or their damage by Antibodies reacting with the tubular BM antigen becomes understandable.
Another pathway for The Development of PU is The entry of protein into the tubular lumen from the peritubular space, although the most pronounced PU is still characteristic of glomerular damage.
A certain significance in kidney diseases is attributed to so-called selectivity, i.e., the ability of the glomerular filter to let through protein molecules of only a specific size.
Selective PU is defined as PU characterized by the excretion of low-molecular-weight proteins (up to 65,000 daltons—albumins, alpha2-globulins); non-selective PU is characterized by the clearance of medium- and high-molecular-weight proteins (alpha-2-macroglobulin, beta-Lipoproteins, gammaglobulins).
Therefore, nephrotic-type PU (clearance predominantly of albumins and alpha2-globulins), mixed-type PU (clearance of albumins and gammaglobulins), and serous-type PU (clearance of albumins and all globulin fractions) are distinguished.
PU can be recognized as a symptom of renal damage only after excluding so-called functional PUs, which include orthostatic PU, transient idiopathic PU, stress PU, and febrile PU.
Orthostatic PU is the detection of protein in the urine after prolonged standing or vigorous walking, followed by its rapid disappearance upon changing body position. The Mechanism of orthostatic PU is associated with slowed Blood Circulation in the glomeruli in the upright position, which leads to Changes in the rate of albumin excretion (in the upright position it is 12 mg/min, in the horizontal position—1.1 mg/min). The criteria for establishing the diagnosis of orthostatic PU are:
- patient age—13-20 years;
- isolated nature of PU;
- exclusively orthostatic nature of PU.
In recent years, the view on the physiological nature of orthostatic PU has been revised. Back in 1981, studies by R. Robinson (using renal puncture biopsy) in the examination of 250 patients with orthostatic PU and their follow-up for 6 years proved that in 53% of cases, orthostatic PU was caused by focal BM defects.
Transient idiopathic PU is detected in healthy individuals during medical examinations. It is likely that such PU can be termed "white-coat PU" by analogy with "white-coat Hypertension." It is associated with an increase in pressor amines during anxiety and their subsequent effect on intrarenal blood flow (redistribution favoring the glomeruli) and glomerular filtration (increase).
Stress PU is recorded in 20% of healthy individuals after intense physical exertion. Its characteristic feature is that protein is detected only in the first portion of urine. This is predominantly tubular-origin PU resulting from blood redistribution in the kidneys, again favoring the glomeruli, with the development of transient ischemia of the proximal tubules.
Febrile PU is observed in acute febrile states, especially in children and the elderly. Its potential mechanisms include increased glomerular filtration, transient alteration of the BM electrostatic charge, and damage to the latter by immune complexes or degradation products of protein molecules due to high Temperature.
On the border between physiology and pathology lies so-called congestive PU, which is based on The Effect of Hypoxia and hypoxemia on the permeability of glomerular capillary BMs and an increase in blood diffusion time in the capillaries. The PU itself is minor and lacks correlation with The Nature of Heart or lung damage.
Urinary sediment. The primary method for studying urinary sediment is the microscopic examination of native preparations with an assessment of its quantitative and qualitative composition.
To obtain urinary sediment, 10 ml of urine is centrifuged (for 5 minutes at 1500 rpm). The supernatant is removed, and the sediment is resuspended in a small amount (0.3–0.5 ml) of the remaining urine; a drop of the suspension is transferred to a Microscope slide and examined under a dark field.
Urinary sediment elements are divided into organic (cellular elements, casts, bacteria, Fungi, parasites) and inorganic (salts). Cellular elements include epithelial cells, erythrocytes, and leukocytes.
There are 3 types of epithelial cells found in urinary sediment.
Squamous epithelial cells are large, polygonal, with a small Nucleus, originating from the lower urinary tract. Normally, their number does not exceed 1–2 per high-power field. A significant number of these cells indicates accelerated desquamation of the urinary tract epithelial layer, for example, during inflammation, passage of a stone, or excretion of certain toxins or drugs.
Columnar (transitional) epithelial cells are smaller, oblong, tail-shaped, or pear-shaped, with a small nucleus displaced toward the base. These cells shed from the Stratified Epithelium of the lower urinary tract.
Renal tubular epithelial cells are characterized by a small size, round shape of both The Cell and The Nucleus, and cytoplasmic granularity. They are difficult to differentiate from lymphocytes, monocytes, and plasma cells. Round epithelial cells are classified as renal if they are part of epithelial casts or appear in clusters (casts/clumps) alongside granular casts. A significant number of renal epithelial cells (14–40% of all cellular elements) is detected in acute tubular necrosis, Renal Amyloidosis, TIN, lupus GN, particularly with NS, in the Cytology/cytology/16.html">Early stages of renal transplant rejection, and in cyclosporine overdose.
The Role and Clinical significance of erythrocyturia (Hematuria) in renal pathology were discussed above.
Leukocyturia. The normal leukocyte count in urine is 0–2 per field in men and 5–6 per field in women. The presence of 6 or more leukocytes per field is termed leukocyturia (LU). Mild leukocyturia (up to 50 leukocytes per field), moderate leukocyturia (100–150 leukocytes per field), and pyuria are distinguished. Pyuria generally refers to massive leukocyturia (leukocytes covering the entire field), which is accompanied by changes in urine color and transparency.
Provocative tests, most commonly the prednisolone test, are used to detect occult leukocyturia.
Procedure for the prednisolone test: 30 mg of prednisolone is administered intravenously, after which 4 urine portions are collected: three at hourly intervals, and the fourth after 24 hours. The test is considered positive if the leukocyte count per 1 ml doubles in at least one of the urine portions compared to baseline values.
It should be noted that interpreting any leukocyturia as infectious may lead to an inappropriate Treatment approach—leukocyturia within the range of 30–40 leukocytes per field can also be aseptic. In this case, it is advisable to determine the source of leukocyturia (renal vs. urinary tract) and its genesis (infectious vs. aseptic) using a three-Glass test, excretory urography, radioisotope renography, renal ultrasound, urine culture, and qualitative leukocyte analysis (eosinophils, neutrophils, lymphocytes). For example, if urinary leukocytes are predominantly neutrophils (90–100% of all urinary leukocytes), this indicates an infectious and inflammatory process in the urinary tract. Lymphocyturia (exceeding 20% of all leukocytes) is observed in patients with a transplanted kidney as an early sign of rejection crisis and is also characteristic of aseptic leukocyturia in GN. High lymphocyte counts (37–80%) are detected in lupus GN and renal amyloidosis; both lymphocyturia and eosinophiluria are characteristic of acute interstitial nephritis.
The Diagnostic significance of so-called active leukocytes should be noted. They form under conditions of induced hyposmolarity (in vitro) as large, pale-stained leukocytes displaying Brownian motion of cytoplasmic granules. Inactive leukocytes include well-stained granulocytes without granule motility.
In healthy individuals, active leukocytes are either absent or present in small numbers (up to 200 cells per 1 ml of urine). Their count increases in inflammatory processes throughout the urinary tract and correlates directly with The activity of the process.
Unlike active leukocytes, Sternheimer-Malbin cells look different—they are pale, large leukocytes with a water vacuole in the Cytoplasm and motile granules surrounding the nucleus displaced to the periphery. They form exclusively within the urinary tract and are typically characteristic of Pyelonephritis (PN).
Cylindruria. Among all components of urinary sediment, only casts are exclusively of renal origin and represent a cast (mold) that structurally resembles a tubule.
The matrix of casts is composed of uromucoid—Tamm-Horsfall protein. This is a specific protein secreted by the epithelium of the ascending limb of the Loop of Henle, to which aggregated plasma proteins subsequently attach. Precipitation of Tamm-Horsfall protein, as well as other plasma proteins leading to cast formation, is promoted by changes in electrolyte concentration, osmolality, and acid-base balance (ABB) of the blood.
There are 8 types of casts: hyaline, waxy, granular, erythrocyte, leukocyte, eosinophilic, epithelial, and fatty.
Hyaline casts consist entirely of Tamm-Horsfall protein. They feature a homogeneous, transparent structure. These are the most common types of casts in renal pathology, although they can also occur normally (up to 100 per 1 ml of urine), especially in morning urine samples, following physical exertion, or during dehydration.
Waxy casts do not occur normally. They resemble casts of pathologically altered tubules—broad and short, yellow in color, composed of a homogeneous, structureless, wax-like material. Conditions for their formation include urinary stasis in the tubules. Waxy casts are most frequently a sign of chronic kidney disease.
Granular casts are opaque, coarse, and contain A large number of granular inclusions—aggregated plasma proteins. This is always a sign of pathology, particularly PN, GN, and Nephrotic Syndrome (NS).
Erythrocyte casts are pink in color and contain intact red Blood Cells. Such casts are frequently found in hematuria associated with primary glomerular damage.
Leukocyte casts typically contain granulocytes (neutrophils). Leukocyte casts are a hallmark of PN.
Eosinophilic casts are identified in acute drug-induced interstitial nephritis.
Epithelial casts are indicative of renal and tubular epithelial desquamation. They occur in acute tubular necrosis and acute inflammation of the renal parenchyma.
Fatty casts contain Tamm-Horsfall protein, which is either associated with individual fat globules or entirely impregnated with fat. Such casts are a hallmark of nephrotic syndrome (NS).
Inorganic constituents of urinary sediment include crystals of various salts (Fig. 19, 20).
Class="center">
Fig. 19. Crystals in normal urine.

Fig. 20. Pathological crystals in urine.
Uric acid crystals vary in shape, are yellow, occasionally colorless, and appear as blocks, spindles, rosettes, needles, or rectangular or hexagonal prisms.
Urates (calcium, potassium, magnesium) appear as amorphous yellowish-brown granules.
Calcium phosphates are needle-like crystals, either single or in bundles (stellate clusters).
Magnesium phosphates are rhombus-shaped crystals.
Calcium oxalates appear as octahedra, envelopes, or hourglass-shaped crystals.
Cystine crystals are colorless, overlapping hexagonal crystals.
Tyrosine crystals are delicate, yellow, needle-like crystals, often arranged in bundles.
Leucine crystals are round with radial concentric striations.
Bilirubin crystals are amorphous or needle-like, often arranged in bundles, rhomboids, or cubes.
Sulfonamides appear as shapeless crystals.
The mechanisms underlying crystalluria are discussed below.
At the end of this section, Table 3 presents the most typical urinary changes in common forms of renal pathology prior to the development of chronic kidney disease (CKD) (A.P. Karapat et al., 1984).
|
1 |
2 |
3 |
4 |
5 |
6 |
7 |
8 |
|
Diabetic nephropathy |
Straw-yellow |
Normal |
Acidic, alkaline |
1.0-3.5 |
Absent |
Occasionally |
Hyaline, granular |
|
Nephropathy of pregnant women |
Straw-yellow |
Normal |
Acidic, alkaline |
1.0-3.5 |
Absent |
Absent |
Hyaline, granular |
|
Urolithiasis |
Straw-yellow, |
Normal |
Acidic, alkaline, |
Trace |
Usually |
Occasionally |
Not characteristic |
|
Renal vascular thrombosis |
Red |
Normal |
Acidic |
> 3.5 |
Constantly |
Absent |
Hyaline, erythrocyte |
|
Straw-yellow |
Decreased |
Alkaline, acidic |
0.5-1.0 |
Rarely |
Usually |
Occasionally hyaline |
|
|
Gouty nephropathy |
Straw-yellow |
Decreased |
Alkaline, acidic |
0.1-1.0 |
Absent |
Usually |
Occasionally hyaline |
|
Myeloma kidney |
Straw-yellow |
Normal |
Acidic |
0.5-3.5 |
Absent |
Occasionally |
All types of casts |
Performance and evaluation of the Zimnitsky test. A critically important test for assessing the osmoregulatory function of the kidneys is the determination of changes in urine specific gravity over a specified observation period (most commonly 24 hours).
Urine specific gravity is measured using a urinometer immersed in a vessel with urine. The urinometer must float freely without touching the walls of the vessel (it is calibrated to measure density within the range of 1.000-1.050). To perform the Zimnitsky test, 8 urine portions are collected at 3-hour intervals.
Testing procedure. At 6:00 a.m., the patient empties the bladder. No water or food restrictions are required. The first urine portion is collected from 6:00 to 9:00, the second from 9:00 to 12:00, the third from 12:00 to 15:00, and so on, up to eight portions. The volume and specific gravity of each portion are measured.
When analyzing the results of the Zimnitsky test, total diuresis, daytime and nighttime diuresis, and the fluctuations in specific gravity across all portions are evaluated. In healthy individuals, daytime diuresis always exceeds nighttime diuresis (2-2.5:1). The maximum urine specific gravity provides insight into the renal concentrating capacity. Practically, this function is considered normal if this indicator in the morning, most concentrated urine portion exceeds 1.018-1.019.
A decrease in urine specific gravity is observed in Aging, excessive fluid intake, hyponatremic and low-protein diets, diuretic use, diabetes insipidus, pituitary insufficiency with antidiuretic hormone deficiency in the blood, renal tubular dysfunctions (potassium-losing kidney, Fanconi Syndrome, nephrogenic diabetes insipidus), Tubulointerstitial Nephropathies, polycystic kidney disease, Hydronephrosis, and chronic kidney disease.
An increase in urine specific gravity is characteristic of diabetes mellitus, febrile states, and diarrhea.
Hyposthenuria is a condition in which the specific gravity of urine in any portion does not exceed 1.010; isosthenuria occurs when the variation range across all portions does not exceed 2; and nocturia refers to the predominance of nighttime diuresis over daytime diuresis.
Here, we should point out once again that the specific gravity of urine depends not only on the number of molecules dissolved in it, but also on their size. If, for instance, urine contains a high amount of protein, its specific gravity will be higher and will no longer reflect the true concentrating capacity of the kidneys. Therefore, in the presence of pathological impurities such as protein and glucose, certain adjustments are made to the evaluation of specific gravity. Specifically, each permille (i.e., 1 g/L) of protein increases the specific gravity of urine by 0.003, and each percentage of glucose by 0.004 urometer divisions. For example, if glycosuria is 2% and the urine specific gravity is 1.020, the correction factor of 0.008 (2 ∙ 0.004) should be subtracted from the urometer reading. In our example: 1.020 - 0.008 = 1.012.
In renal pathology associated with predominant involvement of the tubules and interstitium (such as pyelonephritis, polycystic kidney disease, or hydronephrosis), Impairment of the renal concentrating function occurs earlier than changes in the GFR, and vice versa in cases of predominant glomerular damage.
In the Reiselman test (1952), which is a Modification of the Zimnitsky test, urine is also collected over 24 hours in separate portions and containers, but not at uniform time intervals; instead, it is collected as the patient needs to urinate. Therefore, the number of urine portions may be greater or lesser than eight. All subsequent Procedures are identical to those of the Zimnitsky test.
The osmoregulatory function of the kidneys is assessed more precisely by measuring the osmolality of blood serum and urine. These parameters are determined by the cryoscopic method—that is, by measuring the freezing point of the test fluids, since it has been proven that the depression of the solution's freezing point is proportional to the concentration of osmotically active substances within it. For this purpose, osmometers are used to calculate the concentration of osmotically active substances in the test solution by comparing the freezing point of a solution with a known osmotic concentration to the freezing point of the sample. There are also calculation Methods for determining blood and urine osmolality, which can be found in specialized manuals. Normal blood serum osmolality values range from 275-301 mOsm/kg, and urine osmolality (at a diuresis of about 1.5 L) ranges from 600-800 mOsm/kg, with fluctuations between 40 and 1200 mOsm/kg.
In some cases, the Zimnitsky test yields inconclusive results regarding the state of the renal concentrating function. Earlier impairments of this function can be detected by using loading tests, the most widely used of which is the Volhard test.
Performance and evaluation of the Volhard test. The Volhard test determines the ability of the kidneys to concentrate urine under conditions of 36- or 18-hour (which is more physiological) water deprivation.
In healthy individuals, the specific gravity of urine in individual portions collected every 4 hours rises to 1.030-1.032 or even 1.040; the volume of urine in each portion decreases to 50-60 mL, and daily diuresis does not exceed 500-600 mL.
When evaluating the results of this test, it should be kept in mind that the concentrating function, much like the GFR, depends on the person's age. The normal values of maximum specific gravity during the Volhard test are considered to be as follows:
|
Patient age (years) |
Maximum specific gravity |
|
15-19 |
1.032 |
|
20-29 |
1.030 |
|
30-39 |
1.029 |
|
40-49 |
1.028 |
|
50-59 |
1.027 |
|
60-69 |
1.026 |
A decrease in the renal concentrating function should be suspected when the specific gravity of urine is lower than the maximum "normal" value for the given age group, and the volume of individual urine portions increases to 70-100 mL/4 hours.
For the same purpose, the pitressin test is used, which is subjectively tolerated by patients more easily than the Volhard test: 5 units of pitressin are administered subcutaneously or intramuscularly in the evening on the eve of the test. Then, the specific gravity of urine is determined throughout the day. An increase in the urine specific gravity to 1.025 or higher indicates that the concentrating function of the kidneys is preserved.
The urine dilution test characterizes the ability of the kidneys to dilute urine to the maximum extent under conditions of artificially induced body hyperhydration. A state of hyperhydration is achieved through a water load, which can be single or prolonged.
A single water load in a volume of 20-22 mL/kg of body weight (water, weak tea) is given to the patient on an empty Stomach over 30-45 minutes. Subsequently, urine portions are collected at 1-hour intervals to determine their volume and specific gravity.
During a prolonged water load, the patient ingests an amount of fluid equal to 2% of their body weight over 30-40 minutes. Over the next 3 hours, urine portions are collected every 30 minutes for analysis. Thereafter, the water load is maintained by ingesting fluid every 30 minutes in a volume exceeding The amount of excreted urine by 50 mL.
In healthy individuals undergoing the maximum dilution test, the specific gravity of urine drops to 1.003. During the first two hours after the test begins, more than 50% of the total ingested fluid volume is excreted, and over the subsequent four hours, more than 80% is excreted.
An inability of the kidneys to lower the specific gravity of urine below 1.004 is considered an impairment of the urine dilution function. The complete loss of this function characterizes a state of isosthenuria (equalization of the osmotic concentrations of urine and plasma).
It should be noted that impaired ability of the kidneys to maximally dilute urine is sometimes observed even without renal damage—in syndromes associated with excessive secretion of antidiuretic hormone, hypocortisolemia, hypothyroidism, heart failure, Liver cirrhosis, obesity, and malabsorption syndrome. Osmotic dilution function can also be impaired by medications, including tranquilizers (amitriptyline), vincristine, sulfonylurea derivatives (butamide), barbiturates, nicotinamide, cyclophosphamide, miscleron, paracetamol, aspirin, indomethacin, and ibuprofen.
The hyperhydration test is contraindicated in heart failure, oliguria, anuria, acute Glomerulonephritis, nephrotic syndrome, and renal failure.
Performance and evaluation of the Nechyporenko test. The Nechyporenko test is prescribed when blood formed elements are present in the urinary sediment (erythrocytes: 3-5 per high-power field, leukocytes: 5-6 per high-power field), as well as casts. This test determines the content of erythrocytes, leukocytes, and casts in 1 mL (or 1 L) of urine.
Urine for analysis is sampled from the midstream portion obtained over any time interval at any time of day.
The normative values for the content of formed elements in 1 L of urine according to the Nechyporenko test are: leukocytes up to 2.0 ∙ 106, erythrocytes up to 1.0 ∙ 106, and casts (hyaline) up to 1.0 ∙ 105.
An elevated leukocyte count in 1 L of urine requires a qualitative analysis of their composition to differentiate between septic leukocyturia and aseptic leukocyturia (e.g., in lupus nephritis, tubulointerstitial nephropathies, or renal transplant rejection crisis). The predominance of erythrocytes in the urinary sediment during the Nechyporenko test requires clarification of the source of hematuria using other methods.
Evaluation of 24-hour proteinuria. The evaluation of 24-hour proteinuria is an important test for determining the severity of damage to renal structures, particularly the glomeruli. A direct correlation is observed between the magnitude of 24-hour proteinuria and the depth of damage to nephron structures. Daily proteinuria reaches its maximum degree in glomerular damage of infectious-allergic (glomerulonephritis) or metabolic (diabetes mellitus, renal amyloidosis) origin.
Daily proteinuria is considered mild if it does not exceed 1.0 g/day, moderate at 1.0-3.0 g/day, and high if it exceeds 3 g/day; sometimes daily proteinuria can reach 20-30 g.
Daily proteinuria is determined by measuring the amount of protein in 1 L of urine and then scaling this value to the total 24-hour urine volume.
Assessment of renal excretory function. The kidney's ability to maintain body Homeostasis is achieved through fluid ultrafiltration in the renal glomeruli, tubular transport processes, and the synthesis of BIOLOGICALLY ACTIVE SUBSTANCES.
In clinical practice, the leading methods for assessing renal excretory function are based on clearance techniques. These tests utilize substances whose blood levels remain nearly constant (such as creatinine) or whose constant blood concentration is maintained through continuous intravenous infusion. It should be emphasized that the reliability of these methods is ensured only when the following conditions are met:
a) the diuresis rate must be at least 1 ml/min;
b) high precision is required when measuring diuresis and test duration;
c) the concentration of the test substance must be determined in a urine sample exceeding 100 ml in volume.
The results of clearance methods are normalized to a standard body surface area of 1.73 m2 (body surface area is calculated using nomograms).
It should also be noted that clearance can occur via glomerular filtration, tubular secretion, or a combination of both. Various endogenous and exogenous substances are known to have distinct clearance mechanisms. For instance, endogenous creatinine, electrolytes, Amino Acids, and inulin are cleared via glomerular filtration. Tubular secretion ensures the elimination of penicillin, guanidine, p-aminohippuric acid, and iodine-containing drugs. Knowing the specific pathway of renal excretion for a given substance allows for the calculation of partial renal function parameters using appropriate formulas.
The substance whose clearance is chosen for study is referred to as the test substance.
Having determined the concentration of this substance in Blood Plasma and urine, we formulate the equation:
С ∙ Р = U ∙ V,
where: С is the substance clearance in ml/min,
Р is the plasma concentration of the substance in mmol/l,
U is the urine concentration of the substance in mmol/l,
V is the minute urine volume in ml.
Hence, the clearance is equal to:

where: К is the correction factor for standardizing value С to the standard body surface area (A.P. Peleshchuk, 1983).
Performance and evaluation of the Rehberg-Tareev test. The Rehberg-Tareev test is used to evaluate renal excretory function using creatinine clearance.
Creatinine is the end product of creatine METABOLISM, produced by Muscle cells at a relatively constant rate. It is excreted by the kidneys primarily via GF (99.5–100%) and only to a minor extent through proximal tubular secretion. This circumstance highlights the clinical importance of measuring blood creatinine levels specifically, rather than other Nitrogen metabolism parameters such as residual nitrogen or urea. The values of the latter parameters depend heavily on the overall body protein balance, making them less accurate indicators of renal excretory function. For instance, urea and residual nitrogen levels can rise despite preserved renal function due to enhanced Protein Catabolism or a high-protein diet; conversely, they may remain stable for a long time on a low-protein diet despite a progressive decline in renal excretory function.
This technique gained widespread use due to its simplicity and high information content, and was introduced into clinical practice as early as 1936 by E.M. Tareev and N.A. Ratner. According to this test, the GF is determined under physiological conditions with a single blood draw.
Test procedure. At 7:00 a.m., the patient voids their bladder, then drinks 500–600 ml of room-temperature water and lies down in bed. At 8:00 and 9:00 a.m., hourly urine samples are collected via spontaneous urination (preferably in an upright position). Blood for creatinine determination is drawn from a vein after obtaining the first urine sample. The volume of each urine sample is measured; then, the minute diuresis and its average values are calculated. Subsequently, creatinine concentrations in blood and urine are determined, and the GF (С) is calculated using the formula below.
The endogenous creatinine clearance method can also be performed: a) using a 24-hour urine collection; b) by collecting urine sequentially over several separate periods during the day; c) over a short time interval (10–20 min)—in this case, the test is also conducted under conditions of a water load. However, the method described above, according to N.A. Ratner, most reliably characterizes the true value of GF.
The GF value is determined by the formula:
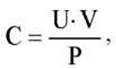
where: С is the GF in ml/min;
U - urine creatinine concentration in mmol/L;
P - plasma creatinine concentration in mmol/L;
V - minute diuresis in mL/min.
Using the values of minute diuresis and GFR, the tubular reabsorption rate is determined:

where: R - tubular reabsorption rate;
C - glomerular filtration rate in mL/min;
V - minute diuresis in mL.
The evaluation of the Reberg-Tareyev test parameters, particularly the GFR value, requires its mandatory correlation with the patient's Clinical presentation or overall condition. Although GFR varies within a fairly wide range, its reduction is a hallmark of renal pathology (with the exception of early-stage diabetic nephropathy). Tubular reabsorption is a more stable parameter, although it also tends to decrease with the development of chronic kidney disease (CKD).
The normal reference ranges for endogenous creatinine clearance test parameters are:
- for minute diuresis - 1-2 mL/min;
- for glomerular filtration rate - 80-130 mL/min;
- for tubular reabsorption - 98-99 %.
To assess renal excretory function, alongside endogenous creatinine clearance, clinicians also use the clearance rates of urea, inulin, ethylenediaminetetraacetic acid, as well as glomerulotropic radiopharmaceuticals (sodium iothalamate labeled with I125 or I131). All the validity conditions specified above remain applicable in these cases.
Evaluating glomerular function based on urea clearance is used less frequently than endogenous creatinine clearance. This is due to several factors, primarily the fact that urea, as the end product of Protein metabolism, is freely filtered in the glomeruli but subsequently undergoes tubular reabsorption. Furthermore, The rate of its tubular reabsorption is directly dependent on the urine flow rate (in a healthy individual with a diuresis of at least 1.5 mL/min, urea clearance is about 75 mL/min). Additionally, unlike creatinine, blood urea levels fluctuate throughout the day (due to physical exertion or protein intake); therefore, urea clearance is measured only over a limited time interval.
The most accurate determination of GFR is achieved using inulin clearance.
Inulin (a mixture of fructose polymers with a molecular weight of 5,200 daltons) is the ideal substance for determining GFR. Based on its clearance, GFR is approximately 125 mL/min. However, measuring GFR via inulin clearance involves significant technical difficulties (the need to maintain a constant blood concentration, repeated venipuncture, and bladder catheterization, which carries a risk of pyrogenic reactions). Consequently, this method is primarily used in scientific research or as a reference standard against which the clearance of other substances is evaluated.
Renal excretory function is also assessed by examining the urinary excretion of specific solutes (acids, bicarbonates, ammonia).
Excretion of weak acids reflects the amount of secreted hydrogen ions bound to phosphate anions and weak organic acids. It is determined by titrating urine with an alkaline solution to match blood pH. Normally, titratable acid excretion ranges from 10-30 mmol/day, or 7-21 µmol/min.
Bicarbonate excretion under normal conditions is low, amounting to 12 mmol/day. Virtually all (99.9 %) of the filtered bicarbonate is reabsorbed in the renal tubules.
Total acid excretion (total hydrogen ion excretion) ranges from 40-90 mmol/day or 23-52 µmol/min, meaning the kidneys completely eliminate the excess acid load from a standard diet. The limit of acid excretion is the level of titratable acidity and ammonia excretion at which urinary pH reaches 4.5 (in a healthy individual under normal conditions, pH can range from 4.5 to 7.5, most commonly shifting toward the acidic side).
Ammonia excretion in a healthy individual is 30-60 mmol/day or 21-35 µmol/min. By binding with hydrogen ions, ammonia facilitates the excretion of strong acid anions (in the form of ammonium salts).
Ammoniagenesis function is evaluated based on ammonium excretion and the so-called ammonium coefficient. The latter characterizes The ratio of secreted hydrogen ions eliminated as ammonium to the total amount of excreted ammonium, with a normal value of 0.645. Similar diagnostic value is provided by the ratio of daily ammonium ion excretion to urinary titratable acidity (normal range: 1-2.5).
To assess the state of renal excretory function, the ammonium chloride loading test is also employed. Most commonly, a single-dose ammonium chloride loading test (the Wrong-Davies test) is performed.
Testing procedure. After baseline urine samples are collected twice over the course of an hour, the patient ingests ammonium chloride orally in the morning on an empty stomach at a dose of 0.1 g/kg of body weight, followed by 800-1000 mL of fluid. To prevent gastrointestinal irritation, ammonium chloride is administered in gelatin capsules. Urine is collected hourly for 8 hours. Since the peak changes in urine are observed after 5 hours, collection can be limited to the urine samples obtained within 5-6 hours from THE START OF the test.
Preserved renal acid-excreting function is indicated by a urine pH below 5.3, titratable acid excretion rates exceeding 25 µmol/min, ammonium excretion above 35 µmol/min, and total hydrogen ion excretion over 60 µmol/min.
The prolonged ammonium chloride loading test involves daily oral intake of ammonium chloride at a dose of 0.1 g/kg of body weight for 4–5 days. The drug is administered in divided doses every 2–3 hours. The onset of acidosis is indicated by a decrease in serum standard bicarbonate to 16–18 mmol/L. Normally, maximum titratable acid excretion is observed on days 3–4, while the peak of ammonium excretion and a drop in urine pH below 5.0 occur on days 4–5; ammonium excretion exceeds 60 mmol/day, and hydrogen ion excretion exceeds 96 mmol/day.
Contraindications for such loading tests include conditions complicated by systemic acidosis (diabetes mellitus, adrenocortical insufficiency), as well as nephropathies with pre-existing impairment of renal excretory Functions.
Thus, impaired renal nitrogen-excreting function is primarily diagnosed when blood creatinine levels are elevated, whereas impaired acid-excreting function is indicated by decreased excretion of titratable acids and ammonium ions, alongside a high urine pH that is inconsistent with the degree of systemic acidosis.
The ability of the nephron to adequately lower urine pH is impaired in renal tubular acidosis, hypokalemia, and hypercalciuria; at the same time, this function may remain intact in chronic kidney disease (CKD) even with a significant reduction in the number of functioning nephrons. The excretion of titratable acids may decrease in the aforementioned pathological conditions and CKD, while ammonium excretion decreases in hypercalciuria and CKD. In renal tubular acidosis and hypokalemia, these values may be normal or even elevated.
Functional loading tests also include protein-loading and dopamine-infusion tests.
The protein-loading test is used to assess glomerular filtration rate (GFR) reserve. This test can be acute (single-dose) or prolonged (protein loading conducted over 3–5 days).
The acute protein-loading test involves the consumption of 70–90 g of animal protein and 100 g of plant protein or the intravenous infusion of an amino acid mixture; the prolonged test involves a high-protein diet (1.5–1.8 g of protein/kg of body weight/day) for 3–5 days (I. E. Tareieva et al., 1995). In response to an acute protein load or amino acid infusion, the GFR increases by 20–65% within the first 12.5 hours, whereas during prolonged protein loading, this parameter increases by 10–30% by days 3–4. In renal diseases, the GFR reserve is sharply reduced or undetectable.
To evaluate the GFR reserve using the dopamine test, dopamine is administered intravenously at a rate of 1.5–2 µg/kg of body weight/min for 2 hours. In healthy individuals, the GFR increases by 10–15% in response to dopamine administration. The dopamine test can also be used to assess renal blood flow reserve, as the aforementioned doses of dopamine have virtually no effect on systemic hemodynamics.
Determination of the degree of enzymuria. The use of Enzymes for the diagnosis of various diseases is associated with the name of J. Wohlgemuth, who in 1908 proposed a method for measuring alpha-amylase activity in urine to diagnose acute pancreatitis.
The sources of enzymuria include:
- increased glomerular filtration of enzymes from blood plasma coupled with impaired tubular reabsorption;
- renal tubular epithelial cells, predominantly from the proximal segments, which contain the highest concentration of enzymes;
- epithelial Cells of the urinary tract;
- urinary sediment components (leukocytes, erythrocytes, bacteria);
- secretions of the sex glands;
- enzymes from tumor cells.
Interest in studying enzymuria is understandable given the fact that enzymes, having varying molecular weights, are distributed differently along the nephron segments and are reabsorbed in the tubules. Under physiological conditions, only those enzymes with a molecular weight not exceeding 70,000 Daltons (Lysozyme, urokinase, amylase, lipase) are excreted from plasma into urine through the glomerular filter, whereas enzymes with higher molecular weights (e.g., Alanine aminopeptidase [AAP], Lactate dehydrogenase [LDH]) appear in urine only when the permeability of the glomerular capillary basement membrane is increased.
With normal tubular reabsorption, low-molecular-weight enzymes such as lysozyme and urokinase are completely reabsorbed; therefore, their urinary excretion serves as one of the criteria for tubular damage.
Identifying a specific type of enzymuria is a critically important diagnostic test to clarify The Nature and topography of renal lesions, as well as to determine the prognosis of the disease. Depending on the depth of damage, enzymes with different intracellular localizations are released into the urine: mild cell damage increases the activity of brush-border-associated enzymes; pronounced damage elevates cytoplasmic and lysosomal enzyme activities; and cell necrosis results in the release of mitochondrial enzymes.
Let us characterize the most important enzymes associated with these localizations.
Brush border enzymes. Neutral alpha-glucosidase is of paramount importance in the development of tests for detecting renal pathology. Its blood level is extremely low, and it was later established that it exhibits maximum activity predominantly in the renal cortex. In the kidneys, alpha-glucosidase is strictly localized within the epithelial cells of the proximal tubules and the loop of Henle. Studies of this enzyme's activity in urine have established a direct correlation with the severity of nephron damage (glomerulonephritis, pyelonephritis, amyloidosis). During treatment, alpha-glucosidase activity gradually decreased, reaching normal values only upon achieving complete clinical and laboratory remission (T. P. Lavrenova, 1990).
Gamma-glutamyl transferase. Its highest activity is also detected in renal tissue, where the enzyme is located in the cells of the proximal convoluted tubules and the descending limb of the loop of Henle. Despite the high renal activity of the enzyme, measuring blood gamma-glutamyl transferase levels is currently also used to diagnose liver and Gallbladder diseases. In nephrology, determining the urinary activity of this enzyme is most frequently performed when a renal graft rejection crisis is suspected, as it appears in 95% of patients significantly earlier than the clinical signs of the crisis (A. V. Moshkin, 1983).
Alkaline phosphatase is an enzyme found in all human Tissues. It is localized on The cell membrane, where it participates in phosphate transport into the cell.
There are 5 tissue-specific Isoenzymes of alkaline phosphatase: placental, bone, liver, intestinal, and renal. In the kidneys, alkaline phosphatase is located in the cortex and is firmly anchored to the matrix of the brush border membranes of the nephroepithelium. Measuring urinary alkaline phosphatase activity has been proposed as a test for cytomembrane injury, primarily affecting the renal cortex (P. Wolfgang, 1982).
Cytoplasmic enzymes. Lactate dehydrogenase (LDH) is represented by 5 isoenzymes that are distributed differently between the renal cortex and medulla. Specifically, the LDH-1 isoenzyme is predominantly located in the cortex, whereas LDH-5 is found in the medulla. Normally, blood LDH activity in acute and chronic kidney diseases remains within the reference range; however, elevated levels of these LDH isoenzymes in the urine are detected in practically all renal disorders, ranging from glomerulonephritis, pyelonephritis, and rejection crises to ACUTE RENAL FAILURE and kidney tumors (L.N. Delektorskaya et al., 1990).
Malate dehydrogenase is another widely distributed enzyme across various tissues. Its particularly high activity is detected in the myocardium, skeletal Muscles, liver, and kidneys (both cortex and medulla). Of the total enzyme activity, 23% is represented by the cytoplasmic isoenzyme and 77% by the mitochondrial isoenzyme. An increase in mitochondrial isoenzyme activity in renal pathology indicates irreversible damage to nephron structures (L.P. Pashintseva et al., 1992).
Lysosomal enzymes. N-acetyl-beta-D-glucosaminidase (NAG) is an enzyme found in significant amounts in the proximal convoluted tubules, although its molecular weight (130,000 daltons) substantially exceeds the threshold normally permitted for glomerular filtration (T.P. Lavrenova, 1990). Increased NAG excretion is characteristic of Chronic Glomerulonephritis (including its latent form) and renovascular hypertension (A.V. Tarasov, 1990). It is also proposed to measure urinary NAG activity for the early detection of diabetic nephropathy, transplant rejection crisis, and drug-induced kidney injury.
Arylsulfatase belongs to lysosomal Hydrolases. The highest activity of arylsulfatase is detected in the kidneys, and lower activity in The Liver and Pancreas. Determining the activity of this enzyme is particularly valuable for diagnosing malignant neoplasms of the urinary tract (98–100% positive results), although such hyperenzymuria is also observed following gentamicin administration, in thyrotoxicosis, Viral Hepatitis, and liver cirrhosis. This serves as indirect evidence of Renal Involvement in an extrarenal pathological process or the kidneys' reaction to xenobiotic administration (A.V. Moshkin, 1993).
Beta-glucuronidase is an enzyme also found in virtually all body tissues. In renal tissue, it is evenly distributed between the cortical and medullary layers. Determining the activity of this enzyme, alongside alpha-glucosidase and beta-2-microglobulin, is recognized as one of the most promising approaches for the early diagnosis of kidney diseases. Its significant elevation has been demonstrated in transplant rejection crises, acute tubular necrosis, glomerulonephritis, and pyelonephritis.
Cholinesterase is an enzyme whose activity in urine directly reflects the degree of glomerular filtration barrier impairment (V.V. Dlin, 1995), whereas an increase in the urinary activity of another cholinesterase type—acetylcholinesterase—indicates interstitial involvement in tubulointerstitial nephropathies.
Elevated urinary amylase activity serves as an early biochemical marker of tubular injury in patients with chronic glomerular diseases (T. Niva et al., 1993).
Among enzymurias, considerable importance is also attributed to the increased urinary excretion of beta-2-microglobulin, an endogenous protein with a molecular weight of 11,800 daltons.
It is well established that all circulating blood beta-2-microglobulin is freely filtered through the intact glomerular capillary basement membrane and subsequently almost completely (99.5%) reabsorbed by the proximal tubular epithelium.
A decrease in its glomerular filtration rate leads to elevated blood levels, whereas impaired reabsorptive capacity of the tubular epithelium resulting from tubular dysfunction leads to increased urinary excretion. Thus, in patients with tubulointerstitial pathology, diffuse deposits of beta-2-microglobulin are found in the cytoplasm of the tubular epithelium and along the tubular basement membrane, while in patients with Chronic Pyelonephritis, its pathological excretion exceeds normal levels threefold (O.E. Golovanova et al., 1995).
Measuring urinary beta-2-microglobulin excretion is also an important test for differentiating dehydration from acute tubular injury as causes of oliguria: in dehydration, the urinary beta-2-microglobulin level does not exceed 1 mg/day, whereas in acute tubular injury, this value exceeds 50 mg/day.
Thus, determining serum beta-2-microglobulin levels and its urinary excretion rate is an early and highly informative test for assessing the functional state of both glomeruli and tubules (U.Ravnskov et al., 1997).
Overall, approximately 70 enzymes and isoenzymes are currently measured in urine.
Ultrasound examination of the kidneys. Renal ultrasound involves registering signals reflected at the boundaries of various Organs and tissues due to their distinct acoustic characteristics (ultrasound propagation speed, absorption, and reflection coefficients) using electronic equipment. The advantages of this technique include high diagnostic value, non-invasiveness for the patient, rapid acquisition of results, safety of repeated use, and relative affordability.
Methodology of renal ultrasound. The examination is typically performed on an empty stomach (with a light dinner on the eve). The patient lies in a supine position. A series of transverse sonograms is obtained first by moving the transducer every 1–1.5 cm. Longitudinal scanning is performed at the same intervals from the lateral to the medial surfaces of the kidneys (Fig. 21).
The length of a normal kidney is 7.5–12 cm, width is 4.5–6.5 cm, and thickness is 3.5–5 cm. On longitudinal scanograms, the kidney has an elongated-oval shape, while on transverse ones, it appears ovoid. A thin (1–1.5 mm) Connective Tissue capsule can be visualized on its surface as an echogenic structure. Peripheral to it, a zone of decreased echogenicity—the adipose tissue—is identified. The renal parenchyma itself is characterized by a delicate internal structure. On transverse scans, the calyces appear oval or round, and on longitudinal scans, they are elongated with increased echogenicity at the center of the kidney. The renal pelvis is better delineated on transverse scans, with a normal anteroposterior dimension of 1–1.5 cm. Dense formations within the kidney appear as echogenic structures, whereas fluid-filled structures appear hypoechoic with a homogeneous internal medium.

Fig. 21. Transverse and longitudinal sonograms of a normal right kidney (ultrasound).
Ultrasound Diagnostics of renal diseases is based on assessing both kidney dimensions and the condition of the cortical and medullary layers. Thus, with normal kidney dimensions, the corticomedullary boundary is not visualized in Fanconi nephronophthisis; with enlarged kidneys, it is seen in infiltrative processes, polycystic kidney disease, and renal artery thrombosis complicated by renal infarction; with small kidneys, it occurs in nephroangiosclerosis. This same boundary is identified in normally sized kidneys in the case of tubulointerstitial nephritis, in enlarged kidneys during acute glomerulonephritis or renal vein thrombosis, and in small kidneys associated with hypoplasia (D. Smith et al., 1985).
Ultrasound imaging allows for the detection of tumors, renal cysts, calculi (including radiolucent stones), polycystic kidney disease, hydronephrosis, tuberculous cavities, as well as deformation and thickening of the pelvicalyceal system.
In polycystic kidney disease, sonography reveals enlarged kidneys with poorly defined borders, particularly at the upper and lower poles; renal cysts appear as multiple hypoechoic areas of varying SHAPES AND SIZES (Fig. 22).
Simple renal cysts appear as round or oval structures with a hypoechoic capsule (Fig. 23).
On ultrasound, a renal tumor presents as a round or oval formation, frequently with irregular margins, exhibiting an echogenicity distinct from normal renal structures (Fig. 24).

Fig. 22. Polycystic kidney disease (ultrasound).

Fig. 23. Simple renal cyst (ultrasound).
This reveals renal deformation, organ enlargement, and distortion of the pelvicalyceal system. Occasionally, the tumor exhibits a rather complex echogenic structure (dense hyperechoic tissues alongside echo-negative areas). The minimum tumor size detectable by ultrasound is 1-2 cm.
Renal metastases typically appear as masses whose echogenic structure differs from the surrounding renal parenchyma (Fig. 25).
Hydronephrosis presents with marked dilation of the pelvicalyceal system and renal enlargement (Figs. 26, 27).
Kidney stones appear as hyperechoic structures, most frequently located within the pelvicalyceal system. On the sonogram, a calculus is characterized by an acoustic shadow caused by the complete absorption or reflection of ultrasound waves from its dense structures. This acoustic shadow emerges when the stone exceeds 0.5 cm in size (Fig. 28).
The presence of smaller echogenic structures (1-2 mm) indicates salt diathesis.
In acute pyelonephritis, sonography reveals renal enlargement and thickening of the pelvicalyceal system walls (Fig. 29); in chronic cases, it shows irregular renal contours, thickening and deformation of the pelvicalyceal system, and altered thicknesses of the renal cortex and medulla (Fig. 30).
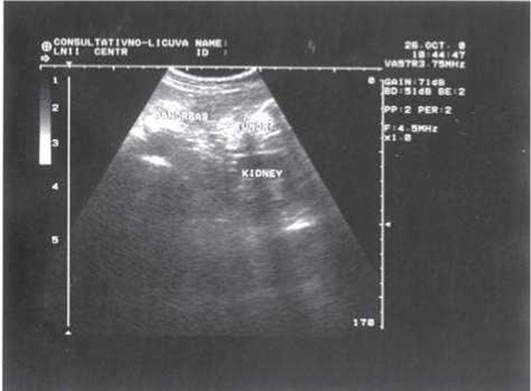
Fig. 24. Renal tumor (ultrasound).

Fig. 25. Metastasis of Gastric Cancer to the kidney (ultrasound; the metastasis is indicated by arrows).

Fig. 26. Hydronephrosis (ultrasound showing an altered STRUCTURE OF THE pelvicalyceal system).
The greatest challenges in renal ultrasound arise when diagnosing diffuse renal changes. In such situations, one can observe renal enlargement, diffuse parenchymal edema (a hypoechoic, "blurred" picture), and indistinct borders between the cortical and medullary layers (Fig. 31).
Ultrasonic assessment of renal vasculature involves two techniques: direct ultrasound scanning, which depicts vascular structure and topographical-anatomical data (ultrasonic angiography), and indirect vascular ultrasound scanning, which graphically records blood flow velocity in the vessel under study (Doppler sonography).
Doppler sonography is based on the Doppler effect: emitted ultrasound waves change frequency upon encountering moving blood form elements (typically erythrocytes). The system records the frequency difference between the emitted wave and the wave reflected from the blood cells, displaying it graphically on a screen to provide information on blood flow velocity and volume in a specific vessel. This technique utilizes ultrasound waves with frequencies exceeding 20 kHz. Since such waves do not propagate well through air, a high-quality, air-bubble-free homogenized gel is applied to improve contact between the transducer and the patient's Skin.

Fig. 27. Hydronephrosis (ultrasound; normal renal structures are not visualized, and the kidney appears as a fluid-filled mass).

Fig. 28. Staghorn renal calculus (ultrasound, with a clearly visible acoustic shadow).
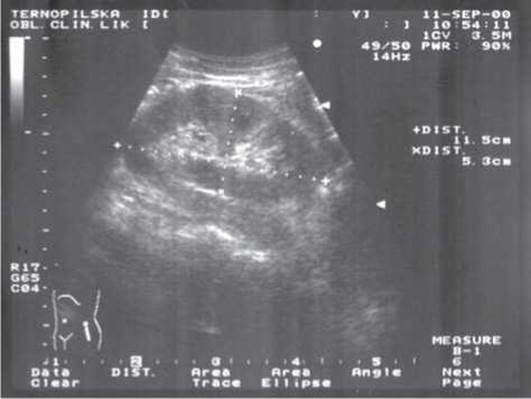
Fig. 29. Acute pyelonephritis (ultrasound).

Fig. 30. Chronic pyelonephritis (ultrasound; the Doppler scan simultaneously shows a decrease in linear blood flow velocity down to 23.2 cm/s).

Fig. 31. Chronic GN (ultrasound).
Ultrasound diagnostic systems provide information on blood flow parameters such as blood flow frequency (in kHz) and linear blood flow velocity (in cm/s, m/s).
It should be noted that the blood flow frequency indicator is the most reliable value, as it depends solely on the frequency response of the transducer. Measuring blood flow velocity, on the other hand, is the result of multiplying the blood flow frequency by the cosine of the angle of inclination of the transducer relative to the vessel projection, and therefore contains more errors.
The actual angle of inclination of the transducer relative to the body surface is of substantial importance for interpreting the obtained results. When the transducer is positioned strictly along the direction of blood flow, the device cannot register the maximum number of ultrasonic waves required to obtain accurate information; therefore, the transducer should be positioned at a minimal angle to the vessel under study. The optimal placement is at an angle of 30°. In this case, cos a ranges from 0.86 to 1.0, and the method error does not exceed 25%, which is acceptable for dynamic clinical studies.
Dopplerography registers not only blood flow frequency but also its direction. To determine the direction of blood flow, THE POSITION OF the ultrasound wave relative to the isoelectric line is analyzed. If the blood flow is directed toward the transducer, the ultrasound curve is located above the baseline; if it is directed away from the transducer, it is below the baseline (Fig. 32).
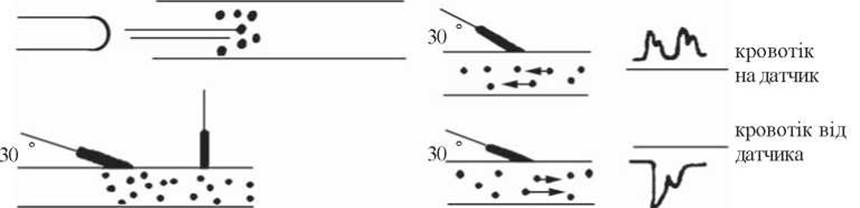
Fig. 32. Dopplerographic image of blood flow frequency and direction (diagram).
Qualitative analysis of spectrograms is based on a visual Assessment of the Dopplergram shape, its deformation, the prominence of the systolic and diastolic Phases of the curve, the position of the wave relative to the baseline, and the uniformity and width of the contour around the systolic peak (Fig. 33).
Quantitative analysis of Dopplergrams is also performed by analyzing A number of parameters (maximum systolic frequency, end-diastolic frequency, mean blood flow frequency per cycle, Asymmetry coefficient, pulsation indices, spectral broadening indices, and vascular resistance indices), the calculation methods of which are described in specialized manuals.
Thermographic methods for diagnosing kidney diseases. THE PRINCIPLE OF thermography is based on recording the intensity of infrared radiation from the skin surface over the renal area. This makes it possible to detect pathological processes whose development is accompanied by changes (most frequently an increase) in renal heat production.

Fig. 33. Normal renal Dopplergram (a) and Dopplergram in chronic PN (b), showing a decrease in linear blood flow velocity (normal is 60–80 cm/s).
Thermographic examination makes it possible to diagnose inflammatory (PN) and immunoinflammatory (GN) processes in the kidneys, tumors, and other conditions at early stages, while dynamic monitoring helps to some extent to objectify treatment efficacy.
X-ray and radioisotope METHODS FOR STUDYING renal function. These methods enable the detection of not only morphological changes in the kidneys and urinary tract, but also functional disorders at fairly early stages of disease development. In particular, X-ray methods are constantly being improved thanks to the DEVELOPMENT OF NEW X-ray equipment and the use of novel, less toxic contrast agents (I.P. Tarchenko et al., 2000).
Various X-ray Examination techniques are used in nephrological practice.
Plain radiography of the urinary tract. This method is mandatory, as the choice of the further course of investigation often depends on the correct interpretation of plain radiograph data. In addition, this method allows for the detection of pathological changes in other tissues (bones, intestines, etc.).
To obtain a high-quality plain urogram, proper patient preparation is required. On the eve of the procedure, a light afternoon snack (e.g., kefir, a piece of white bread, oatmeal, sweet tea) is recommended, followed by a cleansing enema in the evening. The same cleansing enema is repeated on the morning of the examination day (1–2 hours before the procedure).
A classic plain radiograph covers the entire urinary tract, regardless of the affected side, starting from the 10th rib and ending at the lower edge of the Pubic Symphysis. The radiograph should clearly visualize the 11th and 12th Ribs, the bone Skeleton, the transverse processes of the lumbar vertebrae, the psoas muscles, and the renal contours free from superimposed intestinal gas shadows.
When analyzing a plain urogram, attention is paid to the shape, size, contours, angle of inclination, position, and density of the renal shadows, as well as the preservation of the m. psoas shadow.
Normal kidneys are positioned with a slight inclination relative to the spinal axis; their medial margin is projected parallel to the shadow of the psoas muscle. The shadow of the left kidney is located 1.5–2 cm higher than that of the right and is bisected by the 12th rib, whereas the shadow of the right kidney is intersected by the 12th rib at the boundary of its upper and middle thirds.
The average renal dimensions are: for the right kidney, 12.9 × 6.2 cm; for the left, 13.2 × 6.3 cm in men; and 12.3 × 5.3 cm and 12.6 × 5.9 cm in women, respectively (Fig. 34).
A pyelonephritically shrunken kidney assumes a vertical position. Limitation or absence of physiological renal mobility on plain radiographs taken in deep inspiration and expiration phases indicates an inflammatory or sclerotic process in the pararenal tissue. When a patient moves from a horizontal to a vertical position, normal kidneys shift downward by an average of 1–2 cm.
Sometimes, a protrusion of the lateral contour is observed on a plain urogram—the so-called "humpbacked" kidney. Such a finding warrants an angiographic examination or ultrasound to rule out a renal cyst or tumor.

Fig. 34. PROJECTION OF THE kidneys onto the lumbar spine and their normal dimensions (according to I.E. Tareyeva et al., 1995).
The presence of a shadow in the kidney area or along the course of the Ureter provides grounds for establishing a diagnosis of Nephrolithiasis (Figs. 35, 36).

Fig. 35. Kidney stone (plain abdominal radiograph).

Fig. 36. Ureteral stone (plain abdominal radiograph).
It should be borne in mind that only the shadow of a staghorn calculus, whose shape replicates The structure of the pelvicalyceal system, leaves no doubt in the diagnosis. In all other cases, gallstones, pancreatic stones, fecaliths, calcified mesenteric Lymph Nodes, calcified retroperitoneal lymph nodes, calcified Renal tuberculosis cavities, calcified cystic lesions, ovarian calcifications and female pelvic tumors, encrusted tumors and aneurysms, as well as Foreign bodies in the bowel and retroperitoneal space, can be mistakenly diagnosed as kidney stones. In such cases, Additional Diagnostic Methods are employed (Figs. 37, 38).

Fig. 37. Plain radiograph: a - a stone-like shadow is detected in the projection of the right kidney. Excretory urogram: b - renal calculi excluded, an intestinal stone is diagnosed.
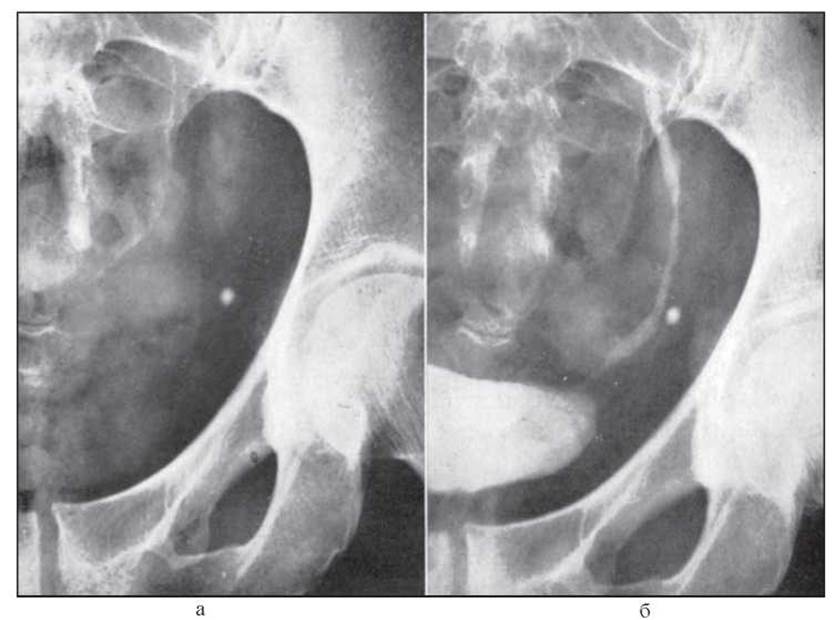
Fig. 38. Plain radiograph: a - a calculus-like shadow is detected in the projection of the left ureter. Excretory urogram: b - ureteral stone excluded (the left ureter is located medially to the shadow).
The most common X-ray examination method for the kidneys is excretory urography. It is based on the ability of the kidneys to excrete radiopaque agents (urographin, urotrast, verographin) from the body. This method provides information on renal excretory function and its impairments due to various causes (inflammation, vascular changes, etc.). To evaluate the functional and morphological state of the kidneys, the contrast agent is administered intravenously after a preliminary individual sensitivity test.
Procedure for excretory urography. On the eve of the examination, the patient has a light dinner, and a cleansing enema is performed on the morning of the procedure. Following the individual sensitivity test and in the absence of adverse reactions or hypersensitivity to the contrast agent (headache, dizziness, hypersalivation, metallic taste in the Mouth, feeling of warmth, blood pressure drop within 20 mm Hg) or allergic complications (urticarial or petechial rash, angioedema, bronchospasm, laryngospasm, anaphylactic Shock), the contrast agent is administered intravenously. Urography is recommended to be performed at 1, 3, 5, 7, 12, and 20 minutes; in clinical practice, however, it is usually limited to 7 and 12 minutes, which should be considered entirely insufficient.
When interpreting the urogram, attention is paid to the intensity of the renal shadows, their size, shape, position, contours, the onset of contrast excretion into the pelvicalyceal system, the density of the contrast shadow, and, in the urinary tract, the presence of morphological changes, urinary tract muscle tone, and urine passage (Fig. 39).

Fig. 39. Normal excretory urogram (kidneys are located in their typical site, Major and minor calyces are well filled, Ureters are traceable).

Fig. 40. Crossed renal ectopia of the right kidney (excretory urogram).
The excretory urogram allows for the assessment of renal position (Fig. 40), as well as the diagnosis of calculi (Fig. 41), pyelectasis (Fig. 42), papillary necrosis (Fig. 43), and other conditions.
The absence of a contrast shadow on urograms indicates impaired renal secretory function, while the density of the contrast shadow reflects its concentrating function. However, satisfactory excretion of the contrast medium by the kidney does not rule out a decline in its function. For instance, a Pyelonephritic Shrunken Kidney may still excrete the radiopaque agent satisfactorily (Fig. 44).
Of crucial importance for the diagnosis of renal diseases is the determination of renal indices—renocortical and renoparenchymal (Fig. 45)—as well as the presence of Hodson's sign.

Fig. 41. Right kidney stone: a - plain radiograph; b - excretory urogram (calculus in the renal pelvis).

Fig. 42. Pyelectasis of the left kidney (excretory urogram of the left kidney at 20 (a) and 60 (b) minutes; the severity of pyelectasis at 60 minutes is more pronounced than could have been suspected at 20 minutes).
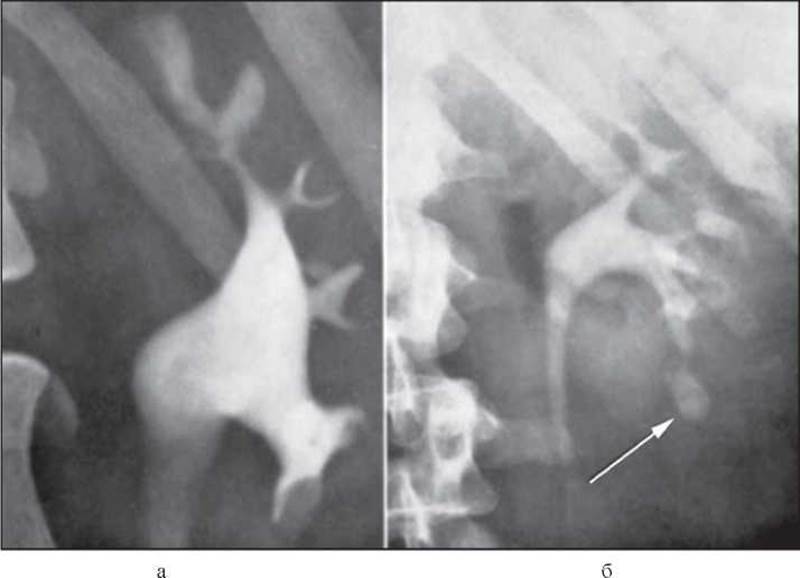
Fig. 43. Papillary necrosis - excretory urogram of the left kidney: a - initial stage: poor contrast Filling of the lower calyx; b - stage of established papillary necrosis: typical rounded shadow in the lower calyx due to sequestration.
Renocortical index (RCI) = (C + D) : (A + B).
Normal RCI values range from 0.34 to 0.36; in renal pathology, the RCI decreases.
Renoparenchymal index (RPI) = E : F.
In healthy individuals, the RPI is 0.61-0.69, whereas in renal pathology, it increases.
Hodson's sign (C.J. Hodson, 1974) refers to the reduction in renal parenchyma thickness at the poles compared to its thickness in the mid-section (Fig. 46).
Changes in RCI, RPI, and the presence of Hodson's sign are characteristic radiological features of chronic pyelonephritis.
Urotomography. Urotomography is a layered radiography technique of the kidneys that prevents the superimposition of a substantial mass of soft tissues and bowel contents, thereby enhancing the contrast of renal shadows. Performed with the patient in the supine and lateral positions, urotomography provides insight into kidney volume. The principal slice in renal urotomography is the one passing through the renal hilum, renal pelvis, and renal parenchyma.
Urotomography requires no special preparation. For clearer visualization of the renal parenchyma shadow immediately prior to tomography, a radiopaque agent is injected into the bloodstream (nephrotomography, Fig. 47).
Tomography can be combined with excretory urography (Fig. 48) and retrograde pyelography, as well as supplemented with retropneumoperitoneum, pneumocystography, and pneumopericystography when clinically indicated (retroperitoneal neoplasms, renal cysts, adrenal or bladder tumors, and prostate conditions).
Infusion urography is performed using an increased amount of radiopaque agent (60 ml of a 65% urotrast solution or another triiodinated compound diluted in 120 ml of isotonic saline or a 5% glucose solution).

Fig. 44. Chronic pyelonephritis (excretory urogram).

Fig. 45. Renal indices (after A.P. Peleshchuk et al., 1983): A - length of the parenchymal part of the kidney; B - width of the parenchymal part of the kidney; C - length of the caliceal-pelvic region; D - width of the caliceal-pelvic region; E - width of the renal collecting system; F - width of the kidney.

Fig. 46. Hodson's sign - diagram: a - normal kidney, clearly defined interpolar line enabling measurement of the renal cortical thickness; b - evaluation of the excretory urogram in two Regions of the lower half of the right kidney reveals narrowing of the renal substance and caliceal deformation; the left kidney is unaffected; c - evaluation of the excretory urogram reveals small kidneys, irregular contours, and varying thickness of the renal substance along with caliceal deformation. The dashed line indicates normal renal contours (after C.J. Hodson, 1974).

Fig. 47. Nephrotomography in pyelectasis: a - arteriographic phase, b - nephrographic phase (after J.L. Emmett, 1987).

Fig. 48. Nephrotomography: a - excretory urogram indicates a space-occupying lesion in the center of the right kidney, with distorted and compressed calyces; b - nephrotomogram shows no signs of infiltrative growth - a simple cyst of the right kidney (after D. Charly et al., 1989).
The mixture is administered intravenously over 4-10 minutes. The addition of saline or glucose solution reduces the osmolarity of the mixture, thereby preventing complications. Urograms are captured immediately after the infusion ceases and subsequently at 5-10 minute intervals (5-6 urograms).
Infusion urography provides a sharper image of the pelvicaliceal system. Unlike excretory urography, which is contraindicated in acute renal failure, infusion urography can be performed in the early stages of chronic renal failure to clarify its genesis.
Retrograde pyeloureterography is an investigative method that involves ureteral catheterization and is therefore restricted to strict clinical indications (diagnosis of renal tuberculosis, hydronephrosis, papillary pelvic tumors, refluxes, kidney and ureteral stones, pelviureteric junction stricture, etc.) (Figs. 49-54).

Fig. 49. Pyelectasis: a - excretory urogram showing pyelectasis of the left kidney; b - retrograde pyelogram demonstrating a more pronounced degree of pyelectasis.
This can lead to serious complications, such as pelvicalyceal, fornical, and tubular refluxes, acute renal failure, acute prostatitis, and acute epididymitis.
Pneumorenal imaging and retropneumoperitoneum. The Essence of the method consists in introducing gas (air, oxygen, nitrous oxide, or carbon dioxide) into the perirenal space via puncture of the lumbar region (pneumorenal imaging) or the presacral region (pneumoretroperitoneum). From 150 cm3 (in children) to 500 cm3 (in adults) of gas is slowly injected into the perirenal adipose tissue.

Fig. 50. Retrograde pyelography in urolithiasis: a - plain abdominal radiograph: no calculi detected; b - left-sided retrograde pyelography: multiple radiolucent calculi in the renal pelvis and lower calyces.

Fig. 51. Retrograde pyelography in papillary necrosis: calyces appear dilated due to sloughed papillae; "negative" shadows in the upper medial and lower calyces of the left kidney are formed by detached papillae.

Fig. 52. Pyelotubular refluxes: left-sided retrograde pyelography - collecting tubules are visible as brush-like lines extending from the fornix of the calyx.
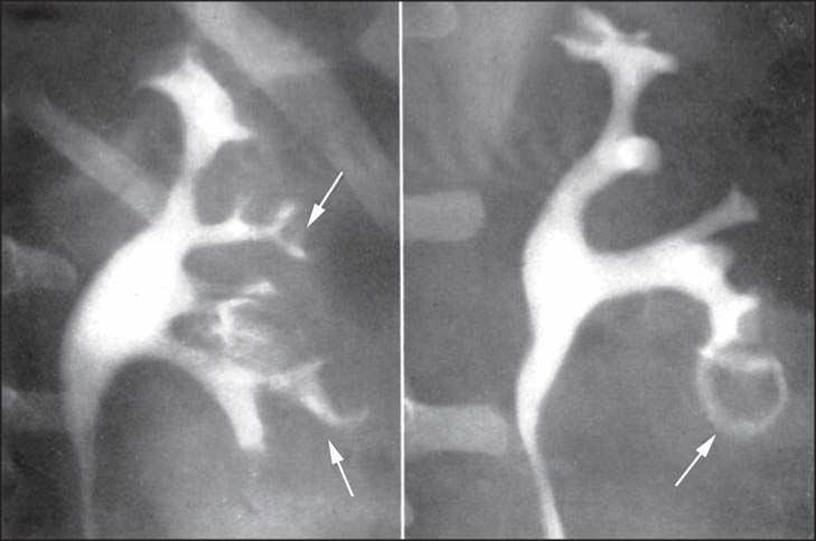
Fig. 53. Pyelovenous refluxes: left-sided retrograde pyelography - arcuate vessels are well visualized due to the rupture of minor calyces, arcuate, and interlobular Veins.
These methods, combined with tomography, are used to diagnose tumors of the Adrenal Glands and retroperitoneal space. Contraindications include heart failure, arterial hypertension, acute inflammatory processes in the anal region, presacral or retroperitoneal tissue, and hemorrhoids.
Antegrade pyelography. In this procedure, a radiopaque contrast agent is injected into the renal pelvis via percutaneous puncture under ultrasound guidance. This technique is employed when other diagnostic methods fail to determine the Nature of the renal lesion. This typically applies to conditions where excretory urography shows no contrast excretion and retrograde pyelography cannot be performed.
Most commonly, antegrade pyelography is used in cases of a so-called non-functioning kidney, when it is necessary to precisely establish the level and length of ureteral obliteration, which is crucial for planning Surgical treatment.
Electroradiography is based on the use of high-energy X-rays. This method allows for a detailed Study of the pelvicalyceal system structure and the differentiation of calculi, tumors, and extrarenal masses. An important advantage of the method is its cost-effectiveness, as images are produced on regular paper.
Computed tomography. With this imaging method, the analyzed data is displayed as an image on a computer screen.
Unlike conventional X-rays, computed tomography provides quantitative information about the density of tissues within the scanned plane. In uronephrological practice, it is used to diagnose space-occupying lesions, polycystic kidney disease, and renal calculi, neoplasms of the Urinary Bladder, prostate, and retroperitoneal space, the extent of malignant processes, the radicalness of surgical resection, therapeutic regression, and the detection of metastases (Figs. 55-58).
The disadvantage of this method is the significant radiation dose to the patient.
Renal digital subtraction angiography / Plain renal angiography is a highly informative method that yields maximum diagnostic information from a single examination.
Transfemoral Seldinger aortography has found widespread application. In this technique, a special needle is used to puncture the femoral artery 1 to 2 cm below Poupart's ligament, a catheter is advanced to the level of Origin of the renal Arteries from the aorta (at the level of the first lumbar vertebra), and a radiopaque contrast agent is subsequently injected through the catheter.

Fig. 54. Chronic pyelonephritis (retrograde pyelography showing marked deformation of the pelvicalyceal system).
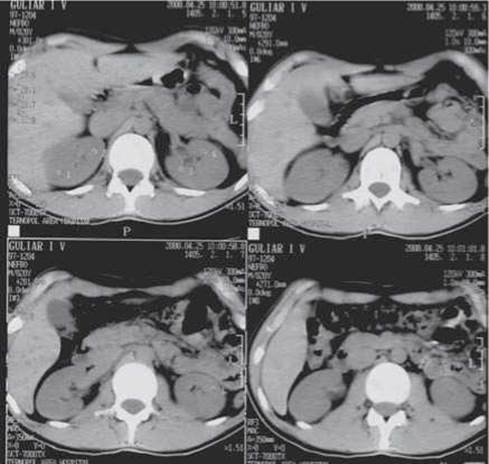
Fig. 55. Computed tomography (normal kidneys).

Fig. 56. Computed tomography (right kidney tumor).
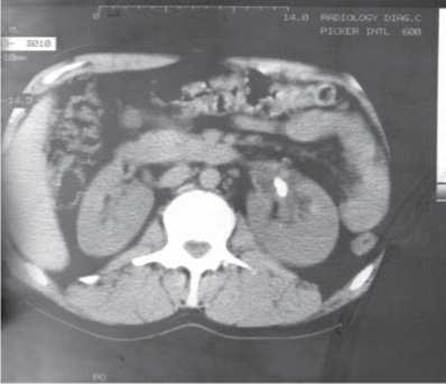
Fig. 57. Computed tomography (left kidney calculus).

Fig. 58. Computed tomography (left pyelectasis).
During standard renal angiography, 4 phases of radiopaque agent circulation in the kidneys are distinguished:
- Phase I: filling of the aorta, renal arteries, and their branches (arteriogram);
- Phase II: assessment of the dense tissue structure of the renal parenchyma (nephrogram);
- Phase III: visualization of the main renal veins (venogram);
- Phase IV: characterization of the contrast excretion process (excretory urogram).

Fig. 59. Normal transfemoral angiogram: clearly showing the normal size and appearance of the renal arteries and their branches, the splenic artery, and Branches of the inferior mesenteric artery.
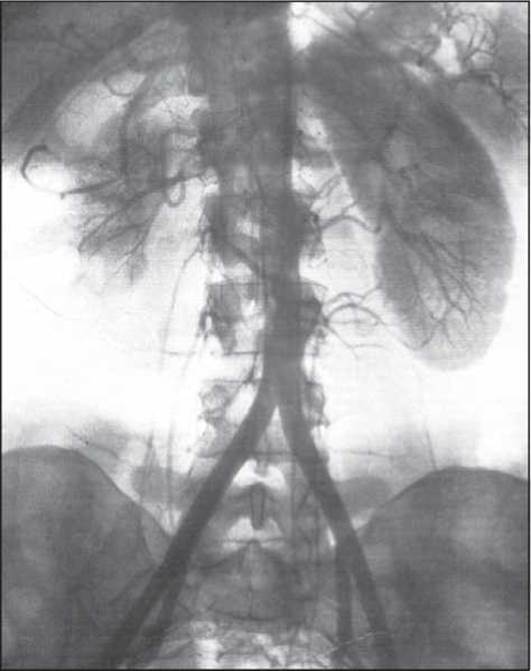
Fig. 60. Angiography in right Renal Hypoplasia (kidney size and the number of its vessels are significantly reduced).
Renal angiography is performed when a tumor or renal hypoplasia is suspected, to differentiate a renal tumor from a cyst or renal echinococcosis, in cases of stage IV and hypertension of undetermined Etiology, hydronephrosis to determine the preservation degree of the renal parenchyma, Nephroptosis, and renal tuberculosis when partial resection is considered, as well as in adrenal tumors, etc. (Figs. 59, 60).
In addition to standard renal angiography, selective renal arteriography is also employed, wherein the angiographic catheter is introduced directly into one of the renal arteries.
This significantly improves the visualization of smaller branches of the renal arteries (Figs. 61, 62).
However, due to individual anatomical variations in THE ORIGIN OF the renal arteries from the aorta, the resulting image may not provide sufficiently accurate information regarding the true angioarchitecture of the kidneys. Therefore, selective renal angiography is always performed following standard angiography.
Venacavography is the radiography of the INFERIOR VENA CAVA after its opacification with a radiopaque agent. It is performed via transfemoral puncture of the femoral vein. A vascular catheter is advanced into the inferior vena cava up to the confluence of the common iliac veins. Through this approach, the radiopaque agent enters the renal vein retrogradely from the inferior vena cava. Significant renal enlargement is accompanied by the development of collateral vessels, dilation of the renal veins, and venous stasis.
Indications for venacavography include Renal Tumors, the need to detect tumor emboli or lymph node metastases, determining the localization of retroperitoneal tumors, and venous reflux (Fig. 63).
Renal venography is a method of selective injection of 10–15 ml of a radiopaque agent into the renal vein (filling 2/3 of its length at an injection rate of 10 ml/s).
The procedure is performed in the orthostatic position during the inhalation phase. Renal venography is indicated when a renal tumor, renal hypertension, venous outflow disorders of unknown origin, renal trauma, or a tumor thrombus in the renal vein is suspected.
Lymphography is a radiopaque imaging method used to examine the condition of Lymphatic vessels and lymph nodes when lymph node metastases or retroperitoneal fibrosis are suspected.
Oily solutions (lipiodol, iodolipol, ethiodol) are used as contrast agents for intralymphatic administration. To identify lymphatic vessels, aniline Dyes (e.g., Evans blue) are preliminarily injected intradermally between the 1st and 2nd Metatarsal Bones of the big toe; these dyes selectively accumulate in the lymphatic vessels, staining them blue.

Fig. 61. Normal selective left renal angiography: fine details of small arterial branches traversing all renal structures are clearly visible (after J.J. Kaufman et al., 1988).

Fig. 62. Selective left renal angiography: presence of multiple small negative shadows (polycystic kidney disease) (after J.J. Kaufman et al., 1988).
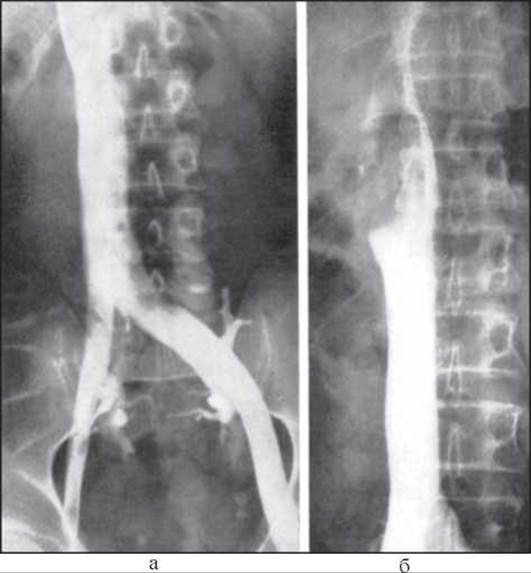
Fig. 63. Venacavography: a — normal venacavogram, b — filling defect due to intramural invasion by right kidney tumor (after J.J. Kaufman et al., 1988).
On a normal lymphogram, the lymph node shadow is homogeneous, whereas metastasis reveals marginal filling defects and dilated collateral lymphatic drainage. However, it is difficult to differentiate between tumor and inflammatory lesions of the lymph nodes using this method; moreover, a serious complication of lymphography can be pulmonary fat embolism resulting from the accidental injection of oil-based contrast media into a vein mistaken for a lymphatic vessel.
Radioisotope renography complements X-ray diagnostic methods, and it is only under this condition that radioisotope techniques acquire significant clinical importance.
Procedure for isotope renography. Isotope renography is performed with the patient seated in a special chair. Two detectors connected to a recording device are placed against the patient's back. The detectors are centered 8–10 cm above the iliac crest, with the right detector positioned 2–3 cm lower than the left one. If a third detector is available, it is placed at the level of The Heart.
A dose of 0.55–0.74 megabecquerels (MBq) of I131-labeled hippuran dissolved in 1 ml of saline is administered intravenously. The recording device automatically plots The process of hippuran Transport from the blood into the kidneys and bladder as a graph.
Each renogram consists of three segments—vascular, secretory, and excretory—which characterize the function of different anatomical PARTS OF THE kidneys. The actual renal function is represented by the last two segments.
Quantitative evaluation of renography results is most commonly based on three parameters:
1. Time of maximum peak of the renogram (Tmax), normal range is 4–5 min.
2. Half-life of the agent (T1/2 max), normal range is 8–10 min.
3. Blood half-clearance time (T1/2 clearance), normal range is 5–7 min (not determined if the third detector is absent).
Depending on changes in these parameters, clinicians interpret impairments in renal vascularization, GFR, and tubular excretion for each kidney.
Schematic variants of isotope renograms are presented in Figs. 64–67.

Fig. 64. Parenchymal-type isotope renogram (reduced curve amplitude, prolonged Tmax and T1/2 max times).
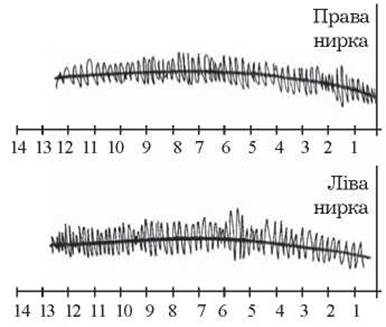
Fig. 65. Isosthenuric-type isotope renogram (low curve amplitude, significant prolongation of Tmax and T1/2 max times).

Fig. 66. Isotope renogram of the left kidney showing an non-functional pattern (absence of isotope uptake). Isotope renogram of the right kidney is normal.
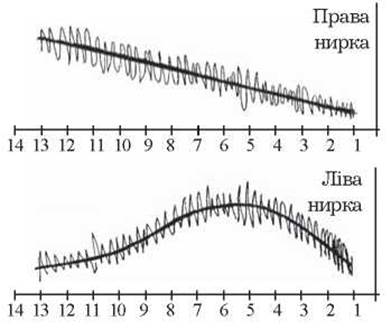
Fig. 67. Isotope renogram of the right kidney showing an obstructive pattern (isotope accumulation in the kidney with no signs of excretion). Isotope renogram of the left kidney is normal.
It should be noted that such a clear categorization of renograms into specific types is somewhat conventional, as all parameters tend to change across Various Forms of renal impairment. False-positive or false-negative isotope renography results can be caused by various factors, including hypo- or hyperhydration, the patient's emotional state, improper sensor positioning, etc.
Renal scanning (scintigraphy) is a method for graphically recording the distribution of radioactive isotopes using automated devices (scanners, gamma cameras).
Essence of the method: unaffected areas of the renal parenchyma absorb nephrotropic labeled compounds (Hg203 and Hg297) more intensively, which appears on the scan as continuous shading, uniformly colored squares, or a numerical distribution.

Fig. 68. Digital renal scintigraphy: a - normal; b - unilateral stenosis of the left renal artery.

Fig. 69. DMSA scan (posterior view): reduction in the size of the right kidney and a significant decrease in its functional capacity (after C.R.V. Edwards and I.A.D. Bouchier, 1994).
If the kidneys contain areas with reduced function or non-functioning areas, the scan will show heterogeneous shading, less intensively colored squares (compared to the normal zone), uptake defects, or a varied numerical distribution (Fig. 68).
Due to the fact that compounds labeled with Hg293 or Hg297 may adversely affect the functional activity of blood elements and the liver, technetium99-labeled dimercaptosuccinic acid (DMSA) is currently used for renal scanning (Fig. 69).
Dynamic renal scintigraphy is a method for obtaining a series of scintigrams that characterize the processes of radiopharmaceutical accumulation in the kidneys and its excretion into the urinary tract. The study utilizes hippuran labeled with I131 or I125 in an amount of 7.4–19.5 MBq.
With normal renal function, maximum accumulation of the agent in the renal parenchyma is observed 3-5 minutes after intravenous administration. After 6 minutes, the contrast of the renal image decreases, and the isotope begins to be detected in the urinary bladder. After 8-10 minutes, the contrast of the bladder image increases, while that of the kidneys decreases significantly. After 11-13 minutes, the predominant part of the agent is detected in the urinary bladder, and by 15-17 minutes the renal image becomes barely noticeable.
Recently, it has become possible to obtain computer scintigrams.
Renal biopsy. Renal biopsy is an intravital morphological examination of renal tissue. It is performed using closed (percutaneous puncture) or open (surgical) methods. This technique has been applied in clinical practice since the 1950s, following the development of a closed renal biopsy method that is more accessible to clinicians.
Recently, closed renal biopsy has been performed under ultrasound guidance, which allows the operator to monitor the movement of the biopsy needle on a display screen. This has significantly improved the quality of this diagnostic procedure.
Renal biopsy is indicated when the diagnostic capabilities of other examination methods have been exhausted. It clarifies the causes of proteinuria, hematuria, and arterial hypertension, differentiating between glomerulonephritis, renal amyloidosis, diabetic nephropathy, tubular dysfunctions, systemic vasculitis, gouty nephropathy, latent pyelonephritis, interstitial nephritis, and nephroangiosclerosis. This research method can determine the cause of rapidly progressive renal failure, diagnosing acute interstitial nephritis, acute cortical necrosis, rapidly progressive (subacute) glomerulonephritis, hemolytic-uremic syndrome, Goodpasture syndrome, and IgA nephropathy. In 30-35% of patients, it is used to determine the morphological form of glomerulonephritis and select the most effective treatment strategy.
Contraindications for renal biopsy include: presence of a single functioning kidney; blood clotting disorders; elevated venous pressure in the systemic circulation; hydronephrosis or Pyonephrosis; polycystic kidney disease; renal artery aneurysm; patient's refusal of the puncture; intolerance to novocaine; suspected tumor or echinococcosis of the kidney; inability to establish contact with the patient; patient age over 60 years; days preceding menstruation in women.
Prior to a renal biopsy, the Blood Coagulation SYSTEM is evaluated, blood type and Rh factor are determined, along with the functional capacity of the kidneys, their position, and mobility. In the case of persistently high arterial hypertension, controlled hypotension (using arfonad, sodium nitroprusside, or diazoxide) is induced at the time of the puncture and maintained for 2-3 days thereafter.
The technique of closed renal biopsy involves using an urorentgenogram to locate and calculate the position of the lower pole of the kidney (Fig. 70).

Fig. 70. Determining the site for puncture renal biopsy: A - distance from the lower pole of the kidney to the axial line of the spine; B - distance from the lower pole of the kidney to the iliac crest; C - lower edge of the costal arch (after I.E. Tareyeva et al., 1995).
The method for obtaining the biopsy specimen depends on the design of the needle. The sample must contain at least 8-10 glomeruli, which ensures a 95-100% success rate for the biopsy.
Complications of puncture biopsy include bleeding into the renal pelvis, subcapsular renal hematoma, and paranephric tissue. Short-term (2-3 days) microhematuria persists in 20-30% of cases, and asymptomatic macrohematuria occurs in 5-7% of cases.
Extremely severe complications of renal biopsy include suppuration of a paranephric hematoma, which may occur without a fever. To prevent complications, the patient must lie on an ice pack for 3 hours after the puncture; strict bed rest, hemostatic agents, and antibiotics are prescribed for the following two days.
The long-term consequences of percutaneous renal biopsy have not been sufficiently studied. Some authors point to the possibility of developing a post-traumatic intrarenal arteriovenous fistula, the Clinical presentation of which is characterized by late macrohematuria resulting from its rupture.
Finally, let us dwell on the diagnosis of renovascular hypertension. This process involves a detailed analysis of anamnestic data (patient sex and age, history of Renal Colic attacks, renal trauma, relationship between hypertension and Pregnancy, and the course of hypertension), clinical examination findings (blood pressure measurement in both arms and legs, presence of a systolic murmur in the umbilical region, signs of chronic renal failure, clinical and ECG signs of coronary artery disease, funduscopic changes), values of specific biochemical parameters (blood levels of glucose, urea, creatinine, sodium, potassium, total cholesterol, Lipids, triglycerides, protein and protein fractions, renin, catecholamines, their precursors, and breakdown products), as well as urinary sediment characteristics and the functional state of the kidneys.
Obviously, data obtained from instrumental methods—both non-invasive (renal vessel dopplerography, computed tomography) and invasive (isotope renography, excretory urography, pneumorenal retroperitoneal pneumography, etc.)—must also be taken into account.
To diagnose RVH today, most clinicians rely on a single screening test (V.O. Bobrov et al., 1998)—the captopril challenge test (sensitivity 94%, Specificity 95%). It is quite straightforward and is based on inducing renal ischemia through the administration of captopril, prompting a renal response characterized by increased renin synthesis.
Test Procedure. The patient is asked to rest for 30 minutes, after which baseline venous plasma renin activity is measured. Following the oral administration of 50 mg of captopril, plasma renin activity is reassessed after 60 minutes. It is crucial that patients undergoing this test refrain from taking Diuretics and ACE inhibitors for three weeks prior to the procedure.
Criteria for a positive RVH test:
- stimulated renin activity (In the second blood sample) is equal to or exceeds 12 ng/ml/h;
- the absolute increase in renin activity is equal to or exceeds 10 ng/ml/h;
- stimulated renin activity (in the second blood sample) increases by 150% or more.
The definitive diagnostic methods for RVH are transfemoral Seldinger angiography and pulsed dopplerography.
The widespread clinical use of transfemoral angiography (sensitivity 96%, specificity 98%) is somewhat limited due to The complexity of the technique, the necessity of vascular puncture, and the potential risk of complications.
The principle of ultrasonic pulsed dopplerography (sensitivity 95%, specificity 97%) involves measuring the time required for blood flow velocity to reach its maximum. A prolongation of this time clearly indicates renal artery stenosis.
However, the most accurate criterion for renal artery stenosis is the Morphology of the waveform itself, which is characterized by the disappearance of the early systolic peak (Fig. 71).
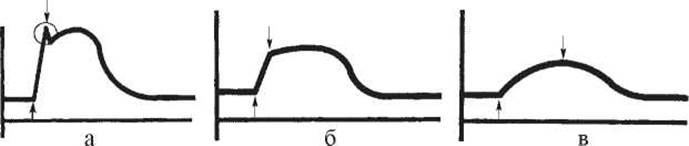
Fig. 71. Doppler waveform patterns in renal artery stenosis:
a) normal blood flow Doppler waveform in the segmental arteries (main renal artery stenosis 0–59%). Acceleration time and acceleration index are measured from the onset of the early systolic upstroke (lower arrow) to the early systolic peak (upper arrow). A normal early systolic peak has the following features: 1) it is a continuation of the early systolic upstroke and shares the same slope; 2) the peak is sharp-angled and rises above the second phase of systole; 3) the angle between the peak and the second phase of systole is less than 180°. The encircled complex represents the early systolic peak;
b) Doppler waveform observed in 60–79% stenosis of the main renal artery. A distinct slope change between early and mid-systole is still preserved, but the early systolic peak is absent. Acceleration time and acceleration index are measured from the onset of early systole (lower arrow) to the point of slope change (upper arrow);
c) Doppler waveform observed in critical (80% or greater) stenosis of the main renal artery or its occlusion. No slope changes are detected between early and late systole. Acceleration time is defined as the time, in seconds, from the onset of systole (lower arrow) to the peak systolic velocity point (upper arrow).
Last update: 08/08/2026
Editorial and Educational Adaptation: This material has been compiled based on the primary/original source text. The project team performed an editorial review, corrected technical inaccuracies, structured sections, and adapted the content for an educational format.
What was processed:
- elimination of formatting defects (OCR errors, structural breaks, corrupted characters);
- editorial organization of content;
- standardization of terminology in accordance with academic sources;
- verification of factual statements against the original source text.
All mentions of the author, publication year, and origin of the primary text have been preserved in accordance with the source.