BOTANY VOLUME 2 - PLANT PHYSIOLOGY - 2007
7. DEVELOPMENTAL PHYSIOLOGY
7.2. Genetic Basis of Development
The totipotency of plant Cells confirms that all cells of an Organism, regardless of their degree of differentiation—angiosperms exhibit approximately 70 distinct Cell types—contain the same Genetic information, which in principle can be accessed. Since new hereditary material does not appear during development, nor does existing material change, the foundation of the differentiation process must be seen in the differential Gene activity during development, both in space and time. This also underlies The Development of unicellular organisms. Differential gene activity is manifested in the varying composition of mRNA fractions or protein sets in differently differentiated cells. It can be investigated with high precision by analyzing The activity of gene promoters (see 7.2.2.1) in Transgenic Plants (see Boxes 7.3 and 7.4). Such analysis can even be performed in vivo, i.e., in the living plant.
Higher plants possess more than 25,000 genes (for details, see Section 7.2.1; regarding the nomenclature of genes and their products, see Box 7.2). Many of these (an exact number is unknown) are expressed constitutively (continuously); the products of these genes perform basic Functions required by all cells (housekeeping genes; these include genes for cytoskeletal Proteins such as Actin or tubulin, as well as genes for many primary METABOLISM Enzymes). In addition, depending on the physiological state or as part of the developmental process, corresponding characteristic genes are activated, while other genes are repressed (downregulated). According to some estimates, the activity of more than half of all genes is regulated, and each cell type is distinguished by hundreds of differentially (cell-specifically) expressed genes, with THE SPECTRUM OF gene activity changing dynamically and complexly throughout development.
7.2.1. Genetic Systems of The plant cell
The total DNA of a cell, containing all genes as well as all intergenic regions, is called the genome. Prokaryotes possess a single, typically circular DNA molecule, which is attached to The Cell membrane as a nucleoid and represents the entire genome or the major part of it. Alongside this, additional circular DNA molecules—Plasmids—are frequently present, responsible for specialized functions. For instance, plasmids may encode genes that confer resistance to Antibiotics or mediate The breakdown of toxic chemicals. Some plasmids play a role in sexual processes. All eukaryotes possess as a subgenome a nuclear genome (nucleome) and a Mitochondrial Genome (chondrome, or chondriome). Plants that bear Plastids (Algae and higher plants) possess, as a third subgenome, an additional plastid genome (plastome), which is, however, absent in Fungi and animals. For reasons of space economy, the following Structure/133.html">Discussion focuses exclusively on eukaryotes (for prokaryotes, see microbiology textbooks).
The term "genome" is used variously in the literature and sometimes as a synonym for the "nuclear genome." In this case, the plastome and chondriome, combined into the "plasmon," are contrasted with the "genome."
The nuclear genome, plastid genome, and mitochondrial genome (see 7.2.1.1 — 7.2.1.3) are characterized by respectively different structures and specific gene sets; they interact within the cell in diverse ways (the details of these interactions are insufficiently understood).
7.2.1.1. Nuclear Genome
The DNA contained within the Cell Nucleus consists of several distinct linear double-stranded DNA molecules and comprises exactly one molecule per chromosome (see 2.2.3.2) in the unreplicated state (or two identical molecules after Replication, one for each sister chromatid, see Fig. 1.9). In a haploid (1n) chromosome set, each chromosome occurs once; in a diploid (2n) set, There are two similar homologous Chromosomes (3n, triploid, features three homologous chromosomes, and so on). The DNA molecules of homologous chromosomes in diploid (triploid, etc.) cells are virtually identical only in obligate self-pollinators or through continuous selfing by breeders (homozygosity). In cross-pollinating plants, homologous chromosomes share the same basic structure and gene composition, but numerous variations exist in the DNA base sequences (heterozygosity).
The total amount of DNA (Fig. 7.4) in the nuclear genomes of various seed plant species can vary by more than 200-fold, ranging from ~125 megabases (125 Mb, 1 Mb = 1,000,000 Base Pairs) in Arabidopsis to over 30,000 Mb in certain Liliaceae. By definition, these values always refer to the haploid chromosome set in the unreplicated state (DNA content equals 1C). The nuclear genomes of algae and fungi are noticeably smaller, with the sizes of the smallest overlapping those of the largest Prokaryotic Genomes. Numerous genomes of prokaryotes and some eukaryotes—among them the nuclear genome of thale cress (Arabidopsis thaliana, Brassicaceae, Box 7.1), which possesses the smallest known nuclear genome among seed plants—have already been fully sequenced (Table 7.2), and consequently, their structure and gene composition are known with high precision.
Class="center">Fig. 7.4. Genome sizes of Mitochondria, plastids, and nuclei in various organisms. Data in base pairs (bp) are given for the unreplicated haploid genome (1C, 1n). The C value generally indicates the DNA content in picograms (pg), but can also be expressed in bp (1 pg DNA = 0.96 • 109 bp). Genomes marked with gray letters have been fully sequenced (see Table 7.2). Abbreviations: A — Arabidopsis thaliana; E — Escherichia coli; H — Haemophilus influenzae; Hs — Homo sapiens; Hv — Hordeum vulgare; Hw — Hansenula wingei; L — Lycopersicon esculentum; M — Mycoplasma; Mp — Marchantia polymorpha; N — Nicotiana tabacum; O — Oryza sativa; P — Podospora anserina; S — Synechocystis; Sc — Saccharomyces cerevisiae; T — Tulipa; Z — Zea mays. Light gray rectangles represent organellar and prokaryotic genomes, dark gray rectangles represent nuclear genomes.

Table 7.2. Sizes of some fully sequenced genomes
Species |
Nucleotide count 1C |
Gene count |
Species |
Nucleotide count 1C |
Gene count |
Chondriomes: |
Bacterial genomes: |
||||
Prototheca wickerhamii |
55,328 |
63 |
Mycoplasma pneumoniae |
816,394 |
677 |
Saccharomyces cerevisiae |
85,779 |
35 |
Haemophilus influenzae |
1,830,138 |
1,709 |
Podospora anserina |
94,192 |
43 |
Synechocystis PCC 6803 |
3,573,470 |
3,169 |
Marchantia polymorpha |
186,608 |
66 |
Escherichia coli K12 |
4,639,221 |
4,397 |
Arabidopsis thaliana |
366,924 |
58 |
Nuclear genomes: |
||
Plastid genomes: |
Saccharomyces cerevisiae |
= 13,469,000 |
6,327 |
||
Nicotiana tabacum |
155,939 |
127 |
Arabidopsis thaliana |
» 125,000,000 |
25,498 |
Arabidopsis thaliana |
154,478 |
128 |
All data refer to the haploid, unreplicated genome (1C, cf. Fig. 7.4). The number of base pairs (bp) for eukaryotic nuclear genomes (nucleomes) cannot be stated precisely due to repetitive sequences and telomeric regions (see 7.2.1.1). The given gene counts for chondriomes and plastid genomes refer solely to identified protein-coding genes, as well as rRNA and tRNA genes. They do not encompass potential genes predicted exclusively on The basis of general structural criteria or protein-coding intronic regions. For bacterial and nuclear genomes, however, all known and potential genes have been summed up. Consequently, the gene counts in these cases should be understood as approximate, yet illustrative for comparative purposes.
Box 7.1. Thale Cress (Arabidopsis thaliana)
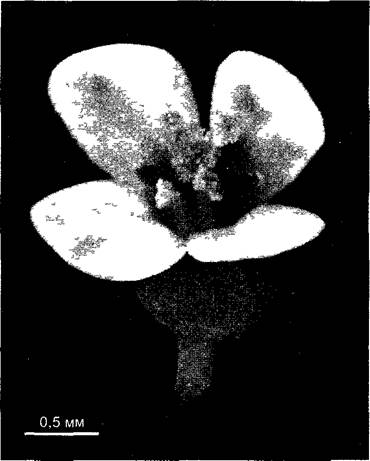
Thale cress (Arabidopsis thaliana (L.) Heynh., Brassicaceae, Capparales; English: Thale Cress) has been used intensively as a model flowering plant in molecular and developmental biology for several decades (Fig. A; see also Fig. 7.65).
Distribution
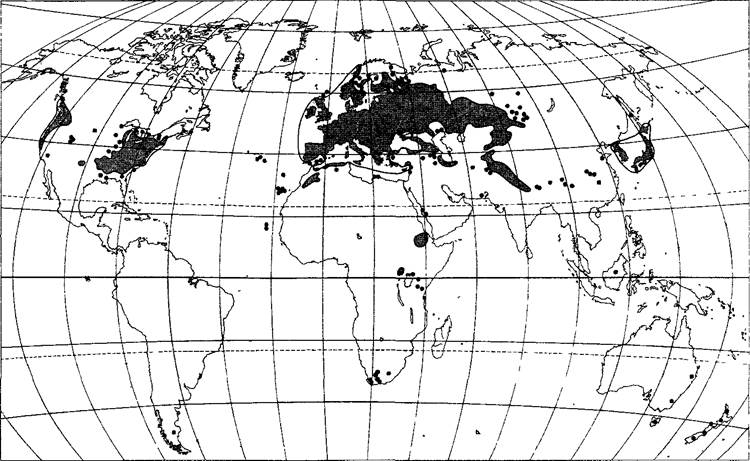
The distribution map (Fig. B) suggests that thale cress originates from a Eurasian/North African center of distribution; in addition, isolated occurrences in Patagonia, northwestern and northeastern America, Japan, as well as along the coasts of southeastern Africa and southeastern Australia indicate anthropogenic dispersal of the plant during the colonization of these lands by Europeans. The world's largest collection of thale cress accessions of various geographical origins is housed at the Arabidopsis Biological Resource Center at Michigan State University (Ohio, USA), which also maintains a mutant collection as well as extensive gene banks and Databases concerning Arabidopsis (accessible on the internet at www.arabidopsis.org, the landing page of TAIR—The Arabidopsis Information Resource—which provides links to all Arabidopsis databases).
Fig. A. Flower of thale cress (Arabidopsis thaliana)
Life cycle and cultivation.
Arabidopsis thaliana is an annual herbaceous plant; it initially forms a basal rosette of leaves, from which elongated shoots emerge after 6 to 8 weeks, subsequently bearing flowers. The flowering time of this facultatively long-day plant (see 7.7.2.2, Table 7.6) is accelerated under an appropriate photoperiod (typically ≥16 h of light). Self-pollination generally occurs; numerous seeds germinate in the light. Initially, they are in a state of mild (physiological) dormancy, which can be broken by stratification (typically 5 days at 4–6 °C) (see 7.7.1.2). The complete Life Cycle of thale cress under natural habitat conditions is ~10–12 weeks; it can be shortened in experiments to approximately 6 weeks, which is primarily advantageous for genetic research. Optimal cultivation conditions for Arabidopsis thaliana are established in climate chambers: a night Temperature of 16–18 °C, a day temperature of 22–24 °C, a relative air humidity of 50–70%, and a light intensity (PAR, see Box 6.2) of 100–200 µmol m-2 s-1, using white fluorescent tubes as the light source.
Genome Structure and Mutagenesis
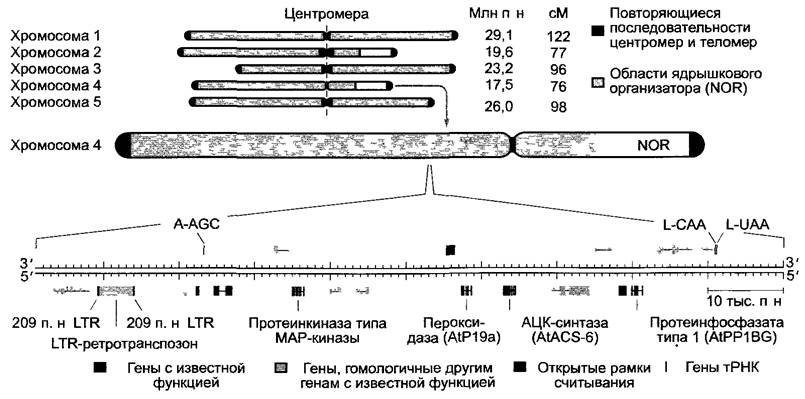
While displaying typical angiosperm plastome (154,478 bp) and chondriome (366,924 bp) sizes (see Table 7.2), Arabidopsis thaliana possesses, by contrast, an unusually small nuclear genome distributed across 5 chromosomes (1 n, haploid set)—the smallest known among all higher plants to date. The nucleotide sequences of all three genetic systems are fully resolved. The nucleotide sequence (published in 2000, internet address: www.aims.cps.msu.edu/aims) was the first completely determined DNA sequence of a higher plant genome. It comprises 125 million bp in the unreplicated haploid chromosome set and contains approximately 25,000 genes. About half of all gene sequences have been predicted solely on the basis of general gene structure criteria (see 7.2.2.1, Fig. 7.8); however, they have not yet been functionally characterized, meaning that only approximate gene counts can be provided. This also applies to the exact base count of the nuclear genome, as regions with highly repetitive sequences, such as those in the telomeric domains (see 7.2.1.1), cannot be accurately sequenced. The precisely determined sequence (115,409,949 bp) covers all protein-coding gene regions, up to the regions on chromosomes 2 and 4 that contain genes encoding highly repetitive rRNA, as well as the highly repetitive telomeric and centromeric domains of all chromosomes (Fig. C).
Fig. C. Geographical Distribution of Arabidopsis thaliana. The main distribution range is shown in gray. Black dots indicate individual collection sites.
Due to The small size of its nuclear genome, genes are packed very densely along the chromosomes (Fig. C). Approximately 80% of the Arabidopsis thaliana nuclear DNA consists of unique sequences, which predominantly represent gene sequences, while only 20% comprises medium- to highly repetitive sequences (see 2.2.3.2; e.g., telomeric and centromeric sequences, as well as the rRNA regions of chromosomes 2 and 4). The average gene size (including promoters, see Fig. 7.8) is about 4 kb. If the nuclear genome DNA sequence were printed in this book using standard font sizes, it would span 2,000 pages.
This high gene density enables highly efficient mutagenesis. T-DNA insertions are frequently used to knock out genes (see Box 9.2). The integration of T-DNA into a gene often disrupts its reading frame. As a rule, this leads to The formation of truncated mRNAs (due to the appearance of stop codons) that are either untranslated or produce non-functional proteins. In addition, chemical mutagenesis using ethyl methanesulfonate (EMS) (Fig. D) is employed, and is often preferred when a complete loss of function of the mutated gene in the homozygote would result in a lethal phenotype (which typically occurs As a result of T-DNA insertion). Conversely, point Mutations—similar to those induced by chemical mutagenesis using alkylating agents—usually disrupt gene function only partially, allowing The Study of genes whose complete loss would have lethal consequences.
Fig. C. Nuclear genome of Arabidopsis thaliana. Karyotype of the five chromosomes of the haploid set (top). The sizes of individual chromosomes are given in millions of base pairs (Mb) of the DNA molecules they contain (1C, unreplicated state). Genetic units (cM = centimorgans) indicate the maximum recombination Frequency of Gene loci in percent, obtained by summing recombination frequencies between adjacent gene loci along the chromosome. Fragment of Arabidopsis thaliana chromosome 4 (bottom): covers 100 kb and corresponds to a region on chromosome 4. Genes are encoded on both strands of the DNA molecule. tRNA genes, as in Fig. 7.5, are labeled with the single-letter code of The amino acid carried by the corresponding tRNA, along with the 5' -> 3' base sequence of its anticodon. A retrotransposon is located within the selected DNA segment. Transposons are Mobile Genetic Elements. Retrotransposons relocate within The Genome via an RNA intermediate, which serves as a template for Reverse Transcriptase to synthesize a DNA copy of the retrotransposon that ultimately integrates into the chromosomal DNA. This integration is mediated by Long Terminal Repeat (LTR) sequences at the ends of the retrotransposon. Retrotransposons exhibit (like related Retroviruses) a "reverse" flow of genetic information (RNA -> DNA) (from Latin retro, backward).
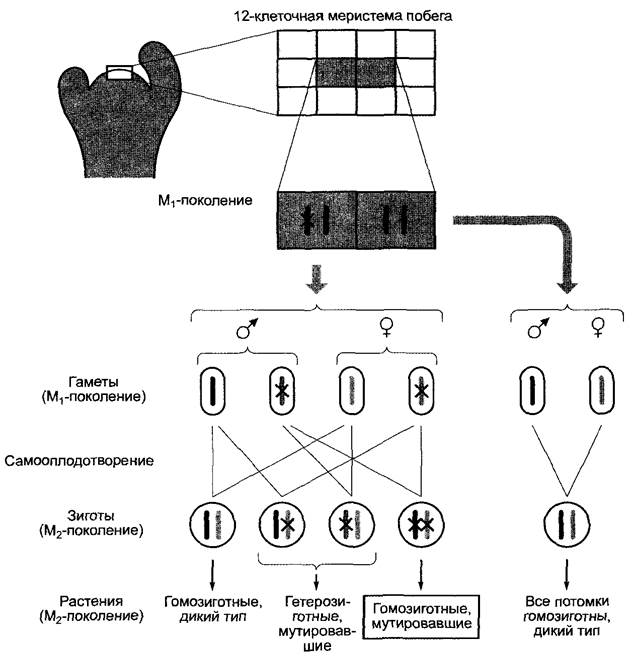
Chemical mutagenesis is commonly performed on seeds, whereas T-DNA insertion mutagenesis is carried out by immersing inflorescences in a culture of Agrobacterium tumefaciens containing suitable Ti plasmids (often combined with vacuum infiltration) (Inserts 7.3, 7.4, 9.2)1. Transformation of plant cells (including those in the meristematic zone) relies on the natural process of bacterial T-DNA transfer into the plant nuclear genome (see Box 9.2); however, through The Use of specialized Ti plasmids lacking phytohormone metabolism genes (see Box 7.3), tumor formation is prevented. Because the 12-cell SHOOT apical meristem of Arabidopsis thaliana contains only two cells that give rise to inflorescences, a single-gene mutation in one of these two cells—even if the mutated trait is recessive—leads to a 7:1 phenotypic segregation ratio in the M2 generation (wild type : homozygous mutant). Consequently, this high percentage of mutants is extremely advantageous for Practical Applications (Fig. E). This has enabled the generation of extensive mutant collections encompassing more than half of all genes.
1 Protocols for insertional T-DNA mutagenesis using Arabidopsis thaliana seeds have also been developed. — Ed. note.
Fig. D. Chemical mutagenesis using ethyl methanesulfonate (EMS). Black dots indicate sites where alkylating mutagens attach to DNA bases; in the case of EMS, ethylation occurs. For Introduction/20.html">DNA Structure, see Fig. 1.4.
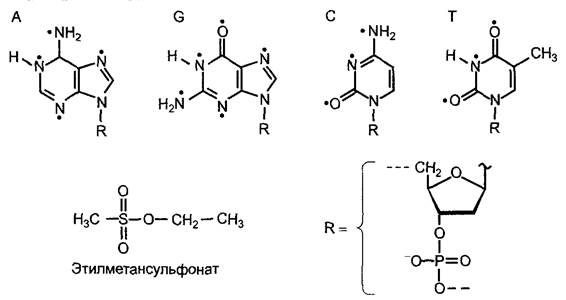
Fig. E. Distribution of mutations in the shoot meristem of Arabidopsis thaliana. The two Cells of the 12-cell shoot meristem highlighted in gray later give rise to the inflorescences. Crosses indicate the mutated allele.
Further information on Arabidopsis thaliana in this book
Various sections of the book feature diagrams and illustrations that are either based on research using Arabidopsis thaliana or depict the plant itself:
✵ general habit (see Fig. 7.65, compared with a brassinosteroid-deficient mutant: see Fig. 11.265, A, B, general floral diagram);
✵ Genome Size comparison (see Fig. 7.4);
✵ Cell Cycle control (see Fig. 7.19);
✵ ROOT structure (see Figs. 7.26; 9.2, C);
✵ cell determination in the root (see Fig. 7.26);
✵ Embryogenesis (see Figs. 3.1; 7.27);
✵ trichome patterning (see Fig. 7.28);
✵ organ formation in the floral meristem and floral diagram (see Fig. 7.29);
✵ Ethylene signaling pathway (see Fig. 7.63); ethylene Biosynthesis mutants (see Fig. 7.62);
✵ brassinolide-deficient mutant cbb3 (see Fig. 7.65);
✵ endogenous circadian rhythm (see Fig. 7.79);
✵ Phytochrome family (see Fig. 7.84) and phytochrome action spectrum (see Fig. 7.85, A, B);
✵ phytochrome control of gene activity (see Fig. 7.86).
The reasons for the wide variation in genome sizes among plants are diverse.
✵ Part of the reason lies in the number or size of genes. Even the largest nuclear genomes have only two to three times as many genes as the smallest ones, primarily due to larger gene families and, to a lesser extent, a greater number of distinct coding functions. The average gene size in large genomes is also only slightly larger than in small genomes.
✵ Genome size can increase due to auto- or allopolyploidization (see 10.3.3.4). For example, tobacco (Nicotiana tabacum) is allotetraploid, and wheat (Triticum aestivum) is allohexaploid.1
1It is hypothesized that modern bread wheat originated from the Hybridization of Triticum monococcum (2n = 14) with Aegilops species: Aegilops speltoides and Aegilops squarrosa. Thus, of the 42 chromosomes of Triticum aestivum, only 1/3 of the DNA belongs to wheat proper, while 2/3 of the DNA belongs to Aegilops. — Ed. note.
✵ Intra-genomic duplications have also led to an increase in DNA amount (and gene number) during evolution. This has been studied in detail in Arabidopsis thaliana (see Box 7.1). Here, duplicated segments—often spanning chromosomal regions of several megabases—account for nearly 60% of the nuclear genome. This explains the much higher gene count in Arabidopsis thaliana (25,498 genes, see Table 7.2) compared to animals of a similar level of complexity, which lack such extensive genomic duplications (the fruit fly Drosophila melanogaster has 13,601 genes, and the roundworm Caenorhabditis elegans has 19,099 genes).
✵ The primary reason for differences in nuclear genome size, however, lies in the proportion of highly repetitive and largely non-coding DNA, which can exceed 90% in very large genomes. Consequently, genes are spaced closer together in small nuclear genomes than in large ones. They are not evenly distributed along the chromosomal DNA molecule, but rather concentrated in specific regions, separated by more or less extensive stretches of non-coding DNA.
Box 7.2. Rules for Naming Genes, Proteins, and Phenotypes
The standardized nomenclature for genes and proteins has proven highly effective. Over time, however, different traditions have become established for various organisms. Because these are not historically fixed designations, this book adopts a uniform terminology for all eukaryotic organisms, similar to that established for Arabidopsis thaliana (see Box 7.1).
Unmutated gene alleles (also referred to as wild-type genes) are designated by three italicized lowercase letters, while mutated alleles are denoted by three italicized lowercase letters. Proteins encoded by genes are designated by three roman uppercase letters (no specific convention is used for proteins of mutated alleles). For holoproteins, uppercase letters are used exclusively for the apoprotein, whereas the holoprotein is designated by three roman lowercase letters. Gene families are denoted either by Arabic numerals (1, 2, 3, ...)1 or uppercase letters (A, B, C, ...), set in roman (non-italic) type. An example is the phytochrome (see 7.7.2.4):
PHYA — designates the wild-type phytochrome A gene;
phyA — designates the mutated allele of the phytochrome A gene;
PHYA — designates the phytochrome A apoprotein;
phyA — designates the phytochrome A holoprotein (apoprotein + prosthetic group, in this case, the light-absorbing phytochrome chromophore, phytochromobilin).
1 There are exceptions to this rule. For instance, while the AP1 and AP2 genes belong to different Transcription factor families, the genes AG and AGL1, AGL2, etc., belong to the same family. — Ed. note.
Genes are often named after the mutant phenotypes that led to their discovery. Mutant phenotypes are designated by italicized lowercase letters. Example: in the nonphototropic hypocotyl mutant, the corresponding (mutated) allele is designated nph11, and the unmutated gene is NPH1. It encodes the NPH1 apoprotein of the nph1 photoreceptor, for which the name phototropin was later proposed (see 8.3.1.1).
1 If several distinct mutations are obtained in the same gene, they are designated using hyphenated Arabic numerals: ap2-1, ap2-6, or ag-1, ag-4, etc. — Ed. note.
In prokaryotes, wild-type genes are also designated using a three-letter italicized lowercase code. Genes within the same Operon are frequently assigned the same code followed by an uppercase letter to distinguish individual genes (e.g., the lac genes are the GENES OF THE lactose operon in Escherichia coli; lacZ encodes the enzyme ß-galactosidase, lacI encodes the repressor protein for lacZ; the lac operon, cf. also Box 7.3, Fig. C, and textbooks on microbiology or Molecular Genetics). Wild-type genes are superscripted with a plus sign (e.g., lac+); however, a minus sign is not used to designate a mutated allele. Protein nomenclature in prokaryotes generally follows a different convention: a three-letter code with only the first letter capitalized (example: VirA is the protein encoded by virA). Phenotypes are also designated with a three-letter code, but with an initial capital letter and in roman type (e.g., His+ for a strain capable of Histidine biosynthesis). Mutant phenotypes may be indicated with a superscript minus sign (e.g., His- for a mutant that can no longer synthesize histidine).
The nomenclature for mutated or unmutated alleles of the plastid genome and chondriome follows the prokaryotic convention.
Box 7.3. Production of Transgenic Plants
In the mid-1970s, with the discovery of Restriction Endonucleases (prokaryotic enzymes that cleave double-stranded DNA molecules at highly specific sites within a DNA sequence (Fig. A, B)), the biological sciences entered the era of Genetic Engineering. This term encompasses a range of Methods for the targeted alteration of hereditary information. When recombinant DNA is introduced into a living cell and stably integrated into its genome (typically the nuclear genome, though in eukaryotic plants, depending on the circumstances, also the plastid genome), a genetically engineered cell is created. In prokaryotes or single-celled organisms, this directly yields a genetically modified organism. In Multicellular Organisms, an organism must first be regenerated from the initial genetically modified cell, with all cells carrying the genetic modification. Regardless of whether the gene originates from the same species, a different species, is a hybrid gene (assembled from fragments of various organisms), or is synthetic, it is referred to as a transgenic organism.
Fig. A. Enzymatic Cleavage of DNA. Type II restriction endonucleases recognize short Sequence Motifs in double-stranded DNA molecules and cleave (“cut”) both DNA strands, typically within the recognition sequence at a precise Location. The restriction endonuclease EcoRI (Eco from Escherichia coli) recognizes the palindromic sequence GAATict (i.e., identical in the 5’ —> 3’ direction on both DNA strands) and specifically cleaves both strands between guanine and adenosine (arrows), breaking the bond between the 3’-OH group of the ribose and the phosphate group. As a result of this symmetrical cleavage, the EcoRI restriction enzyme generates two single-stranded complementary ends characterized by a 4-nucleotide overhang at both resulting 5' ends. Such protruding ends can be used, for example, for hybridization with other DNA molecules that have also been cleaved with EcoRI (see Fig. B).

Fig. B. Principle of cloning target DNA using a plasmid vector. The circular double-stranded plasmid DNA is cleaved with the same restriction endonuclease used to generate the DNA fragment to be cloned (the "restriction fragment"). Short phosphorylated nucleotide overhangs are formed at the resulting 5' ends (see Fig. A). While the open (linearized) plasmid vector is dephosphorylated, 5'-phosphate groups are retained on the cloned restriction fragment. Mixing the linearized vector and the restriction fragment results in complementary base pairing (annealing) between the plasmid vector and the cloned restriction fragment (along with the formation of self-pairs within the plasmid DNA and the restriction fragment DNA). Facilitated by the enzyme DNA ligase, the phosphate groups join with adjacent 3'-OH groups upon the elimination of Water, forming phosphodiester bonds (Fig. 1.4) ("ligation"). Ligation does not occur where two OH groups face each other. Nevertheless, the resulting recombinant plasmid is sufficiently stable to withstand introduction into a bacterial host cell (transfection, most commonly via electroporation). During subsequent replication cycles, the host cell generates intact, closed plasmid molecules without single-stranded breaks. Derivatives of bacterial resistance plasmids are used as Plasmid Vectors, which carry an Antibiotic Resistance gene In addition to an origin of replication. Consequently, bacterial cells containing recombinant plasmids survive and grow in the presence of the antibiotic, whereas non-transformed cells perish. This very simple system does not allow for the insertion of the cloned restriction fragment into the plasmid vector in a specific orientation. However, if two different restriction endonucleases are used sequentially during plasmid linearization and restriction fragment generation such that different sequence overhangs are produced at both ends, directional insertion of the restriction fragment into the cloning vector can be achieved.

Transgenic plants have become essential research objects in biology since their introduction in the mid-1980s, primarily serving as model systems for investigating metabolic physiology and development, as well as for elucidating gene functions. Numerous Examples throughout this textbook are based on data obtained from transgenic plants. At the same time, transgenic plants are of immense importance for agriculture and crop breeding. Since the mid-1990s, transgenic crops have been cultivated on large scales—predominantly in North America, South America, and Australia, and increasingly in Asia. The risks and Prospects of genetically modified crops are the subject of intense debate. Above all, the ecological consequences of deploying these plants worldwide warrant thorough investigation.
The generation of transgenic plants is a multistep process comprising the following stages:
✵ Isolation and precise characterization of the DNA molecule to be transferred. This may involve a genomic region, an individual gene, or a so-called cDNA (copy DNA). cDNA is synthesized using reverse transcriptase in the presence of an mRNA template and 2'-deoxynucleotides (see Fig. 1.4).
✵ Construction of a cloning vector that allows the gene destined for transfer into a suitable organism—typically a bacterial host strain—to be maintained and replicated in A large number of copies ("cloning"). Cloning vectors are generally derived from bacterial resistance plasmids (R-plasmids, see microbiology textbooks). The host strains are safe host strains (most commonly Escherichia coli) which, due to numerous mutations, can grow only on specially formulated nutrient media and are no longer viable outside the laboratory.
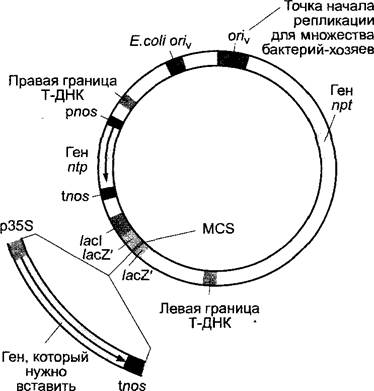
✵ Construction of a transformation vector (typically a plasmid designed to receive the cloned DNA) and introduction of this vector into Bacteria capable of transforming plant cells. Today, plant transformation is performed almost exclusively using Agrobacterium tumefaciens, the CAUSATIVE AGENT OF crown gall tumors (see Box 9.2). Derivatives of the bacterium's Ti plasmid are utilized as transformation vectors. Frequently, plasmids that replicate in both Escherichia coli and Agrobacterium tumefaciens are employed, serving simultaneously as cloning and transformation vectors (Fig. C). A specific region of the Ti plasmid, the T-DNA region (T-DNA = transferred DNA), is transferred into the PLANT CELL AND stably integrated at a random site within the plant nuclear genome (see Box 9.2).
Fig. C. Structure of a transformation vector suitable for cloning in Escherichia coli and subsequent introduction into Agrobacterium tumefaciens, which can be used to transfer T-DNA (see Box 9.2) into plants. The vector carries bacterial resistance markers while containing all elements of the Ti plasmid T-DNA from Agrobacterium tumefaciens required for nuclear genome integration (Box 9.2); however, it cannot mediate plant transformation on its own due to the absence of essential gene elements from the complete Ti plasmid (such as the vir region). Therefore, to acquire plant-transforming capability, agrobacterial strains must harbor a helper plasmid (a so-called helper Ti plasmid lacking the T-DNA region) that supplies the gene elements missing from the transformation vector. The vector shown as an example features the following elements: an origin of replication for plasmid maintenance in Escherichia coli (E. coli oriv) and a broad-host-range origin of replication for replication in other bacteria (including Agrobacterium); a resistance gene for Selection in bacterial hosts (e.g., the npt gene, which encodes neomycin phosphotransferase and confers resistance to the antibiotics neomycin and kanamycin); and the right and left borders of the Ti plasmid T-DNA region (for the Structure and function of this DNA segment, see Box 9.2). These border sequences, along with all intervening DNA fragments, are integrated into the plant nuclear genome. Located within the T-DNA region is a resistance gene for the selection of transformed plant cells (1). Frequently used is the aforementioned npt gene under the control of the A. tumefaciens nopaline synthase promoter (pnos) combined with the nopaline synthase gene transcription termination site (tnos). The nopaline synthase promoter is recognized by plant RNA polymerase II and contains cis-regulatory elements that enhance transcription (see 7.2.2.3). The polylinker or "multiple cloning site" (MCS) (2) is a DNA segment containing closely spaced, partially overlapping recognition sequences for numerous restriction endonucleases, making it ideal for the insertion of diverse restriction fragments. In the example shown, the target gene is inserted into the multiple cloning site; it is flanked on one side by the nopaline synthase transcription terminator and on the other by the cauliflower mosaic virus 35S promoter (p35S; see Box 9.1). The 35S promoter is exceptionally strong and active in nearly all plant cells. In this example, the polylinker sequence is located within the coding region of the bacterial lacZ' gene, preceded by the lacI gene. This arrangement is also utilized in many other plasmids for cloning foreign DNA, as it allows for a very straightforward verification of successful DNA insertion ("blue-white screening") in bacterial host cells. The principle underlying this method is as follows: the lacZ' gene encodes the 5' portion of the coding sequence for the bacterial β-galactosidase enzyme. Suitable bacterial host strains carry the 3' portion of this gene within their chromosomal DNA, but lack a complete lacZ gene. In the presence of the plasmid-encoded lacZ' gene, the two enzyme fragments are synthesized separately within the cell. However, they can associate to form a functional β-galactosidase, which can be detected histochemically in the exact same manner as β-glucuronidase (see Box 7.4) using the substrate 5-bromo-4-chloro-3-indolyl-β-D-galactopyranoside (resulting in blue coloration of bacterial colonies). The inserted polylinker sequence is engineered so that it does not disrupt the reading frame of the lacZ' gene or interfere with enzyme function. However, if the reading frame of lacZ' is disrupted by an inserted DNA fragment, the host bacteria no longer produce a functional N-terminal enzyme fragment, and the resulting deficiency in β-galactosidase activity is manifested as colorless (white) colonies. On an Agar petri dish containing numerous colonies, those carrying a DNA insert (white colonies) can thus be easily distinguished from those without an insert (dark blue/gray colonies). Furthermore, the lacZ' gene (and consequently β-galactosidase activity) is inducible by lacI. This gene encodes a repressor protein that binds to the promoter-operator region of the lacZ' gene, preventing its transcription until IPTG (isopropyl β-D-1-thiogalactopyranoside) is added to the media. IPTG binds to the repressor protein, causing it to dissociate from the operator region and thereby permitting lacZ' transcription to proceed (for the structure and function of the Escherichia coli lac operon, consult textbooks on molecular genetics or microbiology).
✵ Transformation of the host plant. This is achieved using Agrobacterium tumefaciens, either by co-cultivating plant explants (such as tobacco leaf fragments) with the agrobacteria, or through vacuum infiltration of bacteria into seeds or floral Meristems (a method used primarily for Arabidopsis thaliana, see Box 7.1). The cellular processes occurring during T-DNA transfer are described in detail in Box 9.2.
For plants that cannot be transformed using Agrobacterium (such as many monocotyledonous species), alternative approaches have been developed, predominantly transfection (The transfer of protein-free DNA molecules into cells). These include stable DNA integration via biolistic transfection (" bắnardment" of plant Tissues with tungsten carbide or gold microparticles coated with DNA molecules); electroporation (the transient application of a high-voltage electrical pulse between two electrodes submerged in a suspension of plant protoplasts and DNA molecules); chemical methods (e.g., The addition of polyethylene glycol to mixtures of protoplasts and plasmids); and microinjection (the targeted injection of DNA directly into specific cells).
• Selection of successfully transformed (or transfected) cells. This is accomplished using appropriate gene fragments that are introduced into the plant cell via T-DNA and expressed following integration into the plant genome (Table A). Resistance genes are frequently employed. In the example shown in Fig. C, this involves a bacterial gene encoding neomycin phosphotransferase, which inactivates the plant-toxic antibiotic kanamycin through phosphorylation. Consequently, successfully transformed (or transfected) plant cells survive in the presence of kanamycin, whereas non-transformed cells perish.
• Regeneration of differentiated plants from the selected cells. When protoplasts are used for transfection, cells surviving the selective agent (e.g., kanamycin) can give rise to callus tissue on an appropriate culture medium supplemented with auxin and cytokinin (see 7.6.2.3). Altering the auxin-to-cytokinin ratio allows large numbers of whole plants to be regenerated from these calluses (see Fig. 7.47). For transformation mediated by Agrobacterium tumefaciens, plant tissues (such as leaf discs) are co-cultivated with the bacteria. Transformed cells can similarly be cultivated into calluses on hormone-containing nutrient media supplemented with a selective agent, while non-transformed tissue dies on such media.
Table A. Examples of foreign genes used for plant transformation
Gene product |
Application of the gene |
Neomycin phosphotransferase (NPT) (kanamycin kinase) Chloramphenicol acetyltransferase (CAT) Phosphinothricin acetyltransferase (PAT) β-D-Glucuronidase (GUS) Green fluorescent protein (GFP) |
Selection of transgenic plants (antibiotic resistance) Selection of transgenic plants (antibiotic resistance) Selection of transgenic plants (herbicide resistance) Reporter of gene activity (histochemical color assay) Reporter of gene activity (direct visual visualization of transformation in vivo) |
Fig. D. Regeneration of tobacco shoots from leaf callus. Transferring the callus to a nutrient medium with an elevated cytokinin concentration and a reduced auxin concentration induces shoot regeneration.
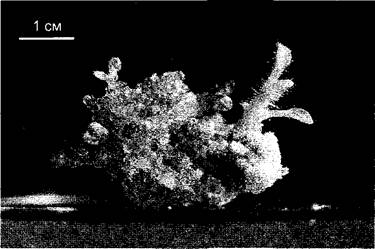
Entire plants are regenerated from the calluses (Fig. D). To initiate cellular transformation using Agrobacterium, it is often sufficient to briefly immerse (vacuum-filtrate) a flowering shoot of Arabidopsis thaliana in a bacterial suspension. If this process transforms the floral meristem cells responsible for ovule formation, subsequent Pollination and Fertilization yield both non-transformed and transformed seeds. The latter develop in the presence of a selective agent (kanamycin in our example), whereas non-transformed seeds fail to survive. Homozygous transgenic plants are then obtained through self-fertilization (as Arabidopsis thaliana is a self-pollinator; see Fig. 7.1).
✵ This is followed by the genetic, biochemical, and physiological characterization of the regenerated transgenic plants, and, if necessary, subsequent breeding work.
Here we have covered only selected technical details of this procedure. Further information can be found in textbooks on molecular genetics or molecular biotechnology.
Box 7.4. Applications of transgenic plants
Transgenic plants have held fundamental scientific significance for many years. Moreover, in recent years they have found increasingly widespread application in agriculture, following the commercial release of the first transgenic crops in the USA in 1995. The diverse application areas of transgenic plants can be illustrated by a few examples, which include:
• Upregulation of Gene Expression (overexpression) of the species' own genes, for instance, through the use of more potent promoters (specifically the cauliflower mosaic virus 35S promoter, see 9.3.2, Box 9.1).
• Downregulation of expression of the species' own genes, for example, via antisense co-suppression. In this approach, a copy of the gene under investigation (or its cDNA) is ligated in reverse orientation to a suitable promoter (such as the cauliflower mosaic virus 35S promoter), and this construct is introduced into the genome as described above. Consequently, transcription by DNA-dependent RNA polymerase II reads the coding strand rather than the template strand (transcription, Fig. 7.11A). This generates an mRNA that is complementary to the template strand while simultaneously being complementary to the mRNA produced in the cell by the correctly oriented gene—hence the term "antisense" mRNA. These complementary mRNAs presumably form double-stranded RNA molecules that are degraded by double-strand-specific ribonucleases. As a result, the "sense" mRNA is eliminated from the cell and rendered unavailable for Translation. The first transgenic crop brought to the market was a firm-fruited tomato that acquired its specific trait through antisense co-suppression. Expression of the "antisense" polygalacturonase gene strongly suppressed the synthesis of this enzyme within the fruit, thereby drastically reducing the degradation of middle lamellae (composed largely of polygalacturonate/pectin), a process that normally occurs during ripening and contributes to fruit softening.
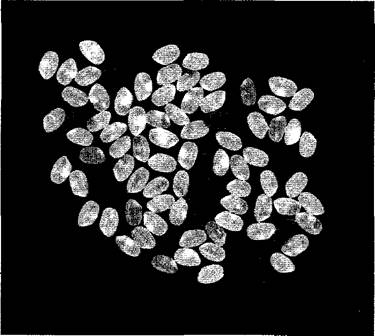
• Expression of foreign genes in plants, for example, to introduce Disease resistance or to produce a modified or novel metabolic product. Among other things, attempts are being made to achieve A balanced diet on a purely plant-based diet by expressing foreign genes that encode proteins with an Amino Acid Composition better suited for Human Nutrition in seeds. Recently, researchers successfully introduced genes for the complete biosynthesis pathway of β-carotene into rice plants (Fig. A) and achieved their expression in the endosperm. The production of transgenic rice with a high β-carotene content represents a milestone in combating Vitamin A deficiency, which is particularly prevalent among children in populations where rice is the staple food (β-carotene = provitamin A).
Fig. A. Synthesis of β-carotene in the endosperm of transgenic rice grains.
The expression of phytoene synthase, phytoene desaturase, and lycopene cyclase genes leads to the accumulation of more than 1 mg • kg-1 of β-carotene in the starchy endosperm (dark gray coloration!) of rice plants transformed with these genes (agrobacterium-mediated transformation, see boxes 7.3, 9.2). Wild-type rice does not produce β-carotene in the starchy endosperm, making the grains appear colorless.
• Investigation of transcriptional control of plant genes. For this purpose, the promoter to be investigated is fused to the coding region of an easily detectable gene, also referred to as a reporter gene (or alternatively to a cDNA containing the coding region of such a gene) (see box 7.3, Tab. A), and this gene construct is introduced into the genome of the plant under study. The promoter's activity and regulation in the transgenic plant can then be analyzed because the resulting gene product is readily detectable. Frequently used reporter genes include the β-glucuronidase gene uidA from Escherichia coli, which can be detected histochemically (Figs. B–D), or the green fluorescent protein (GFP) gene1 from the jellyfish Aequorea victoria. When excited by short-wave blue light, the GFP protein fluoresces green. Therefore, GFP is particularly well-suited for studying gene activity in living cells.
1 From Green Fluorescent Protein. — Ed. note.
Fig. B. Histochemical assay for β-glucuronidase activity. In the presence of O2, spontaneous oxidation and dimerization of the resulting indoxyl yield the indigo dye. The addition of potassium ferricyanide (III), [Fe(CN)6]3-, accelerates this reaction. The 5-bromo-4-chloro-3-indolyl moiety is also used in histochemical assays for the presence of other Hydrolases, such as β-galactosidase (linked to β-D-galactose) and phosphatase (linked to phosphate).
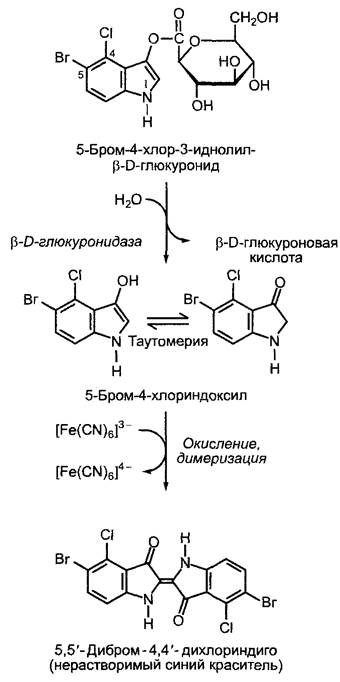
Fig. C. Analysis of promoter tissue Specificity: 1 — histochemical assay for the presence of β-glucuronidase (blue staining, reaction; see Fig. B) reveals the activity of the promoter for the sucrose transporter protein SUC2 (from sucrose), which is specific to cells in the vascular bundles of Arabidopsis thaliana. Activity is not detected in the youngest leaves, which act as sucrose sinks; in leaves containing both source and sink tissues for photoassimilates, the SUC2 promoter is active at the leaf tip (source region), whereas in source leaves, activity is detected in all leaf Veins. This expression pattern suggests that SUC2 is involved in phloem loading. Although promoter and reporter gene assays provide insights into gene activity, they do not confirm whether the corresponding protein is actually produced in the tissue exhibiting gene activity; 2 — localization of the SUC2 protein in conducting cells was demonstrated by labeling the protein with fluorescently tagged specific Antibodies followed by microscopic analysis (overlay of bright-field cross-sections of the leaf with fluorescence micrographs of the same preparation). Areas emitting intense green light show the immunofluorescence of the SUC2 protein in phloem cells. Additionally, a weaker yellow autofluorescence of lignified cell walls is visible in the xylem region. In a longitudinal section through the inflorescence axis 3, companion cells can be distinguished from enucleate sieve elements by their elongated shape and cell nucleus (DNA was stained with the fluorescent dye DAPI — 4,6-diamidino-2-phenylindole, blue emission). The SUC2 protein, identified by the green fluorescence of the antibodies, is localized to the cells (Phloem transport; see 6.8, Fig. 6.72).
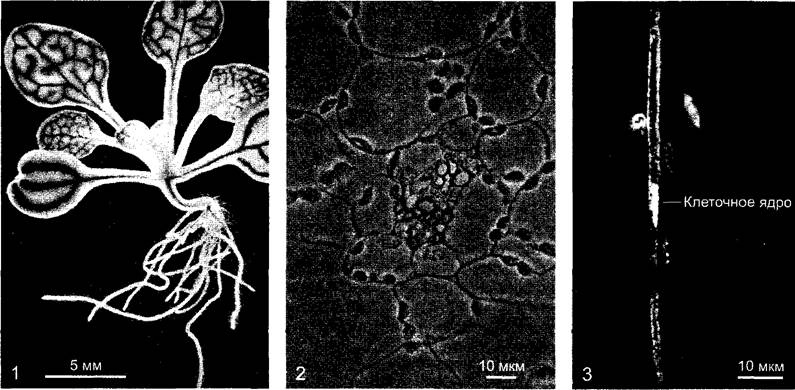
Fig. D. Analysis of environmental regulation of promoter activity. Allene oxide synthase, an enzyme catalyzing an early step in jasmonic acid biosynthesis, is regulated by numerous factors (see 7.6.6.2, Fig. 7.66) that influence the transcription efficiency of the allene oxide synthase gene. The activation of the allene oxide synthase promoter upon wounding can be demonstrated in transgenic plants expressing β-glucuronidase under the control of the allene oxide synthase promoter. Wounding (arrow) triggers a strong local activation of the promoter within a few hours, indicated by high β-glucuronidase activity (shown is a tobacco plant subjected to histochemical analysis for β-glucuronidase 4 hours after wounding). Simultaneously, the promoter is activated along the vascular pathways; this activation rapidly spreads through the plant's vascular tissue and extends into undamaged tissues. This results in systemic induction, which is caused by the systemic propagation of a wound signal that induces the activity of numerous defense genes (see 9.4.1). In tomatoes, this signal is the short peptide systemin (see Fig. 9.19); in other species, The structure of the wound factor remains to be elucidated.
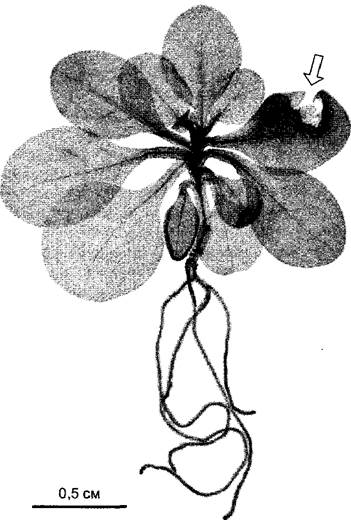
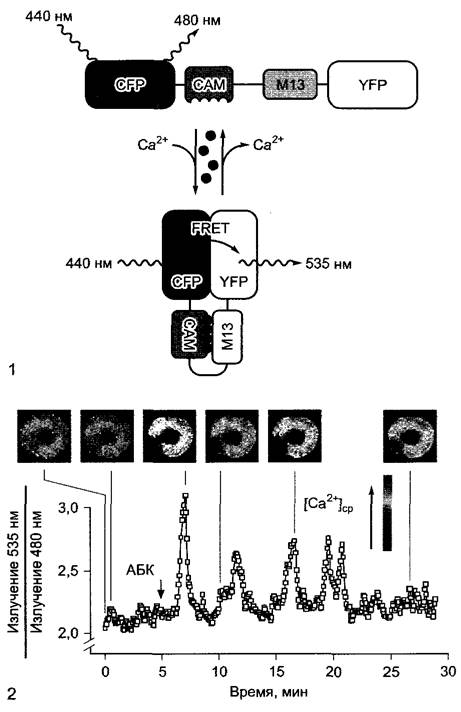
Fig. E. Fluorescence Resonance energy transfer (FRET) technology for studying changes in cytoplasmic calcium levels in guard cells following Treatment with the phytohormone Abscisic acid (ABA) (1 — after R. Tsien, modified; 2 — after G. Allen, J. Schroeder, with kind permission): 1 — Principle of the method. Transgenic Arabidopsis thaliana plants express a chimeric gene whose Open Reading Frame consists of 4 parts encoding a protein with 4 interconnected functional domains. Within the cell, this protein acts as a calcium detector: CFP (cyan fluorescent protein); CaM (calmodulin); M13 (a peptide that binds calmodulin in the presence of Ca2+ ions); YFP (yellow fluorescent protein). CFP and YFP are genetically engineered derivatives of the Aequorea GFP (see text) with altered absorption and emission spectra; calmodulin is a Ca2+-binding protein with 4 binding sites for Ca2+ ions. At low cellular Ca2+ concentrations, calmodulin adopts a calcium-free conformation, and the chimeric detector protein maintains an open structure. When the cell is illuminated with blue light at a wavelength of 440 nm, only CFP is excited, emitting light at 480 nm (cyan). If the intracellular calcium concentration increases, Ca2+ binds to calmodulin, and the M13 peptide associates with the Ca2+-CaM complex. Consequently, the YFP domain is brought into close proximity to the CFP domain. In this conformation, upon excitation at 440 nm, CFP does not fluoresce directly but transfers its excitation energy non-radiatively to YFP, which in turn emits fluorescence at 535 nm (yellow); this phenomenon is known as fluorescence resonance energy transfer (FRET). By measuring the fluorescence ratio at 535 and 480 nm, the cytoplasmic Ca2+ concentration can be calculated, and high-resolution microspectral photometry allows visualization of the spatial distribution of Ca2+ ions within the cell; 2 — FRET analysis of cytoplasmic Ca2+ concentration ([Ca2+]cyt) in stomatal guard cells of transgenic Arabidopsis thaliana plants following the addition of ABA (10 µM). The images show the spatial distribution of Ca2+ ions in the cells at specific time points; the graph illustrates The ratio of light emission intensities at 535 nm to 480 nm over time (mean values for the two shown guard cells). The analysis reveals that the ABA-induced stomatal closure is accompanied by periodic increases in the intracellular calcium level within the guard cells (guard cell movement; see Fig. 8.33).
• Study of molecular processes in living cells. For this purpose, the green fluorescent protein (GFP) from Aequorea or variants of this protein with modified excitation or fluorescence spectra are also frequently used. To investigate the subcellular localization of proteins, chimeric genes are utilized in which the coding sequence for GFP is fused in-frame either upstream or downstream of the coding region of the gene of interest. Transcription of this reading frame yields a single mRNA, and its translation produces a chimeric protein consisting of GFP linked to the N- or C-terminus of the target protein. The Intracellular Distribution of the chimeric protein can be observed under a Microscope via GFP fluorescence in living cells, and even real-time video recording can be performed. Thus, light Microscopy allows direct observation of phenomena such as Cytoskeleton dynamics or vesicular trafficking within the cell.
Particularly well-developed is the method utilizing transgenic plants that synthesize modular, multi-domain detector proteins. These proteins allow the selective and highly sensitive visualization—and even quantification—of dynamic Changes in the concentration of specific ions within the cell (e.g., Ca2+ ions). Calcium is a central regulator of cellular metabolism. Although the cytosolic Ca2+ concentration is only about 0.1 µmol • l-1, it can temporarily rise to several µmol • l-1 in response to numerous stimuli, such as in guard cells following exposure to the phytohormone abscisic acid (see 8.3.2.5, Fig. 8.33). This process can be monitored directly using the FRET technology (Fluorescence Resonance Energy Transfer) illustrated in Fig. E.
Although transgenic plants have long become an indispensable research tool, their cultivation raises public concerns, particularly in Central Europe, whereas in America, Australia, and Asia they have been utilized in agriculture since the mid-1990s.
Repetitive sequences occur either as blocks of multiple tandem repeats of short sequences or as single or low-copy repeats distributed across numerous chromosomal loci (dispersed repetitive sequences). Tandem non-coding sequence repeats are localized in the centromere and telomere regions (see 2.2.3.2). Telomeres form the ends of chromosomes. In the double-stranded DNA molecule, the 3'-end is slightly longer than the 5'-end (3'-overhang) and hybridizes—under conditions of local melting of The Double Helix at the telomeric end—with the complementary sequence of the opposite strand. This leads to the formation of a loop (hairpin) at the chromosome terminus, which is likely bound by specific proteins that stabilize this structure. This enables the cell to distinguish "true" chromosome ends from artificial ones generated by DNA double-strand breaks and prevents chromosome fusion during DNA Repair. Furthermore, telomeres play a crucial role in the faithful replication of chromosome ends. Specific proteins anchor telomeres to the nuclear envelope within the interphase nucleus. During Cell Division, kinetochores assemble at the centromeres, serving as attachment sites for spindle microtubules (see Box 2.2). In the chromosomes of a few species (e.g., Luzula, see 11.2), centromeres cannot be localized as discrete regions; instead, spindle fibers attach along multiple sites of the chromosomes, a condition referred to as holocentric or "diffuse" centromeres. Tandemly arranged sequence repeats also characterize non-coding satellite DNA of unknown function, so named because when DNA fragments are centrifuged in a cesium chloride density gradient, differences in nucleotide base composition—and consequently in buoyant density—cause this DNA to form satellite bands adjacent to the main DNA bands. This should not be confused with morphologically defined satellites adjacent to nucleolus organizer regions (see 2.2.3.3, Fig. 2.25). The ribosomal RNA (rRNA) genes located in the nucleolus organizer regions are represented by more than 20,000 copies per genome, organized as tandem repeats of nearly identical gene sequences and identical intergenic spacers. However, ribosomal RNA genes are clustered on one or more chromosomes (see Box 7.1).
Among the interspersed repetitive DNA segments scattered throughout the nuclear genome, transposons and retrotransposons are of particular importance. Both represent mobile genetic elements that change their genomic position with relatively high frequency or integrate into additional genomic sites during replication. Transposons are characterized by short inverted sequence repeats at their termini, which are essential for transposition.1 Autonomous transposons (e.g., the maize Ac transposon) carry at least one additional gene required for transposition, which encodes a transposase; other transposons (such as the maize Ds elements) rely on an autonomous transposon for transposition because they lack a complete internal coding region. The maize Ac-Ds elements were the first mobile genetic elements, discovered by B. McClintock between 1940 and 1955. In contrast to transposons, retrotransposons mobilize via an RNA intermediate that is transcribed by a transposon-encoded reverse transcriptase into cDNA (copy DNA). This DNA copy can then integrate into another site within the genome. This process is facilitated by long terminal repeats (LTRs) located at the ends of the retrotransposon (or its cDNA). The transposition mechanism bears striking similarities to the replication cycle of retroviruses. Retrotransposons can constitute a substantial fraction of the nuclear genome, accounting for nearly 50% in maize.
1 This feature is characteristic of transposons that transpose via a non-replicative mechanism. During transposition, the transposon sequence is excised from one genomic site and inserted into another. Non-replicative transposons are present in low copy numbers per genome. — Ed. note.
7.2.1.2. Plastid genome
Unlike the nuclear genome, the plastid subgenome—the plastome—exists as a circular closed DNA molecule (cpDNA). Depending on the developmental stage of the photosynthetic apparatus, Chloroplasts contain 20 to 200 identical copies of cpDNA per organelle. Similar to prokaryotes, the DNA molecules are organized into nucleoids. Chloroplasts contain 10 to 20 nucleoids attached to the thylakoid membrane or the inner envelope membrane, each harboring 2 to 20 cpDNA molecules. Plastids are therefore polyploid and polyenergid. Since cells in photosynthesizing leaf tissues can contain more than 100 chloroplasts, a single such cell harbors approximately 10,000 copies of the plastome.
The plastomes of lower and higher plants are similar in size, typically spanning 130–150 kb1 (see Figs. 7.5; 7.4), with lower and upper limits of 70 kb (Epifagus virginiana) and 400 kb (Acetabularia), respectively; many plastomes have been fully sequenced. The plastomes of seed plants contain a conserved set of ~120–130 genes, 90 of which encode proteins. For instance, the well-studied tobacco plastome is 155,939 bp in size and carries 97 genes of known function, along with ~30 additional putative protein-coding regions known as open reading frames (see 7.2.2.1) of yet unknown function (Fig. 7.5).
1 In foreign literature, the unit kilobase (kb, kbp) is used. — Ed. note.
Fig. 7.5. Genetic Map of tobacco plastid DNA (Nicotiana tabacum). The positions and lengths of genes are indicated by boxes; genes whose names are written inside the circle are transcribed clockwise, while those written outside are transcribed counterclockwise. Arrows point to polycistronic transcription units and indicate their direction of transcription. Genes marked with an asterisk (*) contain introns. The DNA segments highlighted by thick lines represent the sequences of two large inverted repeats, which also contain the origins of replication (oriA, oriB); circles denoted by thin lines represent two unique regions. The nomenclature of plastid genes corresponds to that established for prokaryotes (see Box 7.2). Some important genes or gene groups: psa — Photosystem I, psb — Photosystem II, pet — cytochrome b6f complex, atp — ATP synthase, rbcL (from Large) — large subunit of ribulose-1,5-bisphosphate carboxylase/oxygenase. Furthermore: genes for ribosomal Proteins of the small (rps) or large (rpl) ribosomal subunits; plastid-encoded RNA polymerase (rpo), Ribosomal RNAs (rrn). tRNA genes are designated by the single-letter code (see Fig. 1.11) of the carried Amino Acid and their anticodon sequence, e.g., H-GUG: tRNAHis, anticodon 5'-GUG-3'; however, fMet-CAU = gene for the tRNA that binds the initiator codon 5'-AUG-3' via its anticodon 5'-CAU-3' and carries N-formylmethionine (fMet). Open reading frames (ORFs) are designated by the number of their codons, e.g., ORF 350.
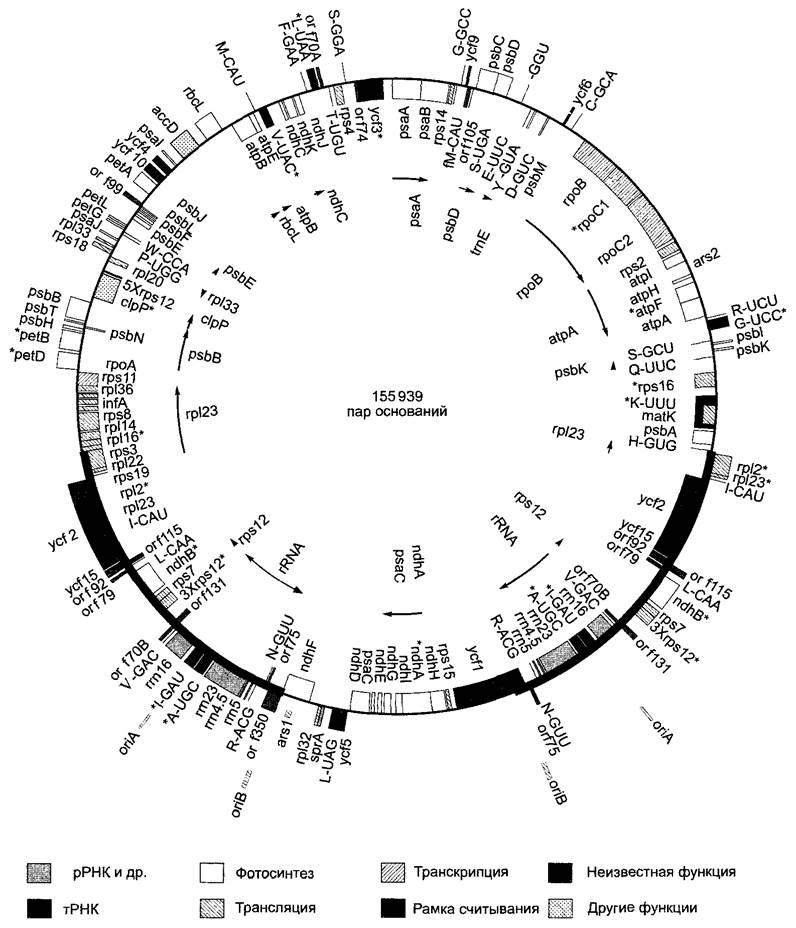
The plastome of most plants contains two large inverted repeats that separate a small and a large unique region from each other. However, in conifers and legumes, as well as in certain species of other families, large repeats are absent from cpDNA.
An unusually small plastome has been found in dinoflagellates: in Heterocapsa triquetra, the cpDNA contains only 9 genes, each of which is localized on its own minicircle chromosome.
In its genetic Organization, cpDNA differs significantly from nuclear DNA, yet it exhibits a striking similarity to the circular genomes of bacteria (endosymbiotic theory — see 2.4). Prokaryotic genomes are characterized by the absence of repetitive sequences. These are also absent from ptDNA, with the exception of duplicated genes in the duplicated gene region that includes the rRNA genes.
The plastome contains a complete set of tRNA and rRNA genes, 20 ribosomal protein genes, and 4 genes for one of the two plastid RNA polymerases (the second is encoded by The Nucleus). In addition, the plastome encodes several proteins required for the light reactions of Photosynthesis, but only a single enzyme of The Calvin Cycle — ribulose-1,5-bisphosphate carboxylase/oxygenase (RubisCO), which contains 8 large and 8 small subunits and is formed with the participation of the plastome. The cpDNA contains the gene for the large subunit of RubisCO, designated rbcL (from 'large'). The small subunits (see 6.5.1) are encoded by the nuclear gene rbcS (from 'small').
The genes for the vast majority of plastid proteins are encoded by the nuclear genome. According to various estimates, plastids contain ~1,900 – 2,300 different proteins, of which, as mentioned, only about 90 are encoded by the plastome. Although plastids, like mitochondria, possess their own translation and transcription machinery, their functions nevertheless depend heavily on the genetic material of the cell nucleus. Therefore, plastids and mitochondria are also referred to as semi-autonomous Organelles (endosymbiotic theory, see 2.4). Modern prokaryotes have approximately 2,000 – 4,000 genes, rarely fewer or more (see Fig. 7.4; Table 7.2). During plastid evolution (which also holds true for mitochondria, see 7.2.1.3), most genes of the original endosymbionts migrated to the cell nucleus, leaving the plastids with only a residual set. It is now assumed that the plastome has predominantly retained genes encoding core functions (transcription, translation) as well as those subject to rapid, direct control by plastid metabolism. For example, the redox state of the plastoquinone system (see 6.4.5) controls the Transcription of the plastid genes for the D1 protein of the photosystem II reaction center (the psbA gene, see Fig. 6.59, Fig. 7.5) and two proteins of the photosystem I reaction center (the psaA and psaB genes; see Fig. 6.61, Fig. 7.5), whereas reduced ferredoxin controls the (initiation of) translation of psbA mRNA via direct dithiol-disulfide redox regulation1 (Fig. 7.6).
1 This refers to regulation via the thioredoxin system.
Fig. 7.6. Redox control of photosynthesis. Along with the REGULATION OF ENERGY distribution via the attachment of the light-harvesting complex LHCII to photosystem II (PS II) or photosystem I (PS I) discussed in Section 6.4.8 — which depends on the phosphorylation of LHCII by an LHCII kinase activated by reduced plastoquinone (PQH2) (lower part of the figure) — other mechanisms of redox control operate at the transcriptional and translational levels. Oxidized plastoquinone (PQ) induces the transcription of the gene encoding the PS II D1 protein (psbA), while reduced plastoquinone (PQH2) induces the transcription of the genes for the PS I reaction center proteins A and B (psaA, psaB). Reduced ferredoxin, via thiol/disulfide conversion (see Fig. 6.71) mediated by thioredoxin (TR) and 60-kDa protein disulfide isomerase (PDI60), activates an RNA-binding protein (BP47) that, in its reduced form, specifically binds to the 5' end of psbA mRNA. This end forms a distinct Secondary structure (hairpin-loop) that arises from internal base-pairing within the hairpin region. The binding of BP47red to the mRNA activates its translation. It is hypothesized that the complex coordinated Control of transcription and translation of genes encoding photosynthetic reaction centers was the reason why, unlike most others, these genes failed to migrate from the genome of the original endosymbionts into the cell nucleus during plastid evolution.

However, the activities of the nucleome and plastome must also be precisely coordinated. Thus, not only RubisCO, but also all Protein Complexes of the photosynthetic Electron Transport Chain as well as ATP synthase contain subunits encoded by both the nucleus and the plastids. The mechanisms of cooperation between the nucleome and plastome remain unclear. Nevertheless, the expression of plastid genes is under the control of nuclear regulatory genes, and conversely, the activity of nuclear genes — such as those for the chlorophyll $a/b$-binding proteins of the light-harvesting complex LHCII (see 6.4.3) or the nuclear-located gene for the small subunit of ribulose-1,5-bisphosphate carboxylase/oxygenase — is regulated by the functional state of the chloroplasts.
7.2.1.3. Mitochondrial Genome
The Mitochondrial Genomes (chondriomes) of plants are highly variable in Size and Structure, and are most often much larger than those of animals (vertebrates: ~16 kb). The variable size of the chondriome is only partially related to a corresponding increase in the gene set; it is primarily due to differences in the proportion of non-coding sequences, many of which consist of repeats. Among these are even fragments of foreign DNA originating from the plastome or nucleome. The substantial size of the plant chondriome is thus the result of secondary alterations typical of plants, rather than the result of minor gene loss during mitochondrial evolution. Like the plastome, chondriomes are polyploid and polyenergidly structured. Baker's Yeast possesses ~100 copies of the chondriome distributed across several nucleoids per mitochondrion, and ~6,500 per cell.
The chondriome of the green alga Chlamydomonas reinhardtii contains 16 kb of Mitochondrial DNA (mtDNA) and consists of a linear double-stranded DNA molecule; fungal chondriomes range from ≈18 to 180 kb (Saccharomyces cerevisiae: 78 kb), while those of seed plants range from 180 (Brassica oleracea) to 2,400 kb (Cucumis melo) (see Fig. 7.4). The chondriome of seed plants most commonly consists of several circular double-stranded DNA molecules of varying sizes that can convert into one another through recombination processes within repeated sequence regions (Fig. 7.7), and only rarely (e.g., Brassica hirta) does it consist of a single circular DNA molecule. In the case of a fragmented chondriome, the largest mtDNA molecule is referred to as the master circle. The chondriome of the liverwort Marchantia polymorpha, one of the first mitochondrial genomes to be completely sequenced (186,608 bp), consists of a single circular double-stranded mtDNA molecule.
Fig. 7.7. Intramolecular recombination of mitochondrial DNA in higher plants. In the turnip (Brassica rapa), mitochondria contain 3 circular mtDNAs of different sizes; the main circle (218 kb) contains a direct repeat (arrows), such that recombination processes can generate two incomplete small DNA circles; the process is reversible.

As with plastids, the capacity of the mitochondrial genome is by no means sufficient to encode all necessary proteins; the majority are encoded in the nuclear genome and imported into the organelle (see 7.3.1.4). Unlike plastids, mitochondria must even import certain Transfer RNAs.
The gene Complement of the chondriome varies somewhat among species, ranging from 12 (Chlamydomonas reinhardtii) to over 60 genes (e.g., Arabidopsis thaliana: 58, Marchantia polymorpha: 66). Furthermore, due to recombination, the arrangement of genes within the chondriome also differs from species to species (unlike the plastome). Alongside components of The electron transport chain and ATP synthase, these include genes for certain ribosomal proteins (which are, however, absent in the smallest chondriomes) and two to three of the four rRNAs. However, none of the known chondriomes encodes all the tRNAs required for mitochondrial translation (Marchantia: 29, Arabidopsis: 22, Chlamydomonas: 3), meaning that nuclear-encoded mitochondrial tRNAs must be imported into the mitochondria. The import mechanism remains unknown. The RNA polymerase required for the transcription of Mitochondrial Genes is also encoded entirely within the nuclear genome in plants.
A consequence of frequent recombination events, including Illegitimate Recombination within the coding regions of genes, is the presence of defective gene copies in many mitochondrial genomes. Consequently, erroneous proteins can sometimes arise. Such proteins are responsible for cytoplasmic male sterility (CMS), which occurs in many angiosperms, including important crop plants (maize, millet, wheat, sugar beet), and is based on pollen sterility. The CMS phenotype is maternally inherited because the male Gametes (sperm cells) of most angiosperms do not transmit mitochondria (nor plastids, for that matter). Pollen sterility is of great importance in plant breeding. For example, in maize hybrid production—which relies on the strict exclusion of self-pollination—the extremely labor-intensive manual removal of male inflorescences (tassels) can be omitted.1
1 This refers to hybrids that exhibit increased yield compared to the parental lines (heterosis effect). The mass production of F1 hybrids is based on CMS. — Ed. note.
7.2.2. Fundamentals of Gene Activity
As shown in the previous chapter, the vast majority of plant cell genes, including practically all genes crucial for development, are localized in the cell nucleus. Likewise, all proteins regulating the activity of the plastome and chondriome genes are nuclear-encoded, as are all proteins involved in regulating the Biosynthesis of Proteins in these organelles. Therefore, the further discussion of Gene Structure and activity control here is restricted to nuclear genes, primarily those encoding proteins. Where necessary, the conditions governing plastid gene expression are briefly addressed.
7.2.2.1. Gene Structure
A gene is a region of the genome that is transcribed into RNA. This may be a protein-coding RNA, which in this case is referred to as Messenger RNA (mRNA), or a non-coding RNA (rRNA, tRNA, among other RNAs, see 1.2.4). The region of a protein-coding gene that is subsequently translated is called the open reading frame (ORF). The fundamental architecture of genes is identical in eukaryotes (animals and plants); a typical structure, from which minor variations may nevertheless occur in detail, is presented in Fig. 7.8.
Fig. 7.8. General structure of an intron-containing nuclear gene and its promoter. Often, the promoter and the transcribed region are collectively referred to as the gene. Individual structural elements are explained in the text. A — adenine; C — cytosine; G — guanine; T — thymine; U — uracil; N — any base1
1 Non-templated addition of the poly(A) tail is not shown in the figure. — Ed. note.

In most eukaryotic genes, the open reading frame is interrupted by non-coding DNA sequences known as introns (intervening regions). The protein-coding segments of the DNA sequence are called exons (expressed regions), which is why eukaryotic genes are referred to as mosaic genes. Transcription (see 1.2.2.2) begins at the transcription start site, which is frequently located several hundred bases upstream of the open reading frame (the first transcribed base is designated as +1); transcription terminates (sometimes also far) downstream of the open reading frame and encompasses both exon and intron regions. The resulting mRNA is termed the primary transcript and undergoes both cotranscriptional (i.e., occurring during the transcription process itself) and posttranscriptional Processing.
The region 5' to the translation start site is called the 5'-untranslated region (leader) of the mRNA, whereas the 3'-region following the termination of translation is called the 3'-untranslated region (trailer) of the mRNA. Both serve various, partially regulatory functions.
By convention, sequence regions located 5' relative to a given reference point on a nucleic acid sequence (such as the transcription start site of a gene) are referred to as upstream, while those located 3' relative to that point are referred to as downstream.
Transcription of a eukaryotic gene typically proceeds in a monocistronic manner, meaning the resulting mRNA encodes a single, specific protein. The DNA segment that controls gene transcription is called a promoter. Promoters are located immediately upstream of the transcription start site and span approximately -150 to -200 bp. However, they may also extend into the transcribed region of the gene, including introns and, depending on the context, even DNA sequences downstream of the open reading frame. For these reasons, the gene is often defined as the transcribed region of the DNA molecule together with its promoter (see Fig. 7.8). Finally, many genes contain DNA regions that are often located far from the gene itself yet stimulate or inhibit its transcription. These segments are called enhancers or silencers. Whereas promoters are typically associated with only a single gene, enhancers and silencers usually affect multiple genes and—in contrast to promoter regulatory elements—frequently act independently of their position and orientation relative to the transcribed DNA region.
In contrast to the nuclear genome, numerous ptDNA genes, much like those in bacteria, are controlled (in groups of several genes) by a single common promoter and are transcribed into polycistronic mRNAs (see Fig. 7.5). Polycistronic mRNA can undergo Various Forms of processing. Some plastid genes contain introns—which are rare in eubacteria, though they can be found in archaebacteria.
7.2.2.2. The Course of Transcription
The conversion of genetic information into the structure and function of a living cell drives the informational flow of DNA -> mRNA -> protein. Here, the DNA code is first transcribed into a collinear mRNA code (transcription), and this code is subsequently translated into a likewise collinear amino acid code of a polypeptide (translation, see 7.3.1.2). As far as is known, the primary polypeptide sequence contains all the necessary information for forming a functional protein (the establishment of secondary, tertiary, and, where applicable, quaternary structures, see 1.3.2), although the Formation of the native conformation frequently requires the assistance of other proteins ("folding helpers", termed chaperones and chaperonins, see 7.3.1.2, 7.3.1.4).
The process of realizing genetic information (from gene to protein) is multi-step (Fig. 7.9) and can only be outlined here in its most essential aspects, with control points proving to be of primary importance.
Fig. 7.9. Information Flow from gene to functional protein. Nucleic acid regions highlighted in grey have a protein-coding function. Individual stages occur partially in parallel within the cell (see text) and are presented sequentially solely for the sake of clarity. Grey arrows indicate major regulatory sites. The scheme shown applies to nuclear genes.

The intensity of gene expression ("gene activity") is determined by the frequency with which successful mRNA synthesis is initiated at the gene's transcription start site. The rate of mRNA synthesis is governed by the activity of DNA-dependent RNA polymerase and remains virtually constant. Protein-coding Genes are transcribed by DNA-dependent RNA polymerase II. RNA polymerase I transcribes the genes for large rRNAs (28S, 18S, and 5.8S rRNA), whereas RNA polymerase III transcribes the genes for small 5S rRNA, tRNAs, and other small RNAs. In what follows, only genes transcribed by polymerase II will be considered.
Of the three phases of transcription:
✵ mRNA elongation,
✵ transcription termination,
it is primarily The first phase that is subject to regulation. The underlying molecular processes have been studied most intensively in animals and baker's yeast, yet the fundamental principles discovered apply to all eukaryotes.
Transcription initiation begins with the assembly of the transcriptosome—a high-molecular-weight multi-protein complex involving RNA polymerase II—at the transcription start site (Fig. 7.10). This initial phase of transcription concludes when the RNA polymerase departs from the complex, whereupon mRNA elongation begins; the transcriptosome then dissociates, only to reassemble if necessary.
Fig. 7.10. Individual steps of transcription initiation for a protein-coding gene in the cell nucleus. According to this model, the pre-assembled RNA polymerase II holoenzyme complex binds near the TATA box to transcription factor II D (TFIID) while simultaneously interacting with the preformed enhanceosome complex. In an alternative model, the binding of the RNA polymerase II holoenzyme complex to TFIID occurs sequentially via the addition of individual components, followed by the sequential assembly of the enhanceosome. Further details are provided in the text. DBD — DNA-Binding Domain; AD — Activating Domain of a regulatory transcription factor; TBP — TATA-Box-Binding Protein; TAF — TBP-Associated Factor.
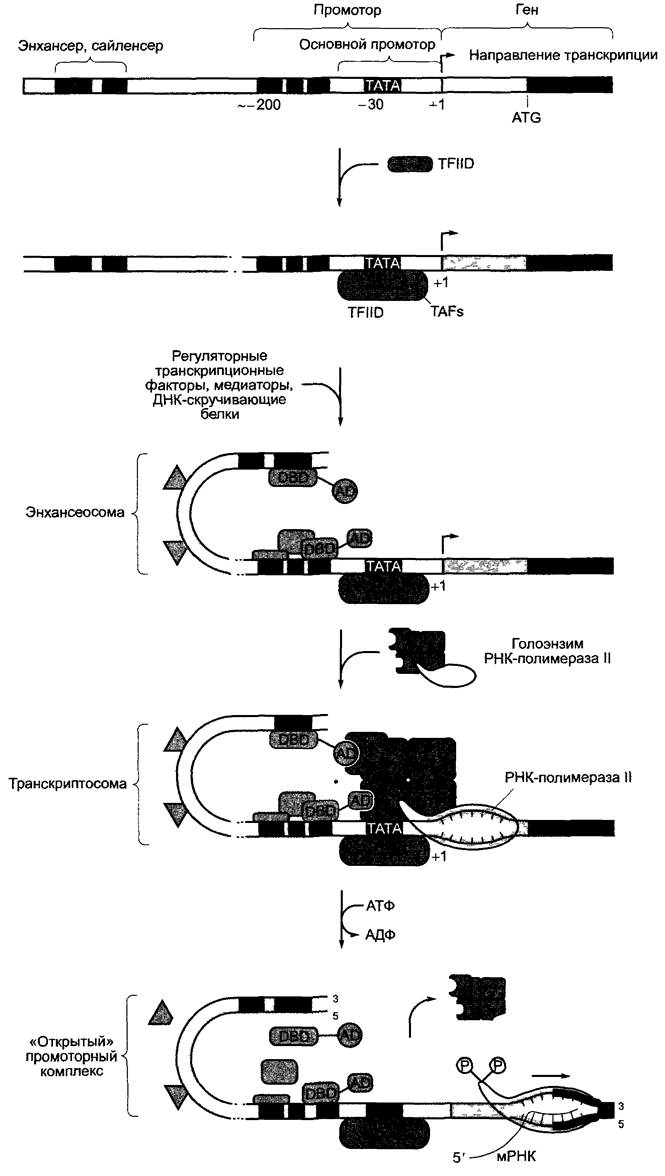
A crucial prerequisite for complex formation is the accessibility of the promoter to the participating proteins.1 This accessibility is regulated genome-wide through Chromatin Structure, though gene-specific mechanisms also exist. It is believed that during transcription, genes possess a nucleosomal structure (see 2.2.3.1) and chromatin exists in the form of a solenoid (30 nm structure) or a "beads-on-a-string" conformation (see Fig. 2.21; 2.22, A). In interphase nuclei, these regions are located within euchromatin. In heterochromatin (see 2.2.3), DNA is more densely condensed and is not transcribed. The induction of heterochromatin formation serves as a mechanism to inactivate larger groups of genes, making it possible, for instance, to shut down (in principle reversibly) functions that are no longer required once a process is complete. Consequently, heterochromatic regions also differ among various differentiated tissues.
1 These proteins are conventionally referred to as transcription factors. — Translator's Note.
Euchromatic DNA forms Structural domains that appear as loop structures under Electron microscopy; these loops are anchored via specific AT-rich Regions of the DNA sequence (scaffold attachment regions, SARs) to the structural proteins of the nuclear matrix. It is hypothesized that transcriptionally active genes reside on these loops. Such functional domains are characterized by an "open" chromatin structure, which arises from the Acetylation of Lysine residues on nucleosomal histone proteins by histone acetylases. Lysine acetylation reduces the positive charge of Histones, thereby weakening their interaction with negatively charged DNA. Histone deacetylases are responsible for the reverse process of chromatin Condensation, which is accompanied by a partial or complete loss of transcriptional activity. Histone deacetylation occurs predominantly in methylated DNA regions. This typical eukaryotic DNA modification is catalyzed by cytosine methyltransferases, which convert specific cytosines (located at the 3' position directly adjacent to or separated by a single base from guanine) into 5-methylcytosine.
In plants, up to 30% of genomic cytosines can be in a methylated state. During replication (see 1.2.3), the methylation pattern of the parental DNA strand is copied onto the daughter strand; thus, the state of chromatin condensation within the genome can be transmitted to daughter cells. It is likely that methylated regions are sequestered by specific binding proteins which, on the one hand, prevent the binding of transcription factors (see below) and, on the other hand, facilitate the recruitment of histone deacetylases that initiate chromatin condensation. Repeated DNA sequences and transposons are frequently hypermethylated and are therefore incorporated into heterochromatin. The degree of methylation is regarded as an inactivation mechanism that prevents transposition and thereby guards against undesired DNA rearrangements. Additionally, there appear to be other, as yet insufficiently characterized factors that alter nucleosome positioning in regions of acetylated histones.
It can be inferred that through the processes described above, numerous genes within the genome are brought into a transcriptionally active state, which serves as a prerequisite for the formation of the transcription initiation complex (transcriptosome).
The assembly of transcriptosomes at the promoter of a transcriptionally active gene involves several stages (see Fig. 7.10):
1. Formation of a platform for binding RNA polymerase II to the promoter near the transcription start site. This function is performed by the general transcription factor TFIID, a protein complex consisting of TATA-binding proteins (TBPs) and several TBP-associated factors (TAFs, all of which are proteins). Since several TAFs have histone-like Protein domains, it is hypothesized that the platform represents a nucleosome-like structure. The region from the transcription start site "upstream" to position 70, which typically (though not exclusively) contains a CAAT box (see Fig. 7.8) and primarily includes the TATA box, is termed the core promoter.
2. Formation of enhanceosomes in the region of promoter sites located further "upstream", including, depending on the circumstances, enhancer or silencer regions respectively. These DNA regions, like the core promoter, are distinguished by short, characteristic sequences that frequently occur in large numbers and with high density, even overlapping, and serve as target sequences for binding with regulatory transcription factors (which should be distinguished from basal transcription factors such as TFIID and others belonging to the RNA polymerase II holoenzyme). These DNA regions are called regulatory cis-elements, and the proteins that bind to them are called trans-factors. Several classes of transcription factors are distinguished: some possess both DNA-binding and protein-binding properties and, via DNA-binding domains, enter into specific interactions with the corresponding sequences of the promoter cis-elements, while using their protein-binding domains to bind other transcription factors or Components of the RNA polymerase II holoenzyme; others engage in Protein-Protein Interactions and are designated as mediators or coactivators; a third group of transcription factors possesses the property of altering DNA conformation (see Fig. 7.10). The formation of a multi-subunit enhanceosome creates diverse and subtle opportunities for regulating gene activity (see 7.2.2.3).
3. Association with DNA-dependent RNA polymerase II. The enhanceosome, together with other mediator proteins and the platform on the core promoter, forms a structure to which the RNA polymerase II holoenzyme binds. The holoenzyme consists of the DNA-dependent RNA polymerase II proper (consisting of 14 subunits in yeast) and other general transcription factors (TFIIA, B, E, F, H), as well as numerous mediator proteins. Thus, the transcription initiation complex is fully assembled.
Transcription begins with the local Separation of DNA strands in the region of the transcription start site. This process can be facilitated by the general transcription factor TFIIH, which possesses DNA-unwinding helicase activity. The so-called "open promoter complex" is formed. TFIIH additionally possesses kinase activity and phosphorylates amino acid residues at the C-terminus of RNA polymerase II. The phosphorylated enzyme now initiates mRNA synthesis, departs from the (subsequently disintegrating) initiation complex, and moves along the template strand in the 3' —> 5' direction during mRNA synthesis
in the 5' —> 3' direction with a base sequence complementary to the template strand. The DNA strand identical in sequence to the resulting mRNA (with the exception that thymine (T) in DNA is replaced by uracil (U) in mRNA, see 1.2.4) is called the coding strand. By definition, sequence data for promoter elements and genes are always presented for the coding strand in the 5' —> 3' direction (Fig. 7.11).
Fig. 7.11. Elongation phase of mRNA synthesis (A — adapted from L. Stryer): A — DNA-dependent RNA polymerase II locally melts the DNA double helix, unwinding it, and within the transcription bubble synthesizes mRNA in the 5' —> 3' direction with a base sequence complementary to the template strand and identical to the coding strand, with U being incorporated into mRNA instead of T in DNA (see Figs. 1.3; 1.4). Within the transcription bubble, a hybrid DNA-RNA helix comprising about 10 — 12 bp is formed, involving the template strand complementary to the mRNA. In the case of the nucleotide sequence shown, this refers to the Methionine codon (AUG, see Table 7.3), which, due to its surrounding context (5' -AАСА AUG GC-3'), serves as the translation start site. These and similar sequences in the region of the Translation initiation codon are called Kozak sequences; B — the process of mRNA synthesis

Analysis of the Fine Structure of interphase nuclei using antibodies against protein components of the transcription apparatus (e.g., antibodies against RNA polymerase II) has shown that transcription activity in the cell nucleus is not distributed uniformly, but is intensified in specific regions. In these areas, provisionally termed "transcription factories," transcription initiation complexes are formed and polymerases remain during transcription, presumably upon binding to the nuclear matrix. According to this view, the enzyme does not "run" along the DNA, but rather "threads" the DNA "through the eye of a needle" while simultaneously polymerizing RNA. DNA replication should similarly be carried out by anchored enzymes ("replication factories") while the DNA molecule moves.
While in bacteria the transcribed mRNA is obtained directly in its mature form, and even ribosome binding and translation, i.e., Protein Synthesis, begin already during ongoing transcription on the nascent mRNA, eukaryotic gene transcription first yields primary transcripts (collectively referred to as heterogeneous nuclear RNA, hnRNA), which are further processed in the cell nucleus. Processing includes:
✵ formation of a cap at the 5'-end of the mRNA (capping);
✵ removal of introns in a process called splicing;
✵ addition of a poly(A) tail to the 3'-end of the vast majority of mRNAs.
The processed mature mRNA leaves the cell nucleus via nuclear pores and is translated in the Cytoplasm (see 7.3.1.2).
Processing reactions occur co-transcriptionally, i.e., already during the elongation of the primary transcript by RNA polymerase II.
The cap structure is formed as soon as RNA polymerase leaves the 5'-end of the synthesized RNA. Guanylyltransferase transfers a GMP residue from GTP to the terminal triphosphate STRUCTURE OF THE RNA with the Cleavage of the y-phosphate residue and the formation of a 5'-5'-triphosphate bridge (Fig. 7.12). Guanine methyltransferase subsequently methylates nitrogen atom 7 of the attached guanine. This basic structure can be modified by further methylation (at the first RNA nucleotide to which the GMP residue was attached, as well as at the 2'-OH group of the ribose of the first and/or second RNA nucleotide). It is hypothesized that the cap is important both for the export of mature mRNA from the cell nucleus and for the initiation of translation (see 7.3.1.2) and, under certain conditions, for enhancing mRNA stability.
Fig. 7.12. Formation of the 5'-cap structure in the primary transcript of nucleus-encoded genes. Synthesis proceeds co-transcriptionally as soon as the 5'-end of the synthesized mRNA is released from RNA polymerase. N1, N2 — arbitrary NUCLEOTIDES; p — phosphate (this notation differs from traditional biochemistry, but is widely used for Nucleic Acids)
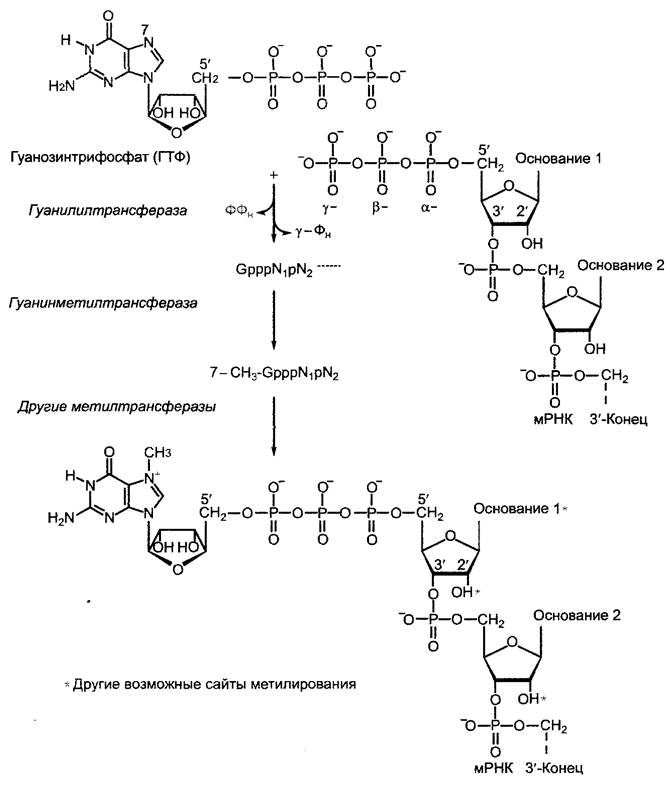
The removal of introns, which is not discussed in detail here for reasons of space, occurs very precisely at splicing sites characterized by conserved sequences (i.e., sequences that are identical in almost all genes)1. The boundaries of introns in almost all protein-coding nuclear genes are defined by The base sequence:

(arrows indicate splicing sites). The base composition of introns is, overall, enriched in AT pairs compared to exons; consequently, the DNA double helix
in intron regions can be "melted" more easily. In addition to protein factors, several Small nuclear RNAs (snRNAs) participate in the splicing process.
1 Such sequences are conventionally referred to as consensus sequences. — Editor's note.
Introns of rRNA or tRNA genes, as well as introns in the plastome and chondriome, have different structures and different splicing mechanisms. For instance, some of these introns are excised from RNA autonomously (self-splicing: they act autocatalytically on their own splicing process). Enzymatically active Ribonucleic Acids are called ribozymes. It is hypothesized that ribozymes are an atavism of the "RNA world"—a very early stage in the evolution of life whose chemistry was based predominantly on ribonucleic acid reactions. Likewise, peptidyl transferase activity during peptide bond formation in protein synthesis (see 7.3.1.2) is currently believed to be catalyzed by a ribozyme, the 23S rRNA of the large subunit of the 70S ribosome (or correspondingly the 28S rRNA in 80S Ribosomes, see 2.2.4).
Polyadenylation of the 3'-end of mRNA, which is typical for eukaryotic mRNAs (though sometimes absent), is linked to the termination of transcription of these genes and is catalyzed by a template-independent RNA polymerase, poly(A) polymerase. The reaction is preceded by mRNA cleavage near the transcription termination site, yielding a new 3'-end to which the poly(A) tail is attached (sequential addition of AMP from ATP, up to several hundred residues). The processing site is frequently, but not always, marked by a short RNA sequence, which, however, can be quite variable in plants. In addition to participating in transcription termination, polyadenylation also appears to influence mRNA stability. Whether it is as crucial for translation initiation as previously assumed remains to be determined.
Extremely rarely in nucleus-encoded mRNAs, occasionally in plastid mRNAs, and most commonly in mitochondrial mRNAs, the base sequence in certain regions undergoes post-transcriptional modification. This process is known as RNA editing. During this process, cytosines are replaced by uracils (and more rarely, vice versa), which is the only way to produce a correct mRNA template for translation. Mitochondrial RNA editing has not yet been detected in algae and mosses; it is typical of cormophytes (pteridophytes, angiosperms, and gymnosperms). Little is known about the mechanisms of editing. Post-transcriptional modifications also lead to the formation of rare bases in rRNA and, especially, in tRNA (see Fig. 1.10).
From the initiation of gene transcription to the formation of a mature mRNA, several minutes may elapse. Given the average activity of RNA polymerase II of ~2,000 bases per minute, mRNA elongation alone for an average-sized gene (3.5–5 kbp) takes approximately 2–3 minutes.
Transcription of plastid genes is carried out by two DNA-dependent RNA polymerases: one plastid-encoded enzyme, which structurally bears a strong resemblance to bacterial RNA polymerase and can form complexes with various promoter-specific sigma factors (all of which are nucleus-encoded), and one nucleus-encoded RNA polymerase with a different architecture, structurally similar to both nuclear-encoded mitochondrial RNA polymerases. This second type of polymerase resembles bacteriophage RNA polymerases; it is presumed to have a very high synthesis rate and is used in plastids to synthesize longer transcripts. It is possible that even before entering into endosymbiosis (endosymbiotic theory, see 2.4), the prokaryotic ancestors of chloroplasts and mitochondria were infected by phages. Transcription processes can be strongly inhibited using antibiotics and toxins. For instance, Rifamycins from Streptomyces (or the semisynthetic derivative rifampicin) suppress the initiation of RNA Synthesis by inhibiting prokaryotic, but not eukaryotic, RNA polymerase. Actinomycin D from another Streptomyces strain inhibits transcription in both PROKARYOTES AND EUKARYOTES by binding to double-stranded DNA, which can consequently no longer serve as a template for RNA synthesis. The fungal toxin α-amanitin from Amanita phalloides strongly inhibits DNA-dependent RNA polymerase II (weakly inhibits RNA polymerase III, and does not inhibit RNA polymerase I at all), thereby blocking the elongation phase of mRNA synthesis, primarily in protein-coding nuclear genes.
The concentration of a specific mRNA in a cell depends not only on the frequency of transcription initiation at the corresponding promoter and the efficiency of processing, but also on mRNA stability within the cell—that is, the subsequent metabolism of the molecule. The biological half-life (the time required for 50% of the molecules to degrade once synthesis has stopped) can range from a few minutes to several years (such as mRNA in seeds). Very little is known about the degradation of plant mRNAs. Like in other eukaryotes, it often appears to begin with the removal of the poly(A) tail and the 5' cap, and is catalyzed by 5' exonucleases—enzymes that hydrolytically release mononucleotides from the 5' end. There is evidence that mRNA degradation can be regulated, but the specific regulatory mechanisms remain largely unstudied.
7.2.2.3. Transcription Control
Although multiple control points exist along the pathway from gene to protein (see Fig. 7.9) that collectively determine the Abundance of a given protein in the cell, developmental differential gene activity is largely regulated at the level of transcription initiation. This step determines which genes are transcribed at all and to what extent. This also encompasses regulatory mechanisms affecting the gene that involve chromatin structure (7.2.2.2). The control of individual gene activity is primarily achieved through the formation of enhancosomes (see Fig. 7.10). This requires, on the one hand, appropriate cis-elements and their combination within the promoter region, often supplemented by additional enhancers and silencers (see Figs. 7.8 and 7.10) and, on the other hand, the transcription factors present in a given cell (or produced according to cellular demands) along with their activation state. The nuclear genome of Arabidopsis thaliana (see Box 7.1) contains over 1,700 genes encoding various transcription factors, accounting for more than 5% of all genes. Both the transcription of genes encoding specific regulatory transcription factors and the activation state of these proteins are controlled by endogenous and exogenous factors. Consequently, multi-step cascades of gene regulation frequently occur. Spatiotemporally, a highly specific set of regulatory transcription factor activities ultimately leads to the differential control of numerous cellular genes encoding structural Proteins and Enzymes, which finally execute the phenotypic expression of traits during organismal development.
For example, hormone-responsive cis-elements are known, to which specific transcription-activating proteins bind upon the action of a phytohormone on the cell, as are light-responsive cis-elements that mediate the light-regulated expression of certain genes (see Fig. 7.8b). The de novo induction of enzymes by substrates (e.g., nitrate reductase, with nitrate as the inducer) or the de novo repression of enzymes by end products (e.g., the repression of nitrate reductase by ammonium ions and glutamine, and Glutamine Synthetase by glutamine) have already been mentioned in the chapter on metabolic physiology; these are classic examples of Metabolic control of transcription. Such processes are well understood in prokaryotes (see microbiology textbooks). However, many molecular processes of transcriptional control in eukaryotes, and particularly in higher plants, remain unknown.
Alongside specific cis-elements and their cognate transcription factors in the promoters of regulatable genes, There are also cis-elements found across many different genes that bind widely distributed transcription factors. This leads to a general, non-selective activation of these genes, which only become selectively regulated through complex formation with specific cis-elements and their respective transcription factors. Two well-characterized cis-elements, found in typical or modified forms in the promoters of numerous regulated genes, are the G-box (5'-CACGTG-3') and the GT-1-box (5'-GGTTAA-3'), whose corresponding binding proteins have been isolated and characterized. Through gene-specific combinations of the core promoter with general regulatory cis-elements and specificity-conferring cis-elements, an extraordinarily diverse Control of Gene Expression is achieved. This spectrum of possibilities is further expanded through the evolution of gene families, whose members can be transcribed and subjected to different regulatory factors thanks to combinations with their own distinct promoters. For instance, the tobacco genome contains 9 genes encoding P-type ATPases, which generate the proton-motive force across The Plasma Membrane (see 6.1.4.3, Fig. 6.4). Each of these genes is controlled by its own promoter, which differs structurally from the others.
Genes whose coding regions show significant nucleotide sequence similarity are called homologous. Homologous genes are termed orthologous if they are found in different organisms and descend from a common ancestor1, and paralogous if they arose within a genome through Gene Duplication events.
1 Sometimes the definition of orthologous genes also includes the requirement that they perform the same function. — Editor's note.
Unlike prokaryotes, whose DNA-dependent RNA polymerase binds directly and very tightly to its promoters, the eukaryotic DNA-dependent RNA polymerase II binds only very weakly to the core promoter. Consequently, the "basal activity" of a bacterial promoter is very high, whereas that of a eukaryotic promoter is very low. As a result, repression mechanisms for down-regulating gene activity are widespread in prokaryotes, whereas they are rather rare in eukaryotes. In eukaryotes, transcription initiation mechanisms primarily exert their effects by enhancing the rate of initiation through the action of transcription activators.
Last update: 07/08/2026
Editorial and Educational Adaptation: This material has been compiled based on the primary/original source text. The project team performed an editorial review, corrected technical inaccuracies, structured sections, and adapted the content for an educational format.
What was processed:
- elimination of formatting defects (OCR errors, structural breaks, corrupted characters);
- editorial organization of content;
- standardization of terminology in accordance with academic sources;
- verification of factual statements against the original source text.
All mentions of the author, publication year, and origin of the primary text have been preserved in accordance with the source.