Amino Acids, Peptides and Proteins - Dévényi T., Gergely J. 1976
Ion-exchange chromatography in a fixed ion-exchanger bed
Applications
Separation OF AROMATIC AND BASIC Amino Acids [3]
Aromatic and basic amino acids on a Fixion 50 x 8 plate are separated by one-dimensional Chromatography in a citrate buffer solution (pH 5.23) with a Na+ concentration of 0.35 M (buffer solution B, Table 10), which is used in the two-Column system of an amino acid analyzer. A typical chromatogram of such a separation is shown in Fig. 49. Variations in pH and buffer concentration are not critical for fractionation. Chromatography is carried out at room Temperature without prior equilibration. A layer of buffer solution approximately 1 cm high is poured into the chamber. During chromatography, the buffer front should rise to a height of 15 cm. If the plate is not pre-equilibrated, this takes about 2 hours. On an equilibrated plate (see equilibration buffer solution, Table 10), this process takes only a few minutes. The separation of aromatic and basic amino acids clearly demonstrates the high resolving power of thin-layer Ion-exchange chromatography compared to the corresponding column technique. It is known that on a small column using the same buffer solution (i.e., 0.35 M Na+, pH 5.23), aromatic acids are not resolved from each other.
Class="center">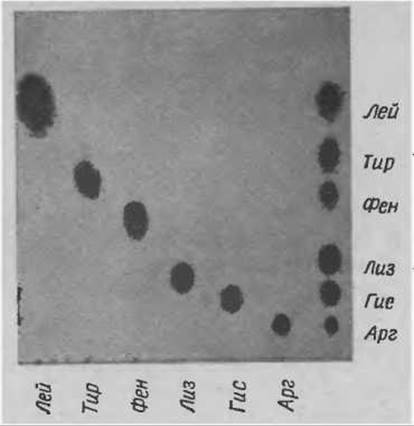
Fig. 49. Separation of basic and aromatic amino acids on a Fixion 50x8 plate.
Table 10 Preparation of Buffer solutions
Equilibration buffer solution |
A |
B |
C |
D |
E |
F |
G |
|
pH |
3.28 |
3.28 |
3.3 |
5.23 |
4.25 |
6.0 |
4.25 |
6.0 |
Na+ concentration, M |
0.02 |
0.2 |
0.4 |
0.35 |
0.4 |
1.5 |
0.8 |
1.5 |
Citrate concentration, M |
0.0067 |
0.067 |
0.4 |
0.177 |
0.067 |
0.03 |
0.067 |
0.03 |
Citric acid x H2O, g |
1.4 |
14.1 |
84.0 |
24.6 |
14.1 |
7.0 |
14.1 |
7.0 |
NaOH, g |
0.8 |
8.0 |
16.0 |
14.0 |
8.0 |
4.0 |
8.0 |
4.0 |
NaCl, g |
— |
— |
— |
— |
11.7 |
81.9 |
35.0 |
81.9 |
37% HCl (sp. gr. 1.19), mL |
1.2 |
12.3 |
5.9 |
6.5 |
8.4 |
— |
8.4 |
— |
Glycerol, mL |
— |
100 |
— |
— |
— |
— |
— |
— |
Methyl cellosolve, mL |
— |
— |
— |
— |
100 |
— |
— |
|
Final volume, mL |
1000 |
1000 |
1000 |
1000 |
1000 |
1000 |
1000 |
1000 |
Good separation can be achieved by chromatography in a volatile pyridine–acetic acid buffer system (pH 5) prepared in deionized Water by mixing 40 mL of acetic acid and 40 mL of pyridine and bringing the final volume to 1000 mL. In this buffer system, unlike the citrate buffer, Tyr and Phe swap places (Fig. 50), and the amino acids migrate from the origin toward the solvent front in the following order: Arg, His, Lys, Tyr, Phe.
The separation of basic and aromatic amino acids is of great importance in agricultural research and clinical practice.
DETERMINATION OF Lysine CONTENT IN MASS AGRICULTURAL ANALYSES
The determination of Lys is necessary, for example, in plant breeding, feed evaluation, etc. The Procedure for handling A large number of samples is as follows [8].
The test samples (e.g., grains) are hydrolyzed for 40 h at 105 °C under a nitrogen atmosphere in 6 N HCl. Aliquots with equivalent nitrogen content are taken from each sample. Our experience shows that the best results are obtained with samples containing approximately 8–10 mg of nitrogen, although this also depends on the average Lys content (or that of another amino acid, such as Met) in the given sample. Nitrogen-equimolar aliquots from each sample are applied directly to the plate as a band. If a sample contains, say, 8 mg of nitrogen, it is optimal to apply 10 µL of the solution in a 1-cm band to obtain a satisfactory spot evaluation, given the average Lys content.
Following the application of hydrolysate bands, control mixtures are applied in parallel. For better identification, it is advisable to spot several samples with a known Lys content onto the plate. For instance, if the average amount of Lys in a 1-cm band is 0.5 µg (based on the sample weight and application volume), amounts of 0.25, 0.5, and 0.75 µg of Lys should be applied to the plate. By comparing the test samples with the controls, all samples can be categorized into 3 types with low, medium, and high Lys content. Based on these data, samples suitable for quantitative analysis are selected. Since the concentrations of all Other Amino Acids are relatively high compared to that of Lys, it is recommended to run the chromatography at least until the buffer front reaches a height of 17–18 cm. The Met content in samples can be determined in the same manner. A typical separation pattern is shown in Fig. 50.
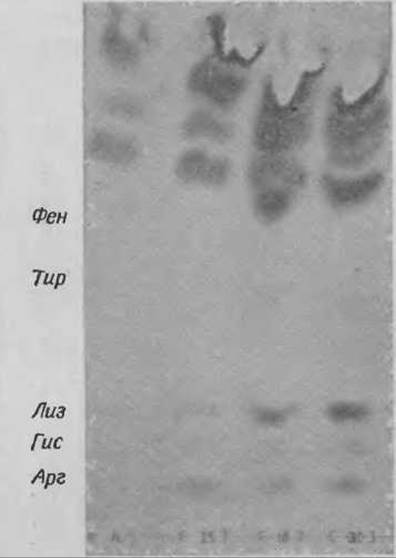
Fig. 50. Determination of lysine in plant protein hydrolysates on a Fixion 50x8 plate.
SEPARATION OF AROMATIC AND BASIC AMINO ACIDS IN CLINICAL PRACTICE
This method is applicable for the early detection of Amino acid METABOLISM disorders in newborns. These inherited metabolic defects manifest as the accumulation of specific amino acids in Blood and urine. Among amino acid disorders, phenylketonuria is the most common, characterized by the accumulation of Phe in the blood. In addition, there are disorders associated with the accumulation of Lys, His, and Tyr, as well as other less specific abnormalities. For instance, cystinuria is characterized not only by elevated cystine levels, but also by the accumulation of homocystine.
One of the advantages of thin-layer ion-exchange chromatography is that it provides a simple and accessible method for the early detection of nearly all inherited amino acid Metabolic Disorders. We have developed two Procedures for mass screening.
CHROMATOGRAPHY OF AROMATIC AND BASIC AMINO ACIDS IN HEPARINIZED BLOOD [3]
A 50 µL sample of heparinized blood is placed in a small centrifuge tube, and 1/3 volume of trichloroacetic acid (TCA) is added. After centrifugation, 20 µL of the supernatant is applied to a Fixion 50 x 8 plate and chromatographed twice alongside control mixtures spotted on both sides of the test sample. To remove TCA, the plate is first developed in 0.01 N HCl until the solvent front advances 18 cm. On the strongly acidic cation-exchange plate, TCA is not bound and migrates with the solvent front, whereas Most amino acids—primarily aromatic and basic ones—are retained. The plate is dried with a Hair dryer and then developed in a sodium citrate buffer solution (pH 5.23; buffer B, Table 10). A typical chromatogram is shown in Fig. 51.
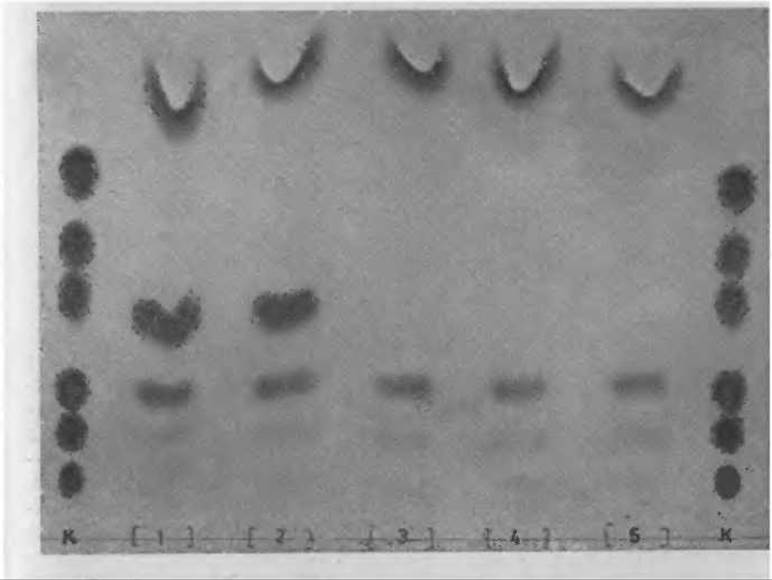
Fig. 51. Chromatogram of Blood Plasma supernatant after trichloroacetic acid Treatment.
C – control amino acid mixture (with successively increasing Rf values): Arg, His, Lys, Phe, Tyr, Leu; 1, 2 – plasma samples from a phenylketonuria patient; 3, 4, 5 – plasma samples from a healthy individual.
DETERMINATION OF FREE AMINO ACIDS IN BLOOD SAMPLES DRIED ON FILTER PAPER [7]
A single drop of blood (approximately 50 µL) is applied to fine filter paper and allowed to dry at room temperature; the blood spot should be about 15 mm in diameter. Using a punch, 5–6 disks of approximately 5 mm in diameter are cut out from the spot and placed into a Wassermann tube, to which 0.1 mL of a 0.1 N HCl solution in 95% ethanol is added. The tubes are sealed with Parafilm and left overnight at room temperature. The next day, the samples are applied to Fixion 50 x 8 plates at 10–15 µL per spot. Due to the presence of alcohol in the solution, Sample application is facilitated and proceeds quite quickly with the aid of a hair dryer. Following application, chromatography is performed in a nitrate (or alternative) buffer solution at pH 5.23. A typical fractionation pattern is shown in Fig. 52.
This approach is very convenient for blood sample analysis: blood collected from a finger or heel can be spotted directly onto filter paper and mailed. Acid-alcoholic elution in this case eliminates The Need for prior protein precipitation as well as repeat chromatography. At a lower pH and a higher Na+ concentration, basic components are fractionated into a larger number of peaks; for instance, Arg can be resolved from Lys [10]. For this purpose, buffer solution G (Table 10) with a Na+ concentration of 0.4 M and pH 4.25 is used.
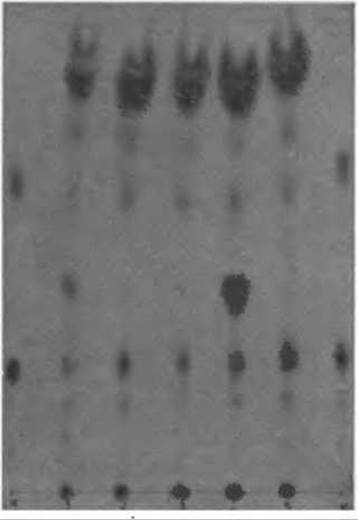
Fig. 52. Analysis of dried blood spot samples on filter paper for phenylketonuria Diagnosis.
C — control amino acid mixture of Apr, His, Lys, Phe, Tyr, Leu; 1, 4 — blood of a patient with phenylketonuria; 2, 3, 5 — blood of a healthy individual.
ONE-DIMENSIONAL AMINO ACID SEPARATION [4]
Using thin-layer ion-exchange chromatography, 16 amino acids present in a protein hydrolysate can be separated using just a single buffer solution. In buffer solution B (Table 10), which has a relatively high citrate ion concentration, the mixture of 16 amino acids is resolved into 15 components. This separation pattern is shown in Fig. 53. Of the 16 amino acids, only Thr and Ser fail to resolve.
Approximately 0.5 µg of the test and control material (either an amino acid mixture or individual amino acids) is spotted onto the equilibrated plate. A thoroughly washed chromatography chamber is filled with buffer solution to a depth of 1 cm, sealed, and placed in an air incubator (45°C) for 15 min. The lower edge of the plate is immersed in the preheated buffer solution, and chromatography is carried out, allowing the solvent front to rise to a height of 18 cm (approx. 3.5 h). After drying, the chromatogram is visualized using a collidine-ninhydrin reagent. Fractionation is highly sensitive to pH and temperature fluctuations. An increase in pH by 0.1–0.2 units leads to a sharp increase in Rf, which can improve separation in the lower part of the chromatogram—where basic and aromatic amino acids migrate (Leu, Ile, Met, and Val)—whereas separation in the upper part of the chromatogram, where amino acids from Ala to Asp migrate, is impaired.
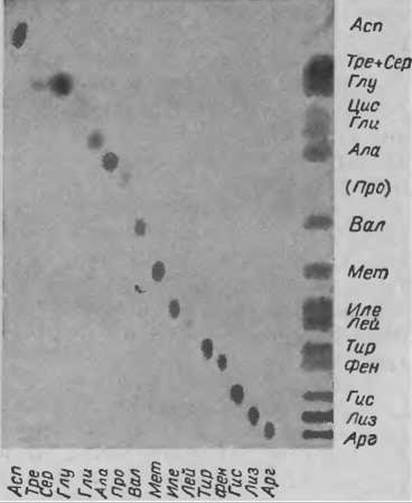
Fig. 53. Separation of amino acids on a “Fixion 5Gx8” plate.
One-dimensional thin-layer ion-exchange chromatography yields Rf values for amino acids very similar to those obtained from an amino acid analyzer. The separation of amino acids from Asp to Ala in the analyzer is likewise sensitive to changes in pH and buffer molarity, deteriorating as the pH increases. At the same time, the separation of amino acids from Val onward becomes insensitive to changes in pH and molarity.
Consequently, if, for example during Thin-Layer Chromatography, the basic and neutral amino acids up to Val exhibit unusually high Rf values while separation in the upper part of the plate remains incomplete, it can be concluded that the pH of the buffer solution exceeds 3.3. Unfortunately, most pH meters are not sufficiently reliable or precise, making it necessary to proceed as is customary in analyzer fractionation, where the buffer pH is checked against the “cystine position.” In thin-layer chromatography, the pH is similarly verified by the relative mobility of the components. Ideally, cystine locates between Ala and Val.
If the Rf value of Val is close to 0.5 and that of Asp is close to 0.9, but the latter has not yet reached the solvent front, the buffer pH is optimal. Temperature fluctuations primarily affect the separation of Met, Ile, and Leu. At 45–509C, the separation of these Three amino acids is satisfactory and highly reproducible. As the temperature drops, the separation deteriorates, and at temperatures below 40°C, the amino acids fail to separate altogether. Apparently, 45°C is the optimal temperature because, on the one hand, complete resolution of these three amino acids is achieved, and on the other hand, at this temperature, there is still no need to add special substances (e.g., glycerol) to reduce buffer evaporation, which could otherwise interfere with separation in the upper part of the chromatogram.
It should be emphasized that thin-layer ion-exchange chromatography is unsuitable for the Quantitative determination of the Amino Acid Composition of protein hydrolysates, as it yields only a qualitative picture. However, this method is well suited for investigating peptide hydrolysates and peptide fragments during amino acid sequencing. It allows the molar Proportions of the detected amino acids to be determined—usually relative to a specific reference amino acid. If, for example, a tryptic hydrolysate is being analyzed, Lys or Apr serves as such a reference standard. As a rule, evaluations are performed visually or using a densitometer. This method can determine component ratios within 4- to 5-fold differences (e.g., molar ratios in the peptide Lys1Val2Glu2Thr3). At smaller differences in relative molar amino acid concentrations, the method loses sensitivity. This precludes its use for analyzing Proteins where these differences can be very small (e.g., Lys10Asp55Val48Glu49 ... etc.).
ION-EXCHANGE THIN-LAYER CHROMATOGRAPHY OF ENZYMATIC HYDROLYSATES [11, 12]
Enzymatic Hydrolysis can be performed in various ways, one of which is as follows: two rows of wells are drilled into a plastic plate 10–15 mm thick, 10 cm long, and 5 cm wide. The volume of all wells except one should be approximately 50 µl, with the top corner well being 3 times larger. This well acts as the reaction vessel; let us designate it as R, and all the others by the numbers 1, 2, 3...n. The test peptide (approx. 0.05 µmol) in 0.1 M ammonium bicarbonate is pipetted into well R. All other wells are filled with 10 µl of 1 N HCl each. Next, the appropriate enzyme is added to well R (e.g., Carboxypeptidase A, carboxypeptidase B, or a mixture thereof, or aminopeptidase in the case of N-terminal analysis). The amount of enzyme is 1/20 of the amount of peptide. Immediately after adding the enzyme, 10 µl of the mixture from the “reaction vessel” is transferred to well 1, which already contains HCl.
The plate is covered with Parafilm (or a Glass plate) and placed in an air incubator at 37°C. At predetermined time intervals (preferably 30, 60, 90, 120 min), samples are withdrawn from well R and transferred to wells 2, 3, 4... etc. In this way, The kinetics of the hydrolysis taking place in well R can be monitored. Upon completion of the reaction, the Contents of the wells are transferred to a “Fixion 50 x 8” plate, which is also spotted with a control mixture. Chromatography is performed in a buffer solution of pH 3.3 at 45°C. The developed plate effectively displays the kinetics of hydrolysis. Material taken at THE START OF hydrolysis (zero time point — well 1) is compared with hydrolysates taken at 30 (well 2), 60 (well 3), 90 (well 4), and 120 min (well 5). In practice, this micromethod allows The sequence of 3–5 amino acid residues in an 8- to 10-membered peptide to be reliably determined within 2 hours. Experimental conditions—Enzyme-to-substrate ratio, incubation time, and sampling times—can be varied depending on The Nature of the substrate and the objective of the analysis.
Quantitative determinations are performed using Methods common in conventional thin-layer chromatography. Chromatograms on “Fixion” plates are densitomettred in the exact same manner as on other Supports (Cellulose, silica gel). If for any reason (lack of equipment, instability of the color reaction, etc.) this is not feasible, the corresponding zones can be eluted. Because the cation-exchange resin exhibits strong sorption, care must be taken to ensure that the elution solution has a pH of 6 or higher. If semi-quantitative methods used in conventional thin-layer chromatography yield unsatisfactory results, a corresponding quantitative method using an analyzer should be employed. To determine the complete amino acid composition, it is advisable to use a single-column dual-buffer [1] or triple-buffer [2] method (see Chapter VI).
DETERMINATION OF Methionine AND LYSINE CONTENT IN PLANT AND ANIMAL-DERIVED SAMPLES [8]
In plant breeding and feed evaluation work, knowing the amounts of Lys and Met is particularly important. It is not strictly necessary to perform quantitative analyses on a huge number of samples. Preliminary screening based on approximate data provides sufficient information on which specific samples warrant a full quantitative analysis.
To determine Met in natural substances, hydrolysates obtained by the method described above can be used. They typically contain significantly larger amounts of Lys than Met. Consequently, in a sample with a low Met content, it is quite difficult to quantitatively determine both amino acids on a single plate. It is advisable to analyze Lys and Met from the same hydrolysate using two plates.
Hydrolysis is carried out According to the previously described procedure. Without removing the acid, 20 µl of the hydrolysate is applied as a 1 cm wide band (if the sample contains 8 mg of nitrogen in 2 ml of 6 N HCl) onto an equilibrated “Fixion 50 x 8” plate and dried with a hair dryer. Chromatography is performed in buffer solution A (Table 10), which is the analyzer's first buffer solution, but additionally containing 10% glycerol. It is recommended to chromatograph at 45°C and allow the solvent front to reach the upper edge of the plate. If the Met content in the sample is very low, the plate should be progressively immersed deeper into the solvent and subjected to descending chromatography using filter paper, as done during equilibration. In doing so, components with high mobility are eluted from the plate, facilitating the separation of Met from Val, Leu, and Ile, which are likely present in the mixture in much greater amounts than Met. The chromatogram is visualized with cadmium-ninhydrin at 45°C or at room temperature. The chromatographic separation pattern is shown in Fig. 54.
For quantitative evaluation, any standard Thin-Layer Chromatography Method can be applied: densitometry, elution, etc. If highly accurate determinations of Lys and Met content are required, short rapid programs for amino acid analyzers [3] can be utilized (see Chapter VI).
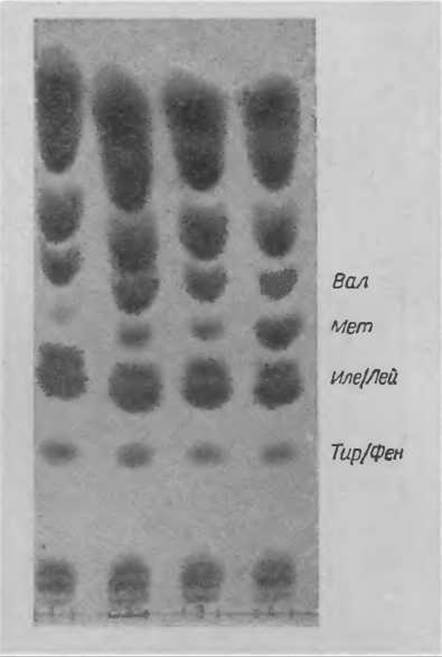
Fig. 54. Determination of methionine in plant protein hydrolysates.
1 — low Met content; 2, 3 — medium Met content; 4 — high Met content.
Determination of Tryptophan IN ALKALINE HYDROLYSATE [5]
Trp cannot be determined in an acid hydrolysate, as it is completely decomposed under these conditions. In principle, two methods exist for determining Trp: a specific qualitative color reaction in an alkaline hydrolysate and spectrophotometry of Trp in the initial solution. Both methods have their drawbacks: the color reaction in an alkaline hydrolysate is not strictly specific because the hydrolysate contains numerous impurities, whereas the spectrophotometric approach is applicable only when the substance dissolves completely to form a clear solution, or when the mixture is free of components (such as Coenzymes) that absorb at the given wavelength. Classical thin-layer or paper chromatography methods do not allow for the reliable determination of Trp due to the high salt concentration in the neutralized hydrolysate. Thin-layer ion-exchange chromatography successfully overcomes this difficulty, as the high salt content does not interfere with the separation.
HYDROLYSIS
Hydrolysis is carried out as follows: approximately 5 mg of the peptide or protein is dissolved in an ampoule containing 2 mL of 2 N NaOH, the ampoule is purged with nitrogen and sealed. Hydrolysis is performed for 5 h at 105 °C. After cooling, 3 mL of buffer solution A and 1 mL of concentrated HCl are added.
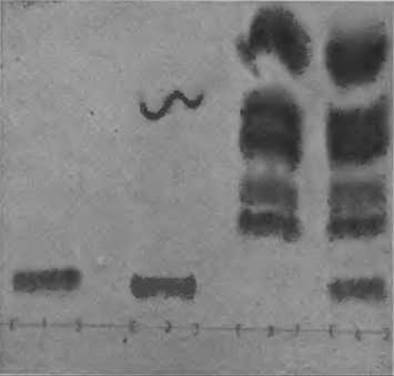
Fig. 55. Determination of tryptophan on a “Fixion 50 x 8” plate.
1 — acetyltryptophan; 2 — glycyltryptophan hydrolysate; 3 — hydrolysate of a peptide lacking Trp; 4 — hydrolysate of a peptide containing Trp.
CHROMATOGRAPHY
For separation, buffer solution D (Table 10) containing 10% methylcellosolve (the third buffer solution of the single-column system) is used. A typical chromatogram is shown in Fig. 55.
At a relatively high pH [6] and a Na+ concentration of 1.5 M, Trp exhibits the lowest value. When chromatographing an alkaline peptide hydrolysate, a solvent front advance of 8–10 cm is sufficient to obtain a clear resolution. If a quantitative determination of Trp is required, one can resort to the procedure developed for the analyzer (rapid program):
Column resin height |
14 cm |
Buffer solution |
D (Table 10) |
Buffer flow rate |
100 mL/h |
Ninhydrin flow rate |
50 mL/h |
Temperature |
55 °C |
Buffer pressure |
8–12 atm |
DETERMINATION OF RACEMIZATION IN Peptide Synthesis [3]
In peptide synthesis, it is sometimes necessary to quantitatively assess the racemization that occurs as the reaction proceeds. This is of particular importance in complex multistep syntheses where The conversion of specific intermediates is a critical stage in The formation of the final product. To detect racemization, Japanese researchers developed an ingenious method that can be widely applied at various stages of peptide synthesis. Its essence is as follows. Under appropriate reaction conditions during synthesis, the dipeptide Gly-L-Ala interacts with L-Leu. Ideally, the reaction product is exclusively Gly-L-Ala-L-Leu. However, if racemization takes place, the tripeptide Gly-D-Ala-L-Leu will appear in the reaction mixture alongside this product. To detect and quantify these two tripeptides, the Japanese authors used an amino acid analyzer. However, the method they developed is not suitable for analyzing large numbers of samples, since, accounting for the regeneration time, approximately 3.5 h are required to analyze a single sample.
On the “Fixion 50x8” plate, the tripeptide isomers Gly-L-Ala-L-Leu and Gly-D-Ala-L-Leu are separated quite well. The degree of racemization of the preparation can be estimated from the staining intensity of the separated peptide spots. Chromatography is performed on pre-equilibrated plates in buffer solution E (Table 10), i.e., the second buffer solution of the single-column analyzer system. To achieve optimal separation, 10 µL of the sample solution in 0.01 N HCl (peptide concentration 10 mg/mL) is applied to the plate. Chromatography is carried out at room temperature up to a height of 12–15 cm. If it is necessary to quantitatively determine the degree of racemization (with an accuracy of 5–10%), thin-layer chromatogram densitometry is employed. To obtain more precise results, it is advisable to use an automatic analyzer.
Last update: 06/08/2026
Editorial and Educational Adaptation: This material has been compiled based on the primary/original source text. The project team performed an editorial review, corrected technical inaccuracies, structured sections, and adapted the content for an educational format.
What was processed:
- elimination of formatting defects (OCR errors, structural breaks, corrupted characters);
- editorial organization of content;
- standardization of terminology in accordance with academic sources;
- verification of factual statements against the original source text.
All mentions of the author, publication year, and origin of the primary text have been preserved in accordance with the source.