LEHNINGER PRINCIPLES OF BIOCHEMISTRY - VOL. 2. BIOENERGETICS AND METABOLISM - 2014
PART II. BIOENERGETICS AND METABOLISM
23. HORMONAL REGULATION AND METABOLIC INTEGRATION IN MAMMALS
23.2. Tissue-Specific Metabolism: Division of Labor
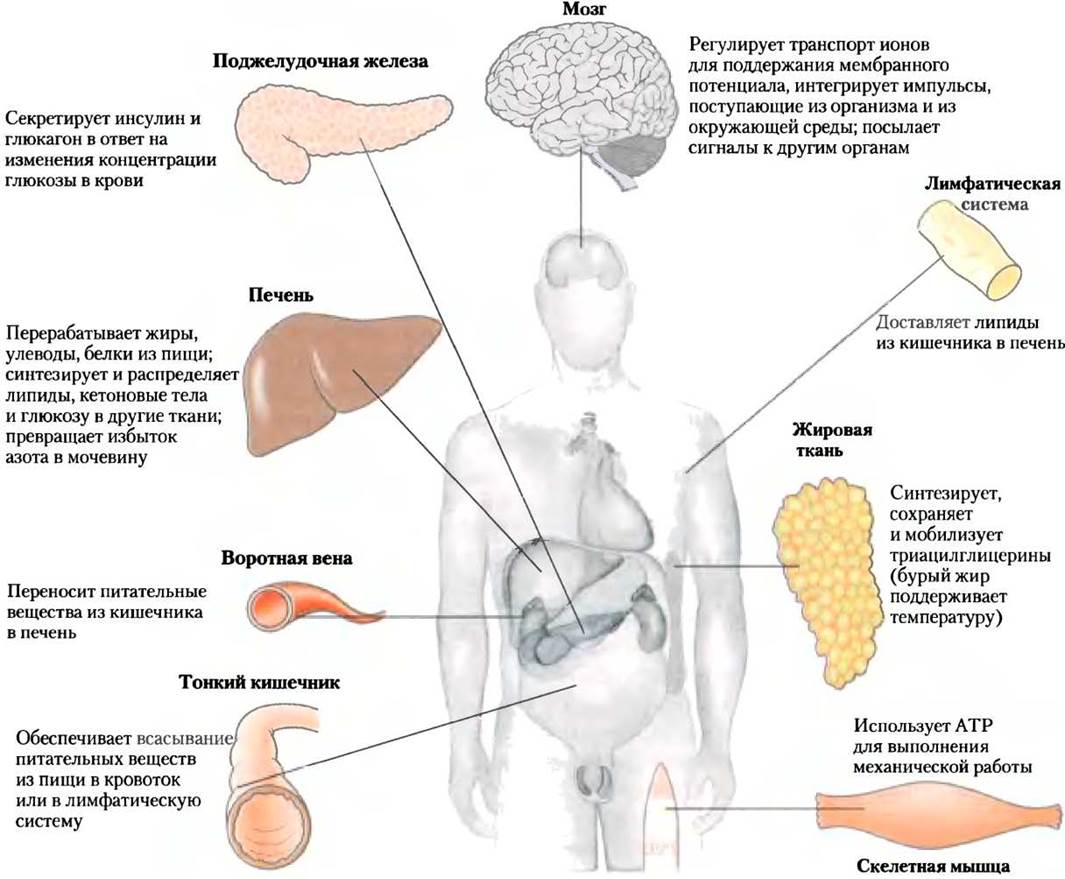
Each tissue in The Human Body possesses specialized Functions, which are reflected in its anatomy and metabolic activity (Fig. 23-12). Skeletal Muscles generate directed movement; adipose tissue stores and releases energy in the form of fats, which serve as fuel for the entire body; Brain Cells transport ions to generate electrical signals. The Liver plays a central Processing and distributing role in METABOLISM, supplying all other Organs and Tissues with the necessary mixture of nutrients via the bloodstream. The central functional role of the liver is confirmed by its interconnections with all other extrahepatic, or peripheral, tissues and organs. Therefore, our Structure/133.html">Discussion of the division of metabolic functions will begin with the transformations of CARBOHYDRATES, Amino Acids, and fats in the mammalian liver. Next, we will examine and briefly characterize the primary metabolic functions of adipose, Muscle, and brain tissues, as well as Blood—the mediator among all Tissues of the Organism.
Class="center">Fig. 23-12. Specialized metabolic functions of mammalian tissues.
Processes in The Liver and Nutrient Distribution
In mammals, during Digestion, the three Major Classes of nutrients (carbohydrates, Proteins, and fats) undergo Enzymatic Hydrolysis, breaking them down into less complex compounds. This breakdown is necessary because only relatively small molecules can be absorbed through the epithelial cells lining the intestinal walls. Many Fatty acids and monoacylglycerols released during fat DIGESTION IN THE intestine are converted back into triacylglycerols within the epithelial cells.
After the bulk of sugars and amino acids has been absorbed, and a portion of the triacylglycerols has been transported via the bloodstream to the liver, the remaining triacylglycerols enter the adipose tissue via The Lymphatic system. The HEPATIC PORTAL VEIN serves as the gateway from the Digestive System to the liver. This is why the liver is the very first organ reached by all dietary nutrients along their
path. The liver contains primarily two Cell types. Kupffer cells are phagocytes that perform an immune function. However, we are currently more interested in hepatocytes. They convert dietary nutrients into fuel molecules and biosynthetic precursors required by other tissues, releasing them into the blood. The diversity and quantity of nutrients arriving at the liver vary depending on several factors, including diet and the time between meals. The energy and precursor molecule requirements of various organs and tissues also differ based on an individual's activity level and constitution.
To accommodate these constantly changing parameters, the liver exhibits considerable metabolic plasticity. For example, on a high-protein diet, the levels of Enzymes for Amino Acid Breakdown and Gluconeogenesis in hepatocytes become very high. If the diet is rich in carbohydrates, the concentrations of these enzymes begin to drop within a matter of hours, while hepatocytes increase The production of enzymes required for Carbohydrate Metabolism and fat synthesis. The turnover rate of liver enzymes (their Synthesis and degradation) is 5 to 10 times higher than the enzymatic turnover rate in other tissues, such as muscle. Extrahepatic tissues can also adapt their metabolism to current conditions, but our body contains no organ more adaptable than the liver, nor one that plays such a crucial role in overall metabolism. Next, we will examine the potential Metabolic pathways of sugars, amino acids, and Lipids brought to the liver by the bloodstream. To visualize these metabolic conversions, the main pathways and processes are summarized in Table 23-2, which also provides the figure numbers where each pathway is presented in detail. Here, we merely summarize the data on these pathways, indicating the stage number in Figs. 23-13–23-15.
Table 23-2. Metabolic Pathways of Carbohydrates, Amino Acids, and Fats Discussed in Previous Chapters
Pathway |
Figure Number |
Citric Acid Cycle: acetyl-CoA —> 2 CO2 |
16-7 |
Oxidative Phosphorylation: ATP synthesis |
19-20 |
Glycogenolysis: Glycogen —> glucose 1-phosphate —> blood glucose |
15-25; 15-26 |
Incorporation of hexoses into Glycolysis: fructose, mannose, galactose —> glucose 6-phosphate |
14-10 |
Glycolysis: glucose —> Pyruvate |
14-2 |
Pyruvate dehydrogenase reaction: pyruvate —> acetyl-CoA |
16-2 |
Lactic acid Fermentation: glucose —> lactate + ATP |
14-3 |
Pentose Phosphate Pathway: glucose 6-phosphate —> pentose phosphates + NADPH |
14-21 |
Carbohydrate anabolism |
|
Gluconeogenesis: citric acid cycle intermediates —> glucose |
14-16 |
Glucose-Alanine cycle: glucose —> pyruvate —> alanine —> glucose |
18-9 |
Glycogen synthesis: glucose 6-phosphate —> glucose 1-phosphate —> glycogen |
15-30 |
Amino acid degradation: amino acids —> acetyl-CoA, citric acid cycle intermediates |
18-15 |
22-9 |
|
Urea Cycle: NH3 —> urea |
18-10 |
Glucose-alanine cycle: alanine —> glucose |
18-9 |
Nucleotide synthesis: amino acids —> Purines, Pyrimidines |
22-33; 22-36 |
Hormone and neurotransmitter synthesis |
22-29 |
Fat catabolism |
|
β-Oxidation of Fatty acids: fatty acids —> acetyl-CoA |
17-8 |
Ketone body oxidation: β-hydroxybutyrate —> acetyl-CoA —> CO2 in The Citric Acid Cycle |
17-19 |
Fat anabolism |
|
Fatty acid synthesis: acetyl-CoA —> fatty acids |
21-6 |
Triacylglycerol synthesis: acetyl-CoA —> fatty acids —> triacylglycerols |
21-18; 21-19 |
Ketogenesis: acetyl-CoA —> acetoacetate, β-hydroxybutyrate |
17-18 |
Cholesterol and cholesteryl ester synthesis: acetyl-CoA —> cholesterol —> cholesteryl esters |
21-33–21-37 |
Phospholipid synthesis: fatty acids —> Phospholipids |
21-17; 21-23–21-28 |
Sugars. The glucose transporter in hepatocytes (GLUT2) is so efficient that it maintains nearly the same glucose concentration inside the hepatocyte as in the blood. Glucose entering the hepatocyte is phosphorylated by hexokinase IV (glucokinase) to glucose 6-phosphate. Glucokinase has such a high Km (mM) that it is not inhibited by its reaction product, glucose 6-phosphate, which successfully suppresses hexokinase isozymes in other cells (p. 141). In the presence of glucokinase, hepatocytes continue to phosphorylate glucose even when the glucose concentration rises to levels that would have long since inhibited The activity of other hexokinases. The high Km of glucokinase also ensures glucose phosphorylation at very low glucose concentrations within hepatocytes, preventing the liver itself from consuming all the glucose and using it in glycolysis. Thus, glucose is conserved for other tissues. Fructose, galactose, and mannose, which are absorbed in the Small Intestine, are also converted into glucose 6-phosphate via the enzymatic pathways discussed in Chapter 14. Glucose 6-phosphate is a key molecule in several carbohydrate metabolism pathways in the liver (Fig. 23-13), and the specific metabolic pathway is chosen depending on the organism's current needs. Through various allosterically regulated enzymes and via Hormonal Regulation of enzyme synthesis and activity, the liver directs the flux of glucose along one or more of these pathways.
Fig. 23-13. Metabolic PATHWAYS OF GLUCOSE 6-phosphate in the liver. Here and in Figures 23-14 and 23-15, anabolic pathways are indicated by upward arrows, Catabolic pathways by downward arrows, and pathways involving distribution to other organs by horizontal arrows. The processes are described in the text under their respective numbers.

(1) Glucose 6-phosphate is dephosphorylated by glucose 6-phosphatase to release free glucose (see Fig. 15-28), which then replenishes blood glucose levels. When glucose 6-phosphate reserves are limited, its export is prioritized because blood glucose must be maintained at a sufficiently high concentration (~4 mM) to provide the brain and other tissues with adequate energy. (2) Glucose 6-phosphate that is not immediately used to generate glucose for release into the blood is converted into liver glycogen or enters one of several other pathways. Subsequent breakdown of glucose 6-phosphate occurs via glycolysis and pyruvate decarboxylation (in the pyruvate dehydrogenase reaction); (3) the resulting acetyl-CoA can be oxidized to generate energy in the citric acid cycle, followed by electron transfer and oxidative phosphorylation, which synthesizes ATP. (However, fatty acids typically serve as the primary energy source in hepatocytes). (4) Acetyl-CoA can also serve as a precursor for fatty acids, which are incorporated into triacylglycerols, phospholipids, and cholesterol. The bulk of the lipids synthesized in the liver are transported to other tissues via the bloodstream as Lipoproteins. (5) Finally, glucose 6-phosphate can enter The pentose phosphate pathway, where it participates in the production of NADPH—required for Fatty acid and Cholesterol Biosynthesis—or in the production of D-ribose 5-phosphate, a precursor in nucleotide biosynthesis. Furthermore, NADPH plays an essential role in the detoxification and elimination of many drugs and xenobiotics metabolized by the liver.
Amino Acids. Amino acids entering the liver are channeled into several vital metabolic pathways (Fig. 23-14). (1) They serve as precursors for Protein Synthesis; this process is discussed in Chapter 27. The liver constantly renews its own proteins, which have a relatively high turnover rate (an average half-life of several days), and also synthesizes most Plasma Proteins. (2) Amino acids are transported via the bloodstream to other organs for use in tissue Protein Biosynthesis. (3) Other Amino Acids act as precursors in the Biosynthesis of NUCLEOTIDES, Hormones, and nitrogenous substances in the liver and other tissues.
Fig. 23-14. Amino acid metabolism in the liver.

(4a) Amino acids not utilized as biosynthetic precursors are transaminated or deaminated and broken down to form pyruvate and citric acid cycle intermediates (with various fates). (4b) The liberated ammonia is converted into urea, an excretory product. (5) Pyruvate is converted into glucose and glycogen via gluconeogenesis, or (6) it can be converted into acetyl-CoA, which also has several downstream metabolic fates. (7) It can be oxidized in the citric acid cycle and (8) generate ATP via oxidative phosphorylation, or (9) be converted into lipids for storage. (10) Citric acid cycle intermediates can be channeled into glucose synthesis via gluconeogenesis.
The liver also metabolizes amino acids arriving from other tissues. Glucose enters the blood immediately after the DIGESTION AND ABSORPTION of dietary carbohydrates or between meals through The conversion of liver glycogen into blood glucose. During intervals between meals, particularly extended ones, a portion of muscle protein is broken down into amino acids. These amino acids donate their amino groups (via Transamination reactions) to the glycolytic product pyruvate to form alanine, which (11) is transported to the liver and deaminated there. Hepatocytes convert the resulting pyruvate into blood glucose (via gluconeogenesis (5)) and the ammonia into urea for excretion from the body (4b). An important feature of this glucose-alanine cycle (Fig. 18-9) is buffering fluctuations in blood glucose levels between meals. In muscles, amino acid deficits are replenished after subsequent meals.
Lipids. Fatty acids entering hepatocytes as components of lipids also have several potential metabolic fates (Fig. 23-15). (1) Some are converted into liver lipids. (2) The majority of fatty acids in the liver are oxidized to release energy. Free fatty acids can be activated and oxidized to yield acetyl-CoA and NADPH. (3) Acetyl-CoA is subsequently oxidized in the citric acid cycle, and (4) the oxidation products participate in ATP synthesis via oxidative phosphorylation. (5) Excess acetyl-CoA (not utilized) is converted in the liver into acetoacetate and β-hydroxybutyrate; these Ketone Bodies enter the bloodstream and can be used as fuel by other tissues in the citric acid cycle. Ketone bodies can be considered a transport form of acetyl groups. In some extrahepatic tissues, they account for a significant portion of energy stored during prolonged starvation—up to 1/3 in The Heart and more than 60–70% in the brain. (6) A portion of the acetyl-CoA generated from fatty acids (and from glucose) is utilized for the Biosynthesis of Cholesterol, which is essential for membrane construction. Additionally, cholesterol serves as a precursor for all Steroid Hormones and Bile salts, which are necessary for Lipid Digestion and absorption.
Fig. 23-15. Fatty acid metabolism in the liver.
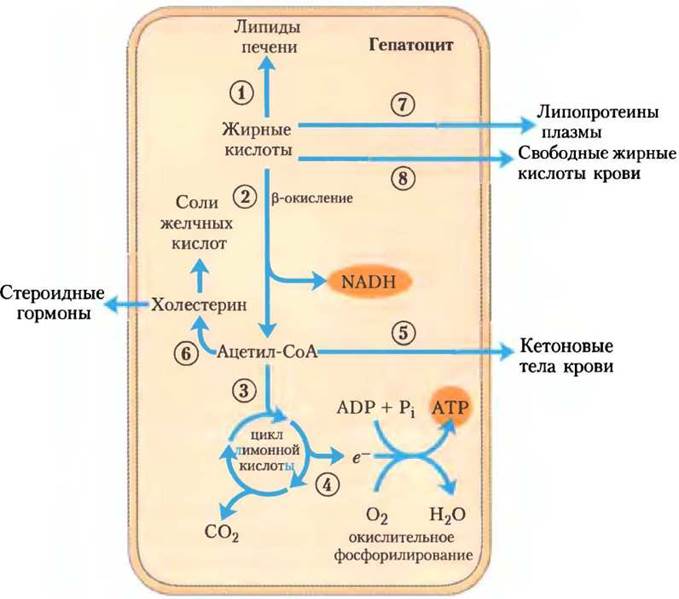
Two other lipid-converting pathways are utilized in specialized Mechanisms for the bloodstream transport of insoluble lipids. (7) Fatty acids are converted into blood lipoprotein phospholipids and triacylglycerols, which deliver lipids to adipose tissue for storage as triacylglycerols. (8) Some free fatty acids bind to serum albumin and are directed to the heart and skeletal muscles, where they are taken up and oxidized as a primary energy source. Serum albumin is the most abundant plasma protein, and a single molecule of it can transport up to 10 free fatty acid molecules.
Thus, the liver acts as a distribution center within the body, exporting nutrients in appropriate proportions to all organs, smoothing out fluctuations in substance concentrations between meals, and processing excess amino groups into urea and other products excreted via the Kidneys. The liver stores certain nutrients, including iron ions and vitamin A. In addition, the liver detoxifies foreign organic substances such as drugs, food additives, preservatives, and other potentially harmful compounds of no nutritional value. Detoxification often involves cytochrome P450-mediated hydroxylation of poorly soluble Organic compounds, rendering them more soluble and accessible for further degradative reactions and elimination from the body (see Box 21-1).
Adipose Tissue Stores and Supplies Fatty Acids
There are two types of adipose tissue—white and brown—which perform different functions in the body; we will first discuss the one present in the body in greater quantity. Cytology/practical/49.html">White adipose tissue (Fig. 23-16a) has an amorphous structure and is localized in various organs and body parts—in the Skin, around deep Blood Vessels, and in the abdominal region. The white adipose tissue adipocyte is a large, spherical cell (30 to 70 µm in diameter); it is almost entirely filled with a large fat (triacylglycerol) droplet that accounts for ~65% of The Cell mass and pushes the Mitochondria and Cell Nucleus into a narrow, fat-free space near The Plasma Membrane (Fig. 23-16b). In a healthy adult human, white adipose tissue accounts for about 15% of total body weight. Adipocytes are metabolically very active, rapidly responding to hormonal signals exchanged among the liver, skeletal muscles, and heart.
Fig. 23-16. Adipocytes of white and brown adipose tissue. (a) False-color scanning electron micrograph of human adipocytes in white adipose tissue. Within the adipose tissue, spherical adipocytes are surrounded by a network of capillaries and Collagen fibers. Almost the entire volume of these metabolically active cells is occupied by a fat droplet. (b) A typical white adipose tissue adipocyte, and (c) a typical brown adipose tissue adipocyte. In brown adipose tissue cells, mitochondria are much more prominent, The Nucleus is located near the center of the cell, and numerous distinct fat droplets are visible. White adipose tissue adipocytes are larger and contain a single large fat droplet that presses the mitochondria and nucleus against the plasma membrane.

Like other cell types, adipocytes actively perform glycolysis, use the citric acid cycle to oxidize pyruvate and fatty acids, and drive oxidative phosphorylation to completion. During high carbohydrate intake, adipose tissue can convert glucose (via pyruvate and acetyl-CoA) into fatty acids, convert fatty acids into triacylglycerols, and store them as large fat droplets, although in humans, fat synthesis occurs primarily in hepatocytes. Triacylglycerol stores in adipocytes are replenished from the liver (transported in the blood as VLDLs; see Fig. 21-40a) and from the intestinal tract (transported in chylomicrons), especially following a fat-rich meal.
When fuel molecules become scarce, lipases in adipocytes hydrolyze stored triacylglycerols into free fatty acids, which can be transported via the bloodstream to skeletal muscles and the heart. The release of fatty acids from adipocytes is greatly accelerated by epinephrine, which stimulates cAMP-dependent phosphorylation of perilipin, granting triacylglycerol lipase access to the triacylglycerols within lipid droplets. Epinephrine-sensitive lipase is also stimulated by phosphorylation, but this is not the main driver of increased lipolysis (see Fig. 17-3). Insulin counterbalances The Effect of epinephrine by reducing lipase activity.
The breakdown and synthesis of triacylglycerols in adipose tissue are linked in a substrate cycle; up to 70% of the fatty acids released by triacylglycerol lipase are re-esterified within adipocytes to form triacylglycerols. We previously encountered such a substrate cycle in Chapter 15; it allows for tight Regulation of the rate and direction of intermediate flux through this pathway in both directions. Glycerol released by triacylglycerol lipase in adipose tissue cannot be reused in triacylglycerol synthesis because adipocytes lack the enzyme glycerokinase. Instead, the glycerol phosphate required for triacylglycerol synthesis is generated from pyruvate via glyceroneogenesis, facilitated by the cytosolic enzyme PEPCK (see Fig. 21-22).
In addition to storing fuel molecules, adipose tissue plays a vital role as an endocrine organ, synthesizing and secreting hormones that communicate the status of energy reserves and coordinate lipid and carbohydrate metabolism throughout the body. We will return to this function of adipose tissue later when discussing the hormonal regulation of body weight.
Thermogenic Function of Brown Adipose Tissue
In small vertebrates and hibernating animals, a significant fraction of adipose tissue consists of brown fat; compared with white fat adipocytes, brown fat adipocytes are smaller (20 to 40 µm) and have a different shape (polygonal rather than spherical). Like white adipose tissue cells, brown adipose tissue adipocytes store triglycerides, but rather than in a single large fat droplet, they store them in multiple small fat droplets (Fig. 23-16c). Brown adipose tissue cells contain more mitochondria and have a richer blood supply than white adipose tissue cells. Cytochromes in the mitochondria and Hemoglobin in the capillaries give brown adipose tissue its characteristic color. A defining feature of brown adipose tissue adipocytes is the high level of expression of the *UCP1* Gene, which encodes *thermogenin*—a mitochondrial uncoupling protein (see Fig. 19-34). The primary function of brown adipose tissue cells—*thermogenesis*—is directly linked to the activity of thermogenin.
Fatty acids stored in the lipid droplets of brown adipose tissue adipocytes are released and enter the mitochondria, where they undergo complete conversion to CO2 via β-oxidation and the citric acid cycle. The resulting reduced FADH2 and NADH transfer electrons down the Respiratory Chain to molecular oxygen. In white adipose tissue, protons pumped out of the mitochondria during electron transport re-enter the matrix via ATP synthase, and the energy from electron transfer is captured in the form of ATP. Thermogenin, present in brown adipose tissue, provides an alternative route for protons to return to the matrix—bypassing ATP synthase. In this case, the energy of the proton gradient is dissipated as heat, helping maintain optimal body Temperature (particularly for The Nervous system and Internal Organs) when ambient temperatures drop.
In the human fetus, the differentiation of preadipocytes (minimally differentiated fibroblasts) into brown adipose tissue cells begins at the 20th week of gestation, and at birth, brown adipose tissue cells account for 1% of the newborn's body weight. Deposits of brown adipose tissue form where the heat generated by thermogenesis is necessary to sustain the functions of vital tissues (major HEAD vessels, key abdominal blood vessels, as well as the Pancreas, Adrenal Glands, and kidneys), which is critical when a newborn transitions to an environment colder than the mother's body (Fig. 23-17).
Fig. 23-17. Distribution of brown adipose tissue in a newborn. Brown Adipose tissue is distributed throughout the newborn's body as shown here, as it protects major blood vessels and vital internal organs from cooling. Over time, brown adipose tissue disappears; adult humans lack large reserves of brown adipocytes.

After birth, white adipose tissue begins to develop in the infant, while brown adipose tissue gradually disappears. Defined deposits of brown adipose tissue are absent in adult humans, though isolated brown adipocytes remain interspersed within white adipose tissue, accounting in total for only ~1% of all body adipocytes. Furthermore, adults possess preadipocytes that can differentiate into brown adipose tissue adipocytes during prolonged cold adaptation. Patients with pheochromocytoma (an Adrenal gland tumor) produce elevated levels of epinephrine and norepinephrine, which, among other effects, causes preadipocytes to differentiate into brown adipose tissue adipocytes, localizing in a pattern similar to that seen in newborns. The nuclear Transcription factor PPARγ, discussed below, plays a key role in cold adaptation and the normal differentiation of white and brown adipocyte cells.
Muscles Use ATP for Mechanical Work
In Skeletal Muscle cells, or myocytes, metabolism is specialized for generating ATP as an energy source for Muscle contraction. Furthermore, skeletal muscles are adapted to perform mechanical work under varying conditions. When necessary, a skeletal muscle can operate at peak power for a short duration, such as during a 100-meter sprint, or perform more prolonged work, such as running a marathon.
There are Two Types of Muscle tissue, which differ in physiological role and Energy Metabolism. Slow-twitch muscle fibers, also known as red muscles, produce relatively weak contractions but are highly fatigue-resistant. They generate ATP through the slow but steady process of oxidative phosphorylation. Red muscles are exceptionally rich in mitochondria and are served by a very dense network of capillaries that supply the oxygen required for ATP synthesis. The characteristic red color of this tissue is imparted by mitochondrial cytochromes and blood hemoglobin. Fast-twitch muscle fibers, or white muscles, contain fewer mitochondria than red muscles and have a less extensive blood supply, but they can generate greater force much more quickly. White muscles fatigue faster because they consume ATP during active work more rapidly than they can replenish its stores. The proportion of red and white muscle in humans is largely individual and genetically determined; however, endurance in fast-twitch muscles can be improved through training.
Depending on muscle activity, skeletal muscles can utilize free fatty acids, ketone bodies, or glucose for energy (Fig. 23-18). At rest, they predominantly consume free fatty acids from adipose tissue and ketone bodies from the liver. These are oxidized and broken down to yield acetyl-CoA, which enters the citric acid cycle for oxidation to CO2. Subsequent electron transfer to O2 provides energy for ATP synthesis via oxidative phosphorylation. During moderate activity, muscles utilize blood glucose alongside fatty acids and ketone bodies. Glucose is phosphorylated, then broken down via glycolysis to pyruvate, which is converted to acetyl-CoA and oxidized in the citric acid cycle and oxidative phosphorylation.
Fig. 23-18. Energy Sources for muscle contraction. Various fuel types are utilized for ATP synthesis during peak physical exertion versus low activity or rest. Phosphocreatine can rapidly regenerate ATP.
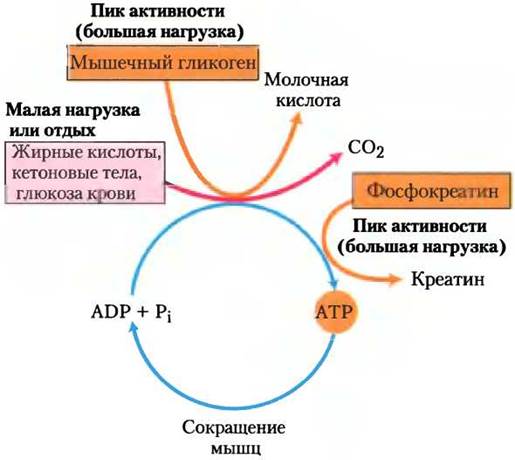
During maximal activity of fast skeletal muscles, their demand for ATP is so high that blood flow cannot keep up with the rapid delivery of O2 and energy substrates. Adequate ATP supply can only be sustained via anaerobic glycolysis alongside aerobic Respiration. Under these conditions, glycogen stored in muscles is enzymatically broken down to lactate (p. 69). Each glucose unit yields three molecules of ATP upon Cleavage, and because glycogen phosphorolysis produces glucose-6-phosphate (via glucose-1-phosphate), this spares the ATP normally consumed in the hexokinase reaction. The enzymatic pathway of lactic acid production responds to increased muscle ATP demands faster than oxidative phosphorylation. This pathway maintains the necessary ATP levels supplemented by aerobic phosphorylation of other energy substrates in the citric acid cycle and respiratory chain. The Use of blood glucose and muscle glycogen as energy sources for muscle activity is significantly enhanced by epinephrine secretion, which stimulates glucose release from liver glycogen and glycogen breakdown in muscle tissue.
The relatively small glycogen content in the body (about 1% of total skeletal muscle mass) limits The amount of energy that glycolysis can provide during maximal physical exertion. Moreover, lactate accumulation and the subsequent drop in pH in maximally active muscles reduce the efficiency of glycolysis. However, skeletal muscle has another source of ATP: phosphocreatine (10–30 mM), which can rapidly regenerate ATP from ADP via the creatine kinase reaction:
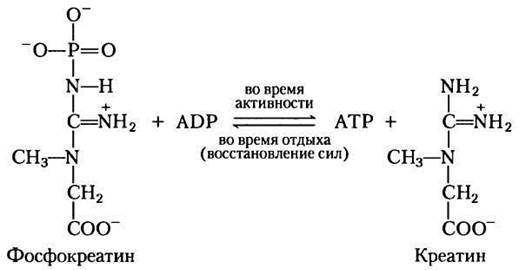
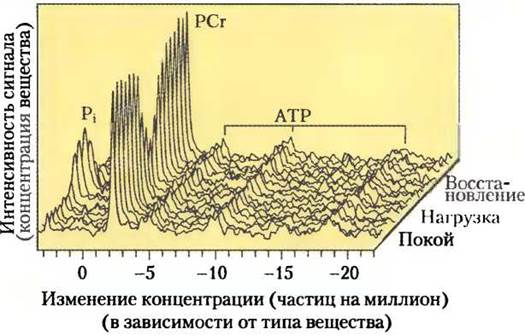
During active contractions and the predominance of glycolysis, this reaction proceeds primarily in the direction of ATP synthesis; during recovery following exercise, the same enzyme resynthesizes phosphocreatine from creatine, consuming ATP. Given the relatively high levels of ATP and phosphocreatine in muscle, these substances can be detected in intact muscle tissue in real time using 31P-NMR spectroscopy (Fig. 23–19).
Fig. 23–19. Phosphocreatine helps maintain ATP levels during physical exertion. 31P-NMR spectrum: the peaks correspond to inorganic phosphate (Pi), phosphocreatine (PCr), and ATP (each phosphate group of which yields a distinct signal). The spectrum shows the transition from a resting state to physical activity and subsequent recovery. Note that the ATP signal remains nearly constant during exercise, maintained at a high level by the Respiratory Chain and the phosphocreatine reserve, the amount of which decreases during exertion. During recovery (rest), when ATP production via catabolic pathways exceeds its consumption by resting muscle, the phosphocreatine reserve is replenished.
To increase the amount of atmospheric oxygen supplied for oxidative phosphorylation in the liver, heavy breathing must be maintained following intense muscular activity. The generated ATP is utilized for gluconeogenesis from lactate transported via the bloodstream from the muscles. The resulting glucose returns to the muscles to replenish glycogen stores, thereby completing the Cori cycle (Fig. 23–20; see also Box 15–4).
Fig. 23–20. Metabolic interdependence between skeletal muscle and the liver. During peak activity, muscles utilize glycogen as an energy source, producing lactate (lactic acid) via glycolysis. During recovery, a portion of this lactic acid is transported to the liver and converted into glucose through gluconeogenesis. Glucose is then released into the bloodstream and returns to the muscles to restore their glycogen reserves. The complete pathway glucose → lactic acid (lactate) → glucose constitutes the Cori cycle.

During active contraction of skeletal muscle, heat is released as a byproduct of the imperfect coupling between the chemical energy of ATP and the mechanical work of contraction. At low ambient temperatures, this heat-generating capacity can serve a vital purpose: skeletal muscles undergo shivering thermogenesis, consisting of rapidly repeating muscle contractions (shivering), which allows the body to generate heat with minimal movement and helps maintain normal body temperature, i.e., around 37 °C.
Cardiac muscle differs from skeletal muscle in that it operates continuously in a regular rhythm of contraction and relaxation, and its metabolism is strictly aerobic. It contains significantly more mitochondria than skeletal muscle—mitochondria account for over half of the cell volume (Fig. 23–21). The heart relies primarily on free fatty acids as its main energy source, alongside smaller amounts of glucose and ketone bodies delivered by the blood; these energy substrates are oxidized via the citric acid cycle and oxidative phosphorylation to synthesize ATP. Like skeletal muscle, cardiac
muscle does not store large amounts of lipids or glycogen. There is a small reserve of readily available energy in the form of phosphocreatine, which is sufficient for only a few seconds of contraction. Because the heart is an aerobic organ that derives its energy from oxidative phosphorylation, oxygen deprivation in a specific region of the myocardium—caused by blocked blood vessels due to lipid plaques (atherosclerosis) or blood clots (coronary thrombosis)—can lead to the death of that heart muscle tissue. This is what occurs during a myocardial infarction (often referred to as a heart attack). ■
Fig. 23–21. Electron micrograph of cardiac muscle. In heart tissue, pyruvate, fatty acids, and ketone bodies are oxidized within a massive population of mitochondria to synthesize ATP. Constant aerobic metabolism enables the human heart to pump blood at a rate of ~6 L/min or ~350 L/h, meaning that over a span of 70 years, the heart pumps 200 × 106 L.

The brain uses energy to transmit electrical impulses
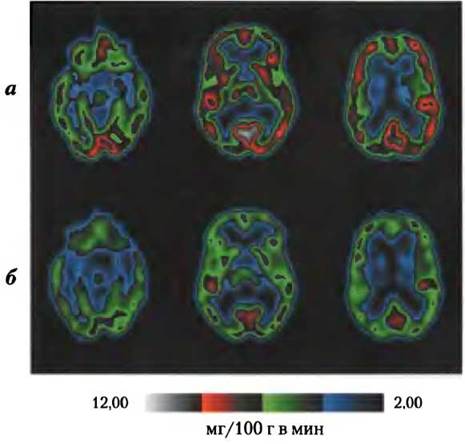
Energy metabolism in the brain exhibits distinct characteristics. Under normal conditions, the Neurons in the brain of an adult mammal rely exclusively on glucose as an energy source (Fig. 23-22). (Astrocytes, the other major cell type in the brain, can oxidize fatty acids.) The brain exhibits a highly active respiratory metabolism (Fig. 23-23); it consumes oxygen at a fairly constant rate and utilizes nearly 20% of the total O2 required by the body at rest. Because glycogen reserves in the brain are extremely low, the organ depends on a continuous supply of blood-borne glucose. If blood glucose levels drop significantly below the critical threshold, even for a short period, profound and sometimes irreversible alterations in brain function can occur.
Fig. 23-22. Fuel sources supplying ATP to the brain. The energy source utilized by the brain depends on nutritional status. The ketone bodies used during starvation are in the form of β-hydroxybutyrate. Electrogenic transport driven by Na+/K+-ATPase maintains the transmembrane potential required for signal transmission between neurons.

Fig. 23-23. Glucose metabolism in the brain. The METABOLIC ACTIVITY OF specific brain regions is visualized using positron emission tomography (PET) scans. PET imaging allows real-time tracking of isotope-labeled glucose in precisely localized areas of the living human brain. A labeled glucose analog, 2-[18F]-fluoro-2-deoxy-D-glucose, is introduced into the bloodstream; seconds later, the PET scanner reveals the amount of glucose taken up by each region of the brain, thereby measuring metabolic activity. Shown here are PET scans of anteroposterior brain slices at three levels, from top (left) to bottom (right). Glucose metabolism (in mg per 100 g/min) is compared between a resting subject (a) and a subject experiencing 48 hours of Sleep deprivation (b).
Although brain neurons cannot directly utilize free fatty acids from the blood as an energy source, they can, when necessary, metabolize β-hydroxybutyrate (a ketone body) produced from fatty acids in the liver. The ability of the brain to oxidize β-hydroxybutyrate via acetyl-CoA becomes critically important during prolonged starvation or severe emaciation—that is, after hepatic glycogen stores are depleted; under these conditions, the brain can utilize fat reserves for energy. During severe wasting, stored Muscle Proteins become the sole source of glucose for the brain (via hepatic gluconeogenesis).
Neurons oxidize glucose through the citric acid cycle, and the electron flow from oxidation through the respiratory chain generates virtually all the ATP utilized by these cells. Energy is required to establish and maintain the electrical potential across the neuronal plasma membrane. The membrane contains an electrogenic, ATP-driven Na+/K+-ATPase antiporter, which simultaneously pumps 2 K+ ions inward and 3 Na+ ions outward (see Fig. 11-37, Vol. 1). The resulting transmembrane potential fluctuates as an electrical signal (Action Potential) propagates from one end of the neuron to the other (see Fig. 12-25, Vol. 1). The action potential is the primary mechanism of Information Transfer in the nervous system; consequently, the depletion of neuronal ATP suppresses all activities coordinated by neural signaling.
Blood oxygen carriers, metabolites, and hormones
Blood mediates metabolic interactions among all tissues. It transports nutrients from the small intestine to the liver, and from the liver and adipose tissue to other organs; it also carries waste products from tissues to the kidneys. Oxygen is transported by the bloodstream from the Lungs to the tissues, while CO2 is carried back from the tissues to the lungs for exhalation. Blood transmits hormonal signals from one tissue to another. In this signaling role, the Circulatory system resembles the nervous system—both regulate and integrate the activities of diverse organs.
An adult human body contains approximately 5 to 6 liters of blood. Nearly half of the blood volume consists of Three types of cells (Fig. 23-24): erythrocytes (red Blood Cells), which contain hemoglobin and are specialized for The transport of O2 and CO2; a much smaller population of leukocytes (white blood cells) of various types (including lymphocytes), which are Key Components of The Immune System defending the body against infection; and platelets, which facilitate blood clotting. The fluid portion of blood is Blood Plasma, which is about 90% Water and 10% solutes. Dissolved or suspended in the plasma is a vast array of proteins, lipoproteins, nutrients, metabolites, waste products, inorganic ions, and hormones. More than 70% of the solid components of plasma consist of plasma proteins, predominantly IMMUNOGLOBULINS (circulating Antibodies), serum albumin, apolipoproteins involved in lipid transport, transferrin (which carries iron), and blood-clotting proteins such as fibrinogen and prothrombin.
Fig. 23-24. Composition of blood. Whole blood can be separated into plasma and cellular components by centrifugation. About 10% of blood plasma consists of dissolved solutes, of which 10% are inorganic salts, 20% small organic molecules, and 70% plasma proteins. Major soluble components are shown. Blood contains numerous other substances, often in trace amounts, including other metabolites, enzymes, hormones, Vitamins, Trace Elements, and bile pigments. Measuring the concentrations of blood plasma components is essential for diagnosing and treating many diseases.

Small ions and molecules dissolved in blood plasma are non-permanent components; they continuously circulate between the blood and various tissues. The intake of dietary inorganic ions Na+, K+, and Ca2+ (the major electrolytes of blood and Cytoplasm) is balanced by their excretion in the urine. For many blood components, a steady state resembling dynamic equilibrium is achieved: their concentrations fluctuate very little, even though a continuous exchange takes place between the digestive tract, blood, and urine. The plasma concentrations of Na+, K+, and Ca2+ remain nearly constant at approximately 140, 5, and 2.5 mM, respectively, changing only slightly in response to dietary intake. Marked deviations from these values are symptoms of serious, sometimes fatal, diseases. The kidneys play an exceptionally crucial role in maintaining ionic balance by selectively filtering out Metabolic waste products and excess ions from the blood while preventing the loss of essential nutrients and ions.
During differentiation, human erythrocytes lose their nuclei and mitochondria, and therefore can rely solely on glycolysis for ATP synthesis. The resulting lactate is transported back to the liver, where it is converted into glucose via gluconeogenesis and either stored as glycogen or released into peripheral tissues. Glucose is continuously available to erythrocytes from the blood.
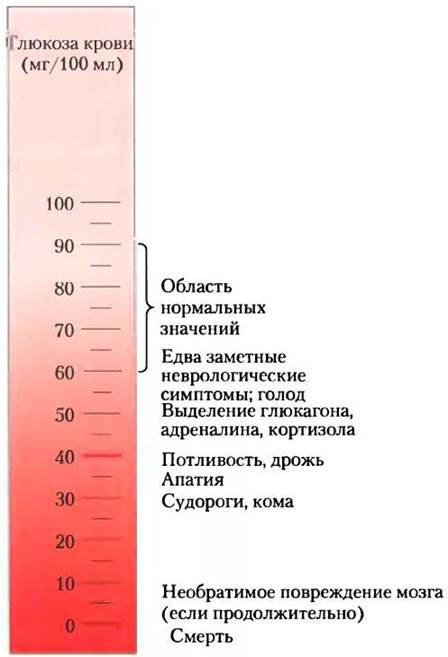
Blood plasma glucose concentration is tightly regulated. The brain constantly consumes glucose, while the liver maintains normal blood glucose levels: 60–90 mg/100 mL of whole blood (~4.5 mM). (Because erythrocytes account for a significant fraction of total blood volume, removing them by centrifugation leaves a liquid supernatant—plasma—containing the same amount of "blood glucose" in a smaller volume. To convert blood glucose concentration to plasma glucose concentration, multiply by 1.14.) When blood glucose drops to 40 mg/100 mL (hypoglycemia), a person experiences discomfort and confusion (Fig. 23–25); further decreases lead to coma, convulsions, and, in severe hypoglycemia, death. Maintaining a normal blood glucose concentration is therefore a high priority for the organism, accomplished through various regulatory mechanisms. Among the most important regulators of blood glucose are the hormones insulin, Glucagon, and epinephrine (see Section 23.3). ■
Fig. 23-25. Physiological consequences of low blood glucose levels in humans. Blood glucose levels of 40 mg/100 mL and below indicate severe hypoglycemia.
Summary of Section 23.2 Tissue-Specific Metabolism: Division of Labor
■ In mammals, metabolic functions are carried out by specialized tissues and organs. The liver is the central organ for distributing and processing nutrients. Sugars and amino acids derived from food digestion pass through the intestinal epithelium into the blood, which transports them to the liver. Some triacylglycerols from dietary lipids are also directed to the liver, where their fatty acids are utilized in various pathways.
■ Glucose 6-phosphate is a key intermediate in carbohydrate metabolism. It can be polymerized into glycogen, dephosphorylated to blood glucose, or converted into fatty acids via acetyl-CoA. It may undergo oxidation via glycolysis, the citric acid cycle, and the respiratory chain to generate ATP, or enter the pentose phosphate pathway to produce pentoses and NADPH.
■ Amino acids are used to synthesize liver and Blood Plasma Proteins, or their carbon skeletons are converted into glucose and glycogen via gluconeogenesis; ammonia produced by deamination is converted into urea.
■ The liver converts fatty acids into triacylglycerols, phospholipids, or cholesterol and cholesterol esters for transport by lipoproteins via the bloodstream to adipose tissue for storage. Fatty acids can also be oxidized to produce ATP or ketone bodies, which are transported by the bloodstream to other tissues.
■ White adipose tissue stores large reserves of triacylglycerols, which are released into the blood in response to hormonal signals such as epinephrine or glucagon. The specific function of brown adipose tissue is thermogenesis through The oxidation of fatty acids in uncoupled mitochondria.
■ Skeletal muscle is highly specialized for generating and utilizing ATP during mechanical work. During strenuous muscle activity, glycogen serves as the sole energy source, ensuring ATP production through enzymatic conversion to lactic acid. During periods of rest, lactic acid is reconverted into glycogen and glucose in the liver via gluconeogenesis. During active contraction, phosphocreatine acts as an immediate ATP reservoir.
■ Cardiac muscle derives nearly all of its required ATP from oxidative phosphorylation.
■ Brain neurons use only glucose and β-hydroxybutyrate as energy sources, with the latter becoming crucial during starvation or fasting. The brain consumes almost all of its ATP to drive The Active Transport of Na+ and K+ required to maintain the neuronal Membrane Potential.
■ Blood transports nutrients and metabolic waste products, and also relays hormonal signals between organs.
Last update: 06/08/2026
Editorial and Educational Adaptation: This material has been compiled based on the primary/original source text. The project team performed an editorial review, corrected technical inaccuracies, structured sections, and adapted the content for an educational format.
What was processed:
- elimination of formatting defects (OCR errors, structural breaks, corrupted characters);
- editorial organization of content;
- standardization of terminology in accordance with academic sources;
- verification of factual statements against the original source text.
All mentions of the author, publication year, and origin of the primary text have been preserved in accordance with the source.