LEHNINGER PRINCIPLES OF BIOCHEMISTRY - VOL. 2. BIOENERGETICS AND METABOLISM - 2014
PART II. BIOENERGETICS AND METABOLISM
15. PRINCIPLES OF METABOLIC REGULATION
15.3. Coordinated Regulation of Glycolysis and Gluconeogenesis
In mammals, Gluconeogenesis occurs primarily in The Liver and provides glucose to other Tissues when Glycogen reserves are depleted. As noted in Chapter 14, many glycolytic Enzymes are shared with gluconeogenesis. Seven glycolytic reactions are readily reversible, and the enzymes that catalyze them function in gluconeogenesis as well (Fig. 15-11). Three glycolytic reactions have such a large negative standard free-energy change (Table 15-3, data for Heart Muscle) that they are effectively irreversible: those catalyzed by hexokinase, PFK-1, and Pyruvate kinase. In gluconeogenesis, alternative pathways bypass each of these three steps; for example, The conversion of fructose 1,6-bisphosphate to fructose 6-phosphate is catalyzed by fructose 1,6-bisphosphatase (FBPase-1). Note that each bypass reaction is also characterized by a large negative value of ∆G′.
Class="center">Fig. 15-11. Glycolysis and gluconeogenesis. Glycolysis (shown in pink) and gluconeogenesis (blue) in rat liver. These processes proceed in opposite directions. Three steps of glycolysis and gluconeogenesis are catalyzed by different enzymes (the bypass steps of gluconeogenesis); seven steps are catalyzed in both directions by the same enzymes. Cofactors are omitted for simplicity.

Box 15-2. Isozymes: Different Proteins That Catalyze the Same Reaction
The four forms of hexokinase found in mammalian tissues represent just one example of a widespread biological phenomenon: a single chemical reaction catalyzed by two or more distinct molecular forms of an enzyme. These forms, called isozymes (or Isoenzymes), may occur within the same species, in the same tissue, or even in the same Cell. Isozymes typically differ in kinetic properties, regulatory mechanisms, cofactors used (such as NADH or NADPH for dehydrogenase isoforms), and subcellular localization (soluble versus membrane-bound). Isozymes may have similar, though not identical, Amino acid sequences and in many cases share a common evolutionary ancestor.
One of the first enzymes shown to have isoforms is Lactate dehydrogenase (LDH) (p. 91). In vertebrate tissues, it exists in at least five distinct isoforms with different electrophoretic mobilities. All LDH forms are composed of four polypeptide chains (each with an Mr of 33,500), but they differ in their combination of Two Types of polypeptide chains: M (muscle form) and H (heart form), which are encoded by two different genes.
The isozyme predominating in skeletal Muscle consists of four M chains, whereas The Heart-predominant isozyme contains four H chains. Other tissues contain isozymes with various combinations of M and H chains.
Type |
Composition |
Localization |
LDH1 |
HHHH |
Heart and erythrocytes |
LDH2 |
HHHM |
Heart and erythrocytes |
LDH3 |
HHMM |
|
LDH4 |
HMMM |
Skeletal Muscle and liver |
LDH5 |
MMMM |
Skeletal muscle and liver |
These differences in isozyme composition can be used to assess the timing and extent of myocardial infarction. Damage to cardiac tissue causes cardiac LDH to be released into the Blood. Shortly after a heart attack, the total blood LDH level rises, with LDH2 exceeding LDH1. After 12 hours, the amounts of LDH1 and LDH2 are nearly equal, and by 24 hours, LDH1 predominates. This shift in the LDH1/LDH2 ratio, combined with elevated blood levels of another cardiac enzyme, creatine kinase, provides strong diagnostic evidence of a recent myocardial infarction. ■
LDH isozymes differ markedly in their Vmax and Km values, particularly with respect to pyruvate. LDH4 rapidly converts pyruvate to lactate in skeletal muscle at very low pyruvate concentrations, whereas LDH1 catalyzes the rapid oxidation of lactate to pyruvate in the heart.
In general, the distribution of different isoforms of any given enzyme reflects at least the following four metabolic features.
1. Differences in metabolic pathways among various Organs. For example, The regulatory mechanisms of Glycogen phosphorylase isozymes in muscle and liver differ, reflecting the distinct physiological roles of glycogen breakdown in these two tissues.
2. Differences in localization and metabolic function within the same cell. An example is cytosolic versus mitochondrial isozymes of isocitrate dehydrogenase (Chapter 16).
3. Developmental differences between fetal/embryonic and adult tissues. For instance, fetal liver exhibits a characteristic LDH isozyme pattern that shifts as the organ matures into the adult liver. Certain glucose-catabolizing enzymes in tumor Cells are present in fetal rather than adult forms.
4. Differential responses of isozymes to allosteric modulators. This variation is highly useful for the fine-tuning of metabolic rates.
If any of these three irreversible steps were allowed to proceed simultaneously in both the glycolytic and gluconeogenic directions, ATP would be consumed without performing any net cellular work. For example, PFK-1 and FBPase-1 catalyze opposing reactions:

that is, the overall process amounts simply to the Hydrolysis of ATP with no net metabolic transformation. Clearly, running both processes simultaneously at high rates would dissipate a large amount of chemical energy as heat. Such a process is referred to as a futile cycle; however, because similar cycles can serve a useful regulatory function in metabolic pathways, it is more appropriately termed a substrate cycle. Similar Substrate Cycles occur at the other two points in gluconeogenesis/glycolysis where bypass reactions are employed (Fig. 15-11).
We now examine in greater detail the regulatory mechanisms governing glycolysis and gluconeogenesis at the three branch points where these pathways diverge.
Glucose 6-phosphate exerts different effects on hepatic and muscle hexokinases
Hexokinase, which catalyzes The entry of free glucose into The Glycolytic Pathway, is a regulatory enzyme. Four hexokinase isozymes (types I through IV) are known, encoded by four different genes. Recall that different proteins catalyzing the same reaction are called isozymes (Box 15-2). The hexokinase isozyme predominant in myocytes (hexokinase II) has a high affinity for glucose—half-maximal saturation is reached at a glucose concentration of about 0.1 mM. Because glucose entering myocytes from the blood (where its concentration is 4–5 mM) rapidly establishes an intracellular concentration high enough to saturate hexokinase II, this enzyme normally operates at nearly maximum velocity. Muscle hexokinases I and II are subject to allosteric inhibition by the product of the reaction they catalyze, glucose 6-phosphate. Whenever glucose 6-phosphate concentrations exceed normal levels, these isozymes undergo temporary, reversible inhibition, which brings The rate of glucose 6-phosphate production into balance with its rate of utilization, thereby restoring the steady state.
Liver hexokinase IV (glucokinase) and hexokinase isoforms in other tissues differ in their sensitivity to the inhibitory effect of glucose-6-phosphate.
The distinction between hepatic and muscle hexokinases reflects the different roles these organs play in Carbohydrate METABOLISM: Muscles consume glucose to generate energy, whereas the liver maintains blood glucose Homeostasis by removing or synthesizing glucose depending on its current concentration. Hexokinase IV (glucokinase) is the predominant form in the liver and differs from muscle hexokinases I–III in three major aspects. First, half-saturation of hexokinase IV occurs at a much higher glucose concentration (~10 mM) than is typically present in blood. Because the efficient glucose transporter in hepatocytes, GLUT2 (Fig. 11-30 illustrates The kinetics of the GLUT2 transporter in erythrocytes), facilitates rapid equilibration between cytosolic and blood glucose concentrations, the high Km value of hexokinase IV allows its regulation to be directly responsive to blood glucose levels (Fig. 15-12). Following a carbohydrate-rich meal, when blood glucose is high, excess glucose enters hepatocytes, where hexokinase IV converts it to glucose-6-phosphate. Because hexokinase IV is not saturated at 10 mM glucose, its catalytic activity increases as the glucose concentration rises up to 10 mM and beyond. Conversely, at low blood glucose levels, the concentration of glucose in hepatocytes falls below the Km of hexokinase IV, allowing glucose produced via gluconeogenesis to exit The Cell before it can be phosphorylated.
Fig. 15-12. Comparison of the kinetic properties of hexokinase IV (glucokinase) and hexokinase I. Note the sigmoidal dependence for hexokinase IV and the markedly lower Km value for hexokinase I. When blood glucose exceeds 5 mM, The activity of hexokinase IV increases, whereas hexokinase I is already operating at a rate close to Vmax and cannot respond to further increases in glucose concentration. Hexokinases I, II, and III share similar kinetic properties.
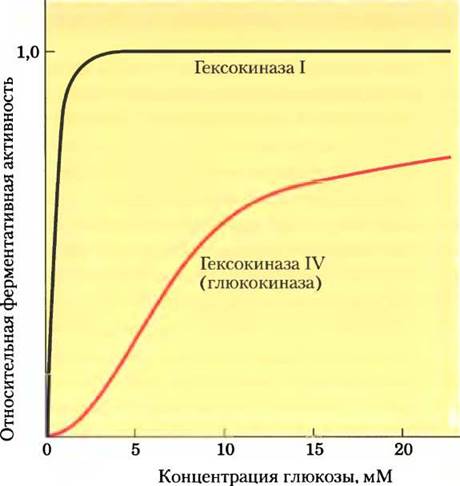
Second, hexokinase IV is not inhibited by glucose-6-phosphate and continues to function even when the accumulation of glucose-6-phosphate completely inhibits hexokinases I–III. Finally, hexokinase IV is subject to inhibition by a specific hepatic regulatory protein via reversible binding (Fig. 15-13). Tighter binding occurs in the presence of the allosteric modulator fructose-6-phosphate. Glucose competes with fructose-6-phosphate for binding, causing the regulatory protein to dissociate from the hexokinase IV complex and thereby relieving inhibition. Shortly after a carbohydrate-rich meal, when blood glucose is high, glucose enters hepatocytes via GLUT2 and activates hexokinase IV through this mechanism. During fasting, when blood glucose drops to 5 mM or lower, fructose-6-phosphate promotes the inhibition of hexokinase IV by the regulatory protein, ensuring that the liver does not compete for glucose with other organs. The Mechanism of this protein-mediated inhibition is noteworthy: the regulatory protein is localized in The Nucleus, where it binds hexokinase IV, sequestering it away from the other glycolytic enzymes located in the Cytosol (Fig. 15-13). As cellular glucose concentration rises, the enzyme begins to shuttle between the cytosol and the nucleus until equilibrium is reached. Glucose induces the dissociation of the regulatory protein from the complex, returning hexokinase IV to the cytosol to phosphorylate glucose.
Fig. 15-13. Regulation of hexokinase IV (glucokinase) by nuclear sequestration. The hexokinase IV regulatory protein is localized in the nucleus; it recruits hexokinase IV into the nucleus when hepatic fructose-6-phosphate concentrations are high and releases it back into the cytosol when glucose concentrations are high.

Regulation of hexokinase IV (glucokinase) and glucose-6-phosphatase at the transcriptional level
Hexokinase IV is also regulated at the level of Protein Synthesis. Under conditions requiring additional energy (low ATP, high AMP, high muscle activity) or during active glucose uptake (e.g., high blood glucose), Transcription of the hexokinase IV Gene is upregulated. The gluconeogenic enzyme glucose-6-phosphatase, which bypasses the hexokinase step of glycolysis, is regulated at the transcriptional level by factors that stimulate glucose production (low blood glucose, Glucagon signaling). The Transcriptional Regulation of these two enzymes (as well as other glycolytic and gluconeogenic enzymes) is discussed below.
Phosphofructokinase-1 and fructose-1,6-bisphosphatase are reciprocally regulated
As previously discussed, glucose-6-phosphate can enter the glycolytic pathway or participate in other metabolic fates, including glycogen synthesis and the Pentose Phosphate Pathway. The functionally irreversible reaction catalyzed by PFK-1 is the committed step of glycolysis. In addition to its substrate-binding site, this complex enzyme possesses multiple regulatory sites that bind allosteric activators or inhibitors.
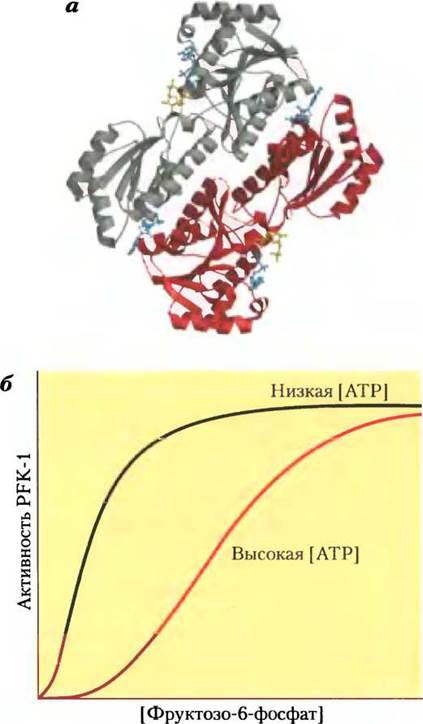
ATP is not only a substrate for PFK-1 but also an end product of glycolysis. A high intracellular ATP concentration indicates that the rate of ATP production exceeds its rate of consumption; under these conditions, ATP inhibits PFK-1 by binding to a regulatory site and thereby lowering the enzyme's affinity for fructose-6-phosphate (Fig. 15-14). The allosteric effects of ADP and AMP, whose concentrations rise when ATP consumption outpaces its synthesis, relieve this ATP-mediated inhibition. The interplay of these effects ensures maximal enzyme activity when ADP and AMP accumulate and reduced activity when ATP is abundant.
Fig. 15-14. Phosphofructokinase-1 (PFK-1) and its regulation. (a) Ribbon model of phosphofructokinase-1 from E. coli showing two of the four identical subunits of the enzyme (PDB ID 1PFK). Each subunit contains an Active Site where ADP (blue) and fructose-1,6-bisphosphate (yellow) are in close proximity, as well as binding sites for the allosteric regulator ADP (blue) located at the subunit interface. (b) Dependence of enzyme activity on Substrate Concentration demonstrating the Allosteric Regulation of muscle PFK-1 by ATP. At low ATP concentrations, K0.5 for fructose-6-phosphate is relatively low, allowing the enzyme to operate at high velocity even at modest fructose-6-phosphate concentrations. (As discussed in Chapter 6, the constant K0.5, or KM, is equivalent to the substrate concentration that yields half-maximal enzyme activity.) At high ATP concentrations, K0.5 for fructose-6-phosphate increases sharply, as reflected by the sigmoidal relationship between substrate concentration and enzyme activity. (c) Regulatory factors influencing PFK-1 activity.
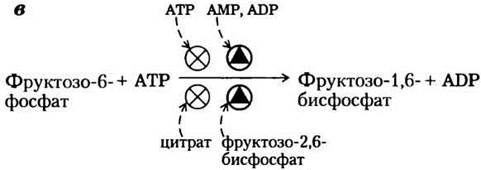
Citrate (the ionized form of citric acid) is a key intermediate in the aerobic Oxidation of Pyruvate, Fatty acids, and Amino Acids; it also Functions as an allosteric regulator of PFK-1. Elevated citrate concentrations enhance the inhibitory effect of ATP, further depressing the rate of glycolysis. In this case, as in several others discussed later, citrate serves as an intracellular signal that the cell is meeting its energy needs through The oxidation of fats and proteins.
In gluconeogenesis, the corresponding step is the conversion of fructose-1,6-bisphosphate to fructose-6-phosphate (Fig. 15-15). The enzyme catalyzing this reaction, FBPase-1, is subject to potent inhibition by AMP (allosteric inhibition); when cellular ATP levels are low (corresponding to high AMP concentrations), glucose synthesis—which consumes ATP—is slowed down.
Fig. 15-15. Regulation of fructose-1,6-bisphosphatase-1 (FBPase-1) and phosphofructokinase-1 (PFK-1). The crucial role of fructose-2,6-bisphosphate in regulating this substrate cycle is illustrated in greater detail below.
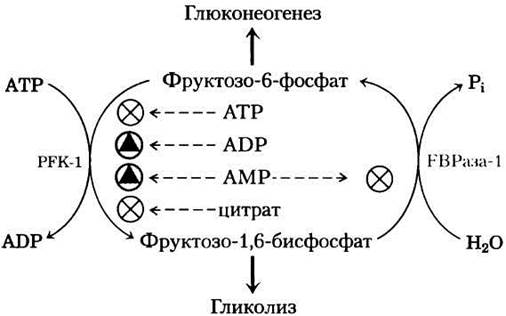
Thus, the reciprocally operating enzymes of glycolysis and gluconeogenesis (PFK-1 and FBPase-1) are coordinately regulated. Generally, when adequate concentrations of acetyl-CoA or citrate (formed by the Condensation of acetyl-CoA with oxaloacetate) are present, or when a large fraction of the cellular adenylate pool is in the form of ATP, gluconeogenesis is favored. When AMP levels rise, PFK-1 is stimulated and glycolysis is activated (additionally, as we will see in Section 15.5, glycogen breakdown is stimulated via the activation of glycogen phosphorylase).
Fructose-2,6-bisphosphate is a potent regulator of glycolysis and gluconeogenesis
The specialized role of the liver in maintaining constant blood glucose levels requires additional regulatory mechanisms governing glucose synthesis and utilization. When blood glucose falls, the hormone glucagon signals the liver to increase glucose synthesis and release while halting its consumption for endogenous needs. One source of glucose is hepatic glycogen stores, and another is gluconeogenesis, which utilizes pyruvate, lactate, glycerol, or Certain amino acids as precursors. Conversely, when blood glucose is high, Insulin signals the liver to utilize glucose as fuel and as a substrate for the synthesis and storage of glycogen and triacylglycerols.
The hormonal Regulation of glycolysis and gluconeogenesis is mediated by fructose-2,6-bisphosphate, which acts as an allosteric effector for PFK-1 and FBPase-1:
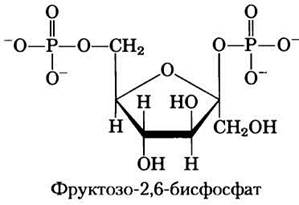
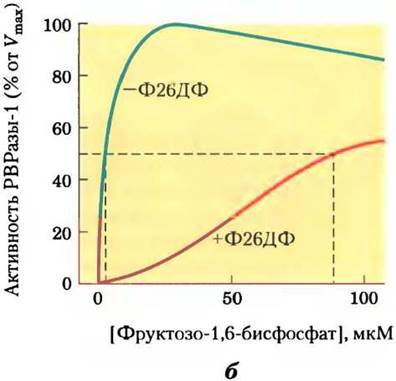
The binding of fructose-2,6-bisphosphate to the allosteric regulatory site on PFK-1 increases the enzyme's affinity for the substrate fructose-6-phosphate and decreases its affinity for the allosteric inhibitors ATP and citrate (Fig. 15-16). Under physiological concentrations of substrates (ATP and fructose-6-phosphate) and other effectors (ATP, AMP, citrate) in the absence of fructose-2,6-bisphosphate, PFK-1 is virtually inactive. Fructose-2,6-bisphosphate activates PFK-1 and stimulates hepatic glycolysis while inhibiting FBPase-1 by decreasing its substrate affinity (Fig. 15-16c), thereby dampening gluconeogenesis.
Fig. 15-16. The Role of fructose-2,6-bisphosphate in The regulation of glycolysis and gluconeogenesis. Fructose-2,6-bisphosphate (F26BP) exerts opposite effects on the activity of the glycolytic enzyme phosphofructokinase-1 (PFK-1) and the gluconeogenic enzyme fructose-1,6-bisphosphatase (FBPase-1). (a) In the absence of F26BP (blue curve), the activity of PFK-1 reaches half-maximal activity at a fructose-6-phosphate concentration of 2 mM (i.e., K0.5 = 2 mM). In the presence of 0.13 µM F26BP (red curve), the K0.5 for fructose-6-phosphate drops to just 0.08 mM. Thus, F26BP activates PFK-1 by increasing its affinity for the substrate (Fig. 15-18). (b) The activity of FBPase-1 is inhibited even at 1 µM F26BP, with substantial inhibition observed at a concentration of 25 µM. In the absence of the inhibitor (blue curve), the K0.5 for fructose-1,6-bisphosphate is 5 mM, but in the presence of 25 µM F26BP (red curve), K0.5 > 70 µM. Furthermore, fructose-2,6-bisphosphate increases the sensitivity of FBPase-1 to another allosteric inhibitor, AMP. (c) The net effect of fructose-2,6-bisphosphate.


The intracellular concentration of fructose-2,6-bisphosphate is determined by The ratio of its rates of Synthesis and degradation (Fig. 15-17a); synthesis occurs via the phosphorylation of fructose-6-phosphate catalyzed by phosphofructokinase-2 (PFK-2), whereas degradation is mediated by fructose-2,6-bisphosphatase (FBPase-2). Note that these enzymes are distinct from PFK-1 and FBPase-1, which catalyze the Synthesis and Breakdown of fructose-1,6-bisphosphate. Both PFK-2 and FBPase-2 activities reside within a single bifunctional protein. The relative magnitude of these two activities in the liver, which determines THE CELLULAR LEVEL of fructose-2,6-bisphosphate, is regulated by glucagon and insulin (see Fig. 15-23b).
Fig. 15-17. Regulation of fructose-2,6-bisphosphate levels. (a) The intracellular concentration of fructose-2,6-bisphosphate (F26BP) is determined by the rate of its synthesis by phosphofructokinase-2 (PFK-2) and degradation by fructose-2,6-bisphosphatase (FBPase-2). (b) Both enzymatic activities belong to a single protein and are subject to coordinate regulation by insulin and glucagon. Here and hereafter, arrows denote an increase (↑) and a decrease (↓) in metabolite levels.

As discussed in Chapter 12, glucagon stimulates hepatic adenylate cyclase to synthesize 3',5'-cyclic AMP (cAMP) from ATP. The cAMP subsequently activates cAMP-dependent protein kinase, which transfers a phosphoryl group from ATP to the bifunctional PFK-2/FBPase-2 protein. Phosphorylation of this protein enhances FBPase-2 activity while inhibiting PFK-2 activity. Consequently, glucagon lowers the intracellular level of fructose-2,6-bisphosphate, inhibits glycolysis, and stimulates gluconeogenesis.
Enhanced glucose synthesis helps elevate blood glucose levels in response to a glucagon signal. Insulin exerts the opposite effect by stimulating phosphoprotein phosphatase activity, which catalyzes the removal of the phosphoryl group from the bifunctional PFK-2/FBPase-2 protein. This increases PFK-2 activity, raises the level of fructose-2,6-bisphosphate, stimulates glycolysis, and inhibits gluconeogenesis.
Xylulose 5-phosphate is a key regulator of carbohydrate and Lipid Metabolism
Another regulatory mechanism also relies on the control of fructose-2,6-bisphosphate levels. In mammalian liver, xylulose 5-phosphate, a product of The pentose phosphate pathway (p. 109), promotes enhanced glycolysis following a carbohydrate-rich meal. The concentration of xylulose 5-phosphate increases as glucose entering the liver is converted into glucose 6-phosphate and enters either the glycolytic or the pentose phosphate pathway. Xylulose 5-phosphate activates phosphoprotein phosphatase 2A (PP2A) (Fig. 15-18), which dephosphorylates the bifunctional PFK-2/FBPase-2 enzyme (Fig. 15-17).
Fig. 15-18. Structure and MECHANISM OF ACTION of phosphoprotein phosphatase 2A (PP2A). (a) The Active Site of the protein's catalytic subunit contains two Mn2+ ions; it is located near the substrate recognition site situated at the interface of the catalytic and Regulatory Subunits (PDB ID 2NPP). Microcystin-LR (shown in red) is a specific inhibitor of the enzyme. The catalytic and regulatory subunits are linked by a scaffold subunit, which positions them correctly relative to each other to form the substrate recognition site. (b) The ability to recognize various proteins is conferred by the variable regulatory subunit of PP2A. Each regulatory subunit is compatible with the scaffold subunit and its bound catalytic subunit, with each regulatory subunit creating a unique substrate-binding site.

Dephosphorylation activates PFK-2 and inhibits FBPase-2; the resulting increase in the concentration of fructose-2,6-bisphosphate stimulates glycolysis and inhibits gluconeogenesis. Enhanced glycolysis promotes The production of acetyl-CoA, while an increased hexose flux through the pentose phosphate pathway generates NADPH. Acetyl-CoA and NADPH are precursors for fatty acid synthesis, the rates of which are known to rise sharply following the ingestion of a high-carbohydrate diet. Furthermore, xylulose 5-phosphate promotes the synthesis of all enzymes required for fatty acid production—a mechanism we will revisit when discussing the interconnection of carbohydrate and lipid metabolism (Chapter 23).
The glycolytic enzyme pyruvate kinase is subject to allosteric inhibition by ATP
Vertebrates express at least three pyruvate kinase isozymes, which differ in their tissue distribution and responsiveness to modulators. High concentrations of ATP, acetyl-CoA, and long-chain fatty acids (indicating adequate energy reserves) inhibit all pyruvate kinase isozymes (Fig. 15-19). Unlike the muscle M-form, the liver isozyme (L-form) is additionally regulated by phosphorylation. When low blood glucose levels trigger the release of glucagon, cAMP-dependent protein kinase phosphorylates the L-form of pyruvate kinase, thereby inactivating it. This curtails The Use of glucose as a fuel molecule in the liver, sparing it for the brain and other organs. Elevated cAMP levels in muscle produce an entirely different effect. In response to an epinephrine signal, cAMP activates glycogen breakdown and glycolysis, supplying the energy required for the "fight-or-flight" response.
Fig. 15-19. Regulation of pyruvate kinase. Allosteric Inhibitors of the enzyme include ATP, acetyl-CoA, and long-chain fatty acids (their presence indicates cellular energy surplus), whereas the accumulation of fructose-1,6-bisphosphate promotes enzyme activation. Alanine, which can be synthesized from pyruvate in a single step, acts as an allosteric inhibitor of pyruvate kinase, slowing down pyruvate production during glycolysis. The hepatic isozyme (L-form) is also subject to hormonal regulation; glucagon activates cAMP-dependent protein kinase (PKA; see Fig. 15-35), which phosphorylates the L-form of pyruvate kinase, rendering it inactive. When glucagon levels drop, protein phosphatase (PP) dephosphorylates and activates pyruvate kinase. This mechanism prevents the wasteful consumption of glucose in the liver via glycolysis during periods of low blood glucose, redirecting hepatic glucose into the bloodstream instead. The muscle isozyme (M-form) is not subject to regulation by phosphorylation.

The conversion of pyruvate to phosphoenolpyruvate in gluconeogenesis is regulated by multiple mechanisms
Along the pathway from pyruvate to glucose, the first checkpoint determines the metabolic fate of pyruvate within the Mitochondria. Pyruvate can either be converted into acetyl-CoA (via the pyruvate dehydrogenase complex; Chapter 16) for energy generation in The Citric Acid Cycle, or into oxaloacetate (via pyruvate carboxylase) to drive gluconeogenesis (Fig. 15-20). When Fatty acids are readily available and can serve as an energy source, their Catabolism in liver mitochondria generates acetyl-CoA, signaling that glucose oxidation is not required for energy production. Acetyl-CoA acts as an allosteric activator of pyruvate carboxylase and an inhibitor of pyruvate dehydrogenase, as it stimulates a protein kinase that suppresses dehydrogenase activity. When a cell requires additional energy, Oxidative Phosphorylation slows down, the NADH/NAD+ ratio rises (inhibiting The Citric Acid cycle), and acetyl-CoA accumulates. The elevated concentration of acetyl-CoA inhibits the pyruvate dehydrogenase complex, reducing the rate of pyruvate conversion to acetyl-CoA, and stimulates gluconeogenesis by activating pyruvate carboxylase, thereby channeling excess pyruvate toward oxaloacetate (and ultimately glucose).
Fig. 15-20. Two alternative metabolic fates of pyruvate. Pyruvate can be converted into glucose and glycogen via gluconeogenesis or oxidized to acetyl-CoA for energy production. The initial enzyme in each of these pathways is subject to allosteric regulation; acetyl-CoA derived from Fatty acid oxidation or produced by the pyruvate dehydrogenase complex stimulates pyruvate carboxylase and inhibits pyruvate dehydrogenase.

The resulting oxaloacetate is converted into phosphoenolpyruvate (PEP) in a reaction catalyzed by PEP carboxykinase (Fig. 15-11). In mammals, the regulation of this crucial enzyme occurs primarily at the level of its synthesis and degradation in response to nutritional and hormonal signals. Starvation or high concentrations of glucagon, acting via cAMP, increase the rate of transcription and stabilize the enzyme's mRNA. Insulin or high blood glucose levels exert the opposite effect. We will examine this mechanism in greater detail below. These adjustments are typically triggered by external signals (nutrients, Hormones) and manifest over time scales ranging from minutes to hours.
Transcriptional regulation of glycolysis and gluconeogenesis alters enzyme Abundance (molecule count)
Most regulatory processes discussed thus far operate through rapid and readily reversible mechanisms: allosteric modulation, Covalent Modification of enzymes (phosphorylation), or regulatory protein binding. Another group of regulatory processes relies on altering the quantity of an enzyme within the cell by shifting the balance between the synthesis and degradation of its molecules. Below, we examine transcriptional regulation mediated by signal-activated transcription factors.
In Chapter 12, we discussed nuclear receptors and transcription factors in relation to insulin signal Transduction. Insulin acts through its receptor in The Plasma Membrane, turning on at least two distinct signaling pathways, each coupled with the Activation of a protein kinase. For example, the mitogen-activated protein kinase ERK phosphorylates the transcription factors SRF and Elk1 (see Fig. 12-15), which in turn stimulate the synthesis of enzymes required for Cell Growth and Division. Protein kinase B (also known as Akt) phosphorylates another set of transcription factors (such as PDX1), stimulating the synthesis of enzymes responsible for carbohydrate and fat metabolism, which are produced and stored in the body upon excessive carbohydrate intake. In pancreatic β-cells, PDX1 also stimulates insulin synthesis.
At the transcriptional level, insulin regulates more than 150 genes; in humans, there are at least seven Major Types of insulin-responsive elements, each recognized by a group of transcription factors activated by insulin under various conditions. Insulin stimulates the transcription of genes encoding hexokinases II and IV, PFK-1, pyruvate kinase, and PFK-2/FBPase-2 (all of which participate in glycolysis and its regulation), several FATTY ACID Biosynthesis enzymes, glucose-6-phosphate dehydrogenase, and 6-phosphogluconate dehydrogenase, as well as Enzymes of the pentose phosphate pathway that generate NADPH for fatty acid synthesis. In addition, insulin downregulates the expression of the genes for two gluconeogenic enzymes—PEPCK and glucose-6-phosphatase (Table 15-5).
Table 15-5. Some genes regulated by insulin
Change in Gene Expression |
Metabolic pathway |
Increased expression |
|
Hexokinase II |
Glycolysis |
Hexokinase IV |
Glycolysis |
Phosphofructokinase-1 (PFK-1) |
Glycolysis |
Pyruvate kinase |
Glycolysis |
PFK-2/FBPase-2 |
Glycolysis / gluconeogenesis regulation |
Glucose-6-phosphate dehydrogenase |
Pentose phosphate pathway (NADPH) |
6-Phosphogluconate dehydrogenase |
Pentose phosphate pathway (NADPH) |
Pyruvate dehydrogenase |
Fatty acid synthesis |
Acetyl-CoA carboxylase |
Fatty acid synthesis |
Malic enzyme |
Fatty acid synthesis (NADPH) |
ATP-citrate lyase |
Fatty acid synthesis (provides acetyl-CoA) |
Fatty acid synthase complex |
Fatty acid synthesis |
Stearoyl-CoA desaturase |
Fatty acid desaturation |
Acyl-CoA glycerol transferase |
Triacylglycerol synthesis |
Decreased expression |
|
PEPCK |
Gluconeogenesis |
Glucose-6-phosphatase (catalytic subunit) |
Glucose release into blood |
An important role in carbohydrate metabolism is played by the transcription factor ChREBP (carbohydrate response element binding protein; Fig. 15-21), which is expressed primarily in the liver, adipose tissue, and kidneys. It serves to coordinate the synthesis of enzymes required for carbohydrate and fat production. In its inactive state,
the ChREBP protein is phosphorylated and localized in the cytosol. After phosphoprotein phosphatase 2A (PP2A; Fig. 15-18) removes its phosphoryl group, the transcription factor becomes capable of entering the nucleus. Here, nuclear PP2A removes another phosphoryl group, and ChREBP binds to the Mlx protein. This complex triggers the synthesis of several enzymes: pyruvate kinase, fatty acid synthase, and acetyl-CoA carboxylase—the first committed enzyme in fatty acid synthesis (Fig. 15-21).
Figure 15-21. Mechanism of gene regulation by the transcription factor ChREBP. Located in the hepatocyte cytosol, ChREBP is phosphorylated at Ser and Thr residues and cannot enter the nucleus. Removal of the Serine phosphoryl group by phosphoprotein phosphatase 2A allows the protein to enter the nucleus, where the Threonine phosphoryl group is then removed. Thus activated, ChREBP binds to its partner protein Mlx. The ChREBP-Mlx complex then binds to the carbohydrate response element (ChoRE) in the promoter and stimulates transcription. PP2A is allosterically activated by xylulose 5-phosphate, which is formed as an intermediate of the pentose phosphate pathway.

The activity of PP2A (and consequently the Regulation of the synthesis of a group of metabolic enzymes) is controlled by xylulose 5-phosphate—an intermediate not of glycolysis or gluconeogenesis, but of the pentose phosphate pathway. When blood glucose concentrations are high, glucose enters the liver and is phosphorylated by hexokinase IV. The resulting glucose 6-phosphate can be used in glycolysis or the pentose phosphate pathway. In the latter case, two successive oxidative reactions first yield xylulose 5-phosphate, whose appearance indicates that the glucose-utilizing pathways are adequately supplied with substrate. The signal is transmitted via the allosteric activation of PP2A, which then dephosphorylates ChREBP, enabling it to turn on the expression of genes for glycolytic and lipogenic enzymes (Fig. 15-21). Glycolysis yields pyruvate, and the acetyl-CoA derived from pyruvate serves as the Starting Material for fatty acid synthesis; acetyl-CoA carboxylase converts acetyl-CoA into malonyl-CoA, the first specific intermediate in the fatty acid synthetic pathway. Fatty acid synthase produces fatty acids for adipose tissue and for storage as triacylglycerols (Chap. 21). Thus, excess dietary CARBOHYDRATES are stored as fat.
Another liver transcription factor, SREBP-1c (sterol response element-binding protein; see Fig. 21-43), turns on the synthesis of pyruvate kinase, hexokinase IV, lipoprotein lipase, acetyl-CoA carboxylase, and the fatty acid synthase complex, which converts acetyl-CoA (derived from pyruvate) into fatty acids for storage in adipocytes. Insulin stimulates SREBP-1c synthesis, whereas glucagon suppresses it. In addition, SREBP-1c represses the expression of several gluconeogenic enzymes: glucose 6-phosphatase, PEPCK, and FBPase-1.
The transcription factor CREB (cyclic AMP response element-binding protein) turns on the Synthesis of glucose 6-phosphatase and PEPCK in response to elevated cAMP levels caused by glucagon. Conversely, insulin-stimulated inactivation of other transcription factors shuts down the synthesis of several hepatic gluconeogenic enzymes: PEPCK, fructose-1,6-bisphosphatase, The Endoplasmic reticulum glucose 6-phosphate transporter, and glucose 6-phosphatase. For example, FOXO1 (forkhead box protein O1) stimulates the synthesis of gluconeogenic enzymes while repressing the synthesis of enzymes involved in glycolysis, the pentose phosphate pathway, and triacylglycerol synthesis (Fig. 15-22).
Figure 15-22. Mechanism of gene expression regulation by the transcription factor FOXO1. Insulin triggers the signaling cascade shown in Fig. 12-16, thereby activating protein kinase B. The cytosolic transcription factor FOXO1 is phosphorylated by protein kinase B and tagged with ubiquitin for subsequent degradation in the proteasome. Unphosphorylated or dephosphorylated FOXO1 can enter the nucleus, bind to a response element, and initiate the transcription of target genes. Thus, insulin has the ability to turn off the expression of genes for enzymes such as PEPCK and glucose 6-phosphatase.
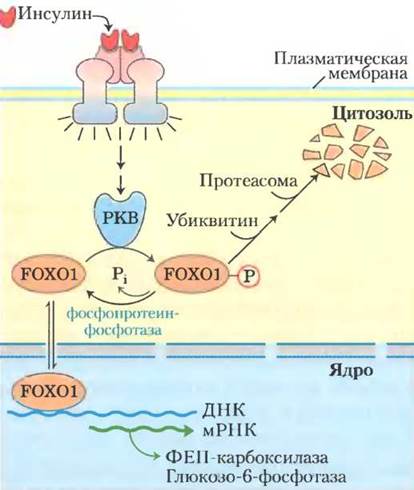
In its unphosphorylated form, FOXO1 acts as a nuclear transcription factor. In response to an insulin signal, FOXO1 exits the nucleus into the cytosol, where it is phosphorylated by protein kinase B and ubiquitinated, followed by degradation in the proteasome. Glucagon prevents protein kinase B-mediated phosphorylation, causing FOXO1 to remain in its active form within the nucleus.
As we can see, the regulation of genes encoding enzymes responsible for carbohydrate and fat metabolism is quite complex—and in reality, it is even more intricate and subtle than presented here. Multiple transcription factors can act on the same promoter, numerous protein Kinases and Phosphatases can activate or inactivate these transcription factors, and the action of transcription factors is further modulated by various accessory pro-
teins. Consider, for example, the PEPCK gene, whose transcriptional regulation has been studied in considerable detail. At least 15 response elements recognized by 12 known transcription factors have been identified in the promoter region of this gene (Fig. 15-23), and it is likely that additional transcription factors will be discovered over time. These transcription factors act on this and hundreds of other promoters, providing fine-tuning of the expression of hundreds of metabolic enzymes and coordinating their activities in carbohydrate and fat metabolism. The critical role of transcription factors in Metabolic Regulation is clearly evident when Mutations occur in their corresponding genes. For example, in maturity-onset diabetes of the young (MODY), at least five different forms are caused by mutations in specific transcription factors (Box 15-3).
Figure 15-23. Complex mechanism of gene expression regulation, exemplified by the regulation of PEPCK. Shown are transcription factors (represented as icons whose size correlates with the DNA sequence) that regulate PEPCK transcription. The degree of gene expression depends on the combined influence of all factors: nutrient availability, blood glucose levels, and other parameters that determine the cell's current requirement for this enzyme. P1, P2, P3I, P3II, and P4 are protein-binding sites identified by DNase I footprinting (see Box 26-1). The TATA motif is the assembly site for the RNA polymerase II (Pol II) transcription complex.

Box 15-3. MEDICINE. Mutations Causing Rare Forms of Diabetes Mellitus
The term "diabetes" encompasses a range of clinical conditions characterized by excessive urine production. In Box 11-2, we examined a form of this disorder known as diabetes insipidus, in which impaired Water reabsorption in the kidneys is caused by an aquaporin gene mutation. The term "diabetes mellitus" refers to the form of the disease characterized by impaired glucose metabolism—either due to the Pancreas's inability to produce insulin or because of tissue insensitivity to the insulin signal.
There are two principal forms of diabetes mellitus. Type 1 diabetes, also called insulin-dependent diabetes mellitus (IDDM), is caused by an autoimmune reaction directed against the body's own insulin-producing pancreatic β-cells. To compensate for inadequate β-cell activity, patients with this form of diabetes must receive insulin via injection or inhalation. Type 1 diabetes manifests in early childhood and adolescence, which is why this form was formerly called juvenile-onset diabetes. Type 2 diabetes, otherwise known as non-insulin-dependent diabetes mellitus (NIDDM), typically develops in individuals over the age of 40. This form is more common than Type 1 diabetes and is more likely to occur in overweight individuals. With a high global prevalence of varying degrees of obesity, NIDDM has become widespread, highlighting the urgent need to understand the genetic and biochemical links between obesity and this disease. In subsequent chapters, we will examine lipid and Protein metabolism in greater detail and return to the Discussion of diabetes in Chapter 23, where profound alterations in carbohydrate, lipid, and protein metabolism occur.
Here we examine another variant of diabetes characterized by impaired carbohydrate and fat metabolism: maturity-onset diabetes of the young (MODY), which results from a mutation in the gene encoding a transcription factor crucial for transmitting the insulin signal to the nucleus, or an enzyme involved in the cellular response to insulin signaling. For example, in MODY2, the gene for hexokinase IV (glucokinase) is mutated in the liver and pancreas, where this specific enzyme isoform predominates. Pancreatic β-cell glucokinase acts as a glucose sensor. Normally, when blood glucose concentrations rise, β-cell glucose levels also increase; because glucokinase has a relatively high Km for glucose, its activity rises with increasing glucose concentration. Metabolism of the resulting glucose 6-phosphate leads to an increase in ATP levels within the β-cells, which in turn triggers insulin release via the mechanism shown in Figure 23-28. In healthy individuals, insulin is released at a blood glucose concentration of about 5 mM. However, individuals with inactivating mutations in both copies of the glucokinase gene have a very high threshold glucose concentration for insulin release and therefore exhibit severe hyperglycemia from birth—a condition known as permanent neonatal diabetes. Individuals with one mutated and one normal copy of the glucokinase gene release insulin at a glucose concentration of about 7 mM. If a patient's Blood Glucose Level is only slightly above normal, they exhibit mild hyperglycemia without clinical symptoms, a condition usually discovered incidentally through routine blood tests.
In addition, at least five Other forms of MODY are known, each associated with an inactivating mutation in a transcription factor required for the normal development and function of pancreatic β-cells. Affected individuals show varying degrees of impaired insulin production and blood glucose homeostasis. In MODY1 and MODY3, the abnormalities are severe enough to cause the complications associated with IDDM and NIDDM: cardiovascular disease, Kidney failure, and blindness. MODY4, MODY5, and MODY6 are less severe forms. MODY forms represent only a small fraction of all NIDDM pathology. Furthermore, mutations in the insulin gene itself are exceedingly rare; individuals harboring such mutations exhibit insulin signaling defects of varying severity.
Summary of Section 15.3 Coordinated regulation of Glycolysis and Gluconeogenesis
■ Gluconeogenesis and glycolysis share seven enzymes that catalyze readily reversible reactions in both metabolic pathways. At three other steps, the forward and reverse reactions are catalyzed by different enzymes, and it is at these steps that the regulation of the two pathways takes place.
■ The kinetic properties of hexokinase IV (glucokinase) are tailored to its unique physiological role in the liver: it releases glucose into the bloodstream when blood glucose levels are low, and takes up and metabolizes glucose when blood glucose is abundant.
■ Allosteric inhibitors of PFK-1 include ATP and citrate. In most mammalian tissues, including the liver, fructose-2,6-bisphosphate acts as a potent allosteric activator of PFK-1.
■ The allosteric inhibitor of pyruvate kinase is ATP, whereas the liver isozyme is inhibited via cAMP-dependent phosphorylation.
■ The regulation of gluconeogenesis is primarily exerted at the level of pyruvate carboxylase (activated by acetyl-CoA) and FBPase-1 (inhibited by fructose-2,6-bisphosphate and AMP).
■ To limit futile cycling between glycolysis and gluconeogenesis, these two Metabolic pathways are subject to coordinated allosteric control, largely achieved through the reciprocal actions of fructose-2,6-bisphosphate on PFK-1 and FBPase-1.
■ Glucagon and epinephrine decrease the concentration of fructose-2,6-bisphosphate. This hormonal effect is mediated by an increase in cAMP levels and the subsequent phosphorylation of the bifunctional enzyme that controls both the synthesis and degradation of fructose-2,6-bisphosphate. Phosphorylation inactivates PFK-2 and activates FBPase-2, leading to The breakdown of fructose-2,6-bisphosphate. Conversely, insulin increases the concentration of fructose-2,6-bisphosphate by activating phosphoprotein phosphatase, which dephosphorylates and thereby activates PFK-2.
■ Xylulose 5-phosphate is an intermediate of the pentose phosphate pathway; it activates phosphoprotein phosphatase 2A, which dephosphorylates several key proteins, including PFK-2/FBPase-2, thereby shifting hepatic metabolism toward glucose uptake, glycogen synthesis, and Lipogenesis.
■ Transcription factors, including ChREBP, CREB, SREBP, and FOXO1, regulate the nuclear expression of specific genes encoding enzymes of glycolysis and gluconeogenesis. Insulin and glucagon act as antagonists, modulating these transcription factors to turn the expression of numerous genes on and off.
Last update: 06/08/2026
Editorial and Educational Adaptation: This material has been compiled based on the primary/original source text. The project team performed an editorial review, corrected technical inaccuracies, structured sections, and adapted the content for an educational format.
What was processed:
- elimination of formatting defects (OCR errors, structural breaks, corrupted characters);
- editorial organization of content;
- standardization of terminology in accordance with academic sources;
- verification of factual statements against the original source text.
All mentions of the author, publication year, and origin of the primary text have been preserved in accordance with the source.