LEHNINGER PRINCIPLES OF BIOCHEMISTRY - VOL. 2. BIOENERGETICS AND METABOLISM - 2014
PART II. BIOENERGETICS AND METABOLISM
Class="center">Thus, The formation of Liver Glycogen from lactic acid apparently provides an important link between Muscle and liver METABOLISM. With the participation of the liver, muscle glycogen is converted into accessible Blood sugar, which in turn is converted back into muscle glycogen. Consequently, There is a closed cycle of glucose molecule transformations within the Organism... It has been shown that adrenaline accelerates these reactions in the direction from muscle glycogen to liver glycogen... At the same time, Insulin accelerates reactions in the direction from blood glucose to muscle glycogen.
C. F. Cori and G. T. Cori, from an article in the Journal of Biological Chemistry, 1929
15. PRINCIPLES OF METABOLIC REGULATION
The Regulation of Metabolic reactions is a central theme in biochemical research and one of the most remarkable capabilities of the living Cell. Among the thousands of enzymatic reactions occurring within a cell, there is arguably not a single one that does not undergo some form of regulation. Although it is customary (and useful) in textbooks to subdivide metabolic processes into discrete "pathways" that perform specific Functions in cell life support, no such division exists within The Cell itself. Moreover, every pathway discussed in this book is inextricably linked to all other cellular processes, as illustrated by the multidimensional network of reactions (Fig. 15-1). For example, in Chapter 14 we discussed three possible pathways for The conversion of glucose-6-phosphate in liver Cells: participation in Glycolysis to generate ATP, Participation in the Pentose Phosphate Pathway to produce NADPH and pentoses, and Hydrolysis to glucose and phosphate to replenish blood glucose reserves. But in reality, there are A number of other possible pathways for the conversion of glucose-6-phosphate; for instance, it can be used for the Synthesis of Other sugars such as glucosamine, galactose, galactosamine, fucose, and neuraminic acid, participate in protein glycosylation, or be partially degraded to supply acetyl-CoA for the synthesis of Fatty acids and sterols. For example, the bacterium Escherichia coli uses glucose to synthesize the carbon skeletons of virtually all its molecules. When a cell channels glucose-6-phosphate into one pathway, it affects all other pathways in which this substance serves as a precursor or intermediate. Any change in the distribution of glucose-6-phosphate in one metabolic pathway directly or indirectly influences its participation in all other pathways.
Such shifts in metabolite distribution frequently occur in the life of a cell. Louis Pasteur was the first to describe a dramatic increase in glucose consumption (more than tenfold) by Yeast cultures when transitioning from aerobic to anaerobic conditions. This phenomenon, known as the Pasteur Effect, is not accompanied by any noticeable fluctuations in the concentration of ATP or any other substance among the hundreds of intermediates and products of glucose metabolism. Similar changes are observed in the Skeletal Muscle cells of a sprinter. Cells possess a stunning capacity to carry out all these interrelated metabolic transformations simultaneously and economically, yielding each product in strictly defined quantities and at precisely the right moment under changing environmental conditions.
Fig. 15-1. Three-dimensional network of metabolic reactions. A typical Introduction/5.html">Eukaryotic Cell is capable of synthesizing about 30,000 different Proteins catalyzing thousands of reactions that generate hundreds of metabolites—many of which are involved in multiple metabolic pathways. Illustration taken from the KEGG PATHWAY database (Kyoto Encyclopedia of Genes and Genomes, www.genome.ad.jp/kegg/pathway/map/map01100.html). Each region can be examined in greater detail, down to the level of individual Enzymes and intermediates.

In this chapter, we will illustrate the fundamental Principles of Metabolic regulation using glucose metabolism as an example. We begin by examining the overall role of regulation in achieving metabolic Homeostasis and introduce The Theory of Metabolic control, which provides a basis for the quantitative analysis of complex metabolic processes. Next, we focus on the specific regulation of individual enzymes in glucose metabolism, reviewing the catalytic activity of enzymes involved in glycolysis and Gluconeogenesis, as described in Chapter 14. We will also discuss the catalytic and regulatory Properties of Enzymes involved in the Synthesis and Breakdown of glycogen, one of the most thoroughly studied Examples of Metabolic Regulation. By choosing Carbohydrate Metabolism to illustrate the principles of metabolic regulation, we have artificially separated it from fatty acid metabolism. In reality, these two processes are intimately connected within the cell, as we will see in Chapter 23.
15.1. Regulation of Metabolic Pathways
Catabolic reactions in Glycogen Metabolism provide the energy required to overcome the "forces" of Entropy, whereas anabolic reactions lead to the formation of starting molecules for Biosynthesis and the storage of metabolic energy. These processes are so vital to cellular function that complex regulatory mechanisms have evolved to ensure that metabolites move through the correct pathways, in the right direction, and at the necessary rate to fully satisfy the current needs of the cell or organism; as environmental conditions change, the rates of metabolite transformations in the respective Metabolic pathways are adjusted accordingly.
And external conditions do indeed change, sometimes quite drastically. During intense physical exertion, the ATP demand of Muscles can increase a hundredfold in a matter of seconds. Oxygen availability may drop due to Hypoxia (impaired oxygen delivery to Tissues) or ischemia (reduced blood flow to tissues). The ratio of CARBOHYDRATES, fats, and proteins in the diet varies, and energy-rich nutrients enter the body irregularly, creating a need to adjust ongoing metabolic processes between meals and during fasting. Vast amounts of energy and molecules are required for biosynthesis, for instance, during wound healing.
Cells and organisms exist in a dynamic steady state
Energy-rich molecules such as glucose are taken up by the cell, while Metabolic waste products such as CO2 leave it, yet the mass and COMPOSITION OF THE cell, individual organ, or adult animal remain practically constant over time; cells and organisms exist in a dynamic steady state, by no means in equilibrium with their environment. The substrate for each reaction in a metabolic pathway is supplied by the preceding reaction at the exact same rate as it is subsequently converted into a product. In other words, although the rate (v) of flux (or simply flux) at a given stage of metabolism may be high and subject to large variations, the Substrate Concentration [S] remains constant. For a two-step reaction
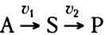
at v1 = v2, the concentration [S] is constant. For example, Changes in the rate of glucose supply from various sources into the blood are offset by changes in v2 (the uptake of glucose from the blood into tissues), thereby maintaining the blood glucose concentration [S] at around 5 mM. This is homeostasis at THE MOLECULAR LEVEL. In humans, the impairment of homeostatic mechanisms is frequently the cause of disease. For instance, in Diabetes Mellitus, the Regulation of blood glucose concentration is disrupted due to insulin deficiency or resistance, leading to detrimental health consequences.
When external stimuli are not merely transient or when one cell type transforms into another, the Regulation of cellular composition and metabolism can be more substantial, requiring notable and sustained shifts in the distribution of energy and biosynthetic precursors to execute the transition smoothly. Consider, for example, the differentiation of a Bone Marrow stem cell into an erythrocyte. The initial cell contains a Nucleus, Mitochondria, and little to no Hemoglobin, whereas a fully differentiated erythrocyte is packed with hemoglobin but lacks both a nucleus and mitochondria. The composition of this cell continuously changed in response to extracellular signals, and its metabolism shifted accordingly. Cell Differentiation requires precise regulation of cellular protein concentrations.
Evolution has produced a remarkable array of regulatory mechanisms that maintain homeostasis at the molecular, cellular, and organismal levels. Structure/19.html">The Importance of metabolic regulation for the organism is reflected in the relative proportion of genes encoding regulatory machinery: in humans, about 4,000 genes (roughly 12% of all genes) encode regulatory proteins, including A wide variety of receptors, Gene Expression regulators, and approximately 500 different protein Kinases! Regulatory mechanisms operate across different time scales (from seconds to days) and vary in their sensitivity to environmental changes. In many cases, these mechanisms overlap: the same enzyme may be subject to control by multiple regulatory pathways.
Both enzyme Abundance and catalytic activity are regulated
The intensity of an enzymatic process can be regulated either by altering The amount of enzyme or by modulating the catalytic activity of existing enzyme molecules. Such adjustments occur over time scales ranging from milliseconds to hours and serve as a response to intracellular or extracellular signals. Rapid allosteric shifts in enzymatic activity are typically initiated locally by changes in the local concentration of small molecules, such as the substrate of a given metabolic pathway (glucose in glycolysis), a product of the pathway (ATP in glycolysis), or a key metabolite or cofactor (such as NADH), reflecting the metabolic capacity of the cell. Second messengers (such as cyclic AMP and Ca2+), generated inside cells in response to extracellular signals (Hormones, cytokines, etc.), also mediate Allosteric Regulation, albeit with a somewhat slower influence on signal Transduction mechanisms (see Chapter 12).
Extracellular signals (Fig. 15-2, (1)) can be hormonal (insulin or adrenaline), neuronal (acetylcholine), or transmitted via growth factors or cytokines. The amount of a given enzyme in the cell is determined by the balance between its rates of Synthesis and degradation. The rate of synthesis is regulated by the activation (in response to an external signal) of a Transcription factor (Fig. 15-2, (2); for details, see Chapter 28). Transcription factors are Nuclear Proteins that, upon activation, bind to specific DNA sequences (response elements) near the promoter region of a gene (the transcription start site) and either activate or repress the transcription of that gene, resulting in an increase or decrease in The production of the corresponding protein. The Activation of a transcription factor often occurs As a result of binding to a specific Ligand, and sometimes is triggered by its phosphorylation or dephosphorylation. Each gene is controlled by one or more response elements recognized by specific transcription factors. Some genes contain multiple response elements and are therefore controlled by several different transcription factors responding to multiple different signals. Groups of genes encoding functionally related proteins, such as enzymes of glycolysis or gluconeogenesis, often contain response elements with identical sequences, allowing the same signal—acting through a specific transcription factor—to turn an entire group of genes on or off simultaneously. Section 15.3 discusses the REGULATION OF CARBOHYDRATE Metabolism by specific transcription factors.
The resistance of mRNA molecules to ribonucleases (Fig. 15-2, (3)) can vary, so that the amount of a given mRNA species in the cell is a function of its rates of synthesis and degradation (Chapter 26). Finally, the rate of mRNA Translation on Ribosomes (Fig. 15-2, (4)) is also regulated and depends on several factors described in detail in Chapter 27.
Fig. 15-2. Factors influencing enzyme activity. Overall enzyme activity can change due to variations in the number of molecules of a given enzyme (its abundance) in the cell, its effective activity in a specific cellular compartment ((1)–(6)), or the modulation of The activity of existing enzyme molecules, as detailed in the text. The activity of a specific enzyme is determined by a combination of these factors.

Note that an $n$-fold increase in mRNA production does not always mean an $n$-fold increase in the Synthesis of the corresponding protein.
The resulting protein molecule has a finite lifespan, specifically ranging from a few minutes to many days (Table 15-1). The rate of enzyme degradation (Fig. 15-2, (5)) also varies and is determined by intracellular conditions. Some proteins undergo degradation in proteasomes (see Chapter 28) as a result of covalent attachment to ubiquitin (recall the protein cyclin; see Fig. 12-46). Rapid turnover (synthesis followed by degradation) requires a significant Energy Expenditure; however, proteins with a shorter half-life (the time required for half of the initial amount of a substance to remain) can reach a new steady-state level of abundance faster than proteins with a long half-life, and the benefit of such a rapid response must offset or exceed the cell's energy expenditure.
Table 15-1. Approximate half-lives of proteins in mammalian Organs
Organs |
Half-life, days |
Liver |
0.9 |
1.7 |
|
4.1 |
|
4.6 |
|
Muscle |
10.7 |
Another factor influencing effective enzyme activity is the availability of its substrate (Fig. 15-2, (6)). Muscle hexokinase cannot act on glucose until this sugar is transported from the blood into the muscle cells, and the rate of glucose entry into cells depends on carrier molecules (see Table 11-3) in The Plasma Membrane. Inside the cell, certain enzymes and enzyme systems are sequestered within various membrane-bounded compartments; the delivery of substrates to these compartments can be a rate-limiting factor for the enzyme.
Thanks to these multiple regulatory mechanisms of enzymatic activity, cells can substantially alter their enzyme Complement in response to changing metabolic conditions. In vertebrates, the liver is the most adaptable organ; for example, replacing a carbohydrate-rich diet with a high-lipid diet affects the transcription of hundreds of genes and, consequently, the synthesis of hundreds of proteins. Such global changes in gene expression can be quantified using DNA Microarrays (see Fig. 9-22), which allow the Analysis of the entire set of mRNA molecules of a given cell type or organ (transcriptome), or by two-dimensional gel Electrophoresis (see Fig. 3-21), a method for studying all proteins of a given cell type or specific organ (proteome). Both Methods are extremely useful in metabolic regulation research. Changes in the proteome frequently entail changes in the entire ensemble of low-molecular-weight metabolites — the metabolome.
Once a specific amount of Each enzyme has been produced in the cell through the action of regulatory mechanisms controlling Protein Synthesis AND degradation, the activity of these enzymes is subject to further regulation: by changes in substrate concentrations; by the action of allosteric effectors; by covalent modification; or by the binding of regulatory proteins. All of these processes can alter the activity of individual enzyme molecules (Fig. 15-2, (7)-(10)).
All enzymes are sensitive to the concentration of their substrates (Fig. 15-2, (7)). Recall that in the simplest case (under Michaelis-Menten kinetics conditions), the initial reaction rate is equal to half the maximum velocity at a substrate concentration equal to the Km value (i.e., at half-saturation of the enzyme with substrate). As the substrate concentration [S] decreases, the reaction rate also decreases, and when [S] « Km, the reaction rate is linearly dependent on [S]. This is important to keep in mind, as the intracellular substrate concentration is often close to or below Km. For example, hexokinase activity depends on glucose concentration, and the intracellular glucose concentration varies with blood glucose levels. As we will see later, different forms (isoforms) of hexokinase have different Km values, and therefore, the presence of different hexokinase isoforms depends on the intracellular glucose concentration, which has distinct physiological significance.
Box 15-1. Glucose Transporter Activity
If the liver glucose transporter (GLUT2) has a Kt (the equivalent of Km) = 40 mM, determine The change in the rate of glucose influx (flux) into hepatocytes when the blood glucose concentration increases from 3 to 10 mM.
Solution. To determine the initial rate of glucose uptake, we use Equation 11-1 (Vol. 1, p. 555).
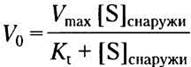
At 3 mM glucose:
V0 = Vmax (3 mM)/(40 mM + 3 mM) = Vmax (3 mM/43 mM) = 0.07 Vmax. At 10 mM glucose:
V0 = Vmax (10 mM)/(40 mM + 10 mM) = Vmax (10 mM/50 mM) = 0.20 Vmax
Thus, if the blood glucose concentration increases from 3 to 10 mM, the rate of glucose influx into hepatocytes increases nearly 3-fold (0.20/0.07).
Enzymatic activity can be increased or decreased by the action of allosteric effectors (Fig. 15-2, (8); see also Fig. 6-34). Under The Influence of allosteric effectors, reaction kinetics typically change from hyperbolic to sigmoidal, or vice versa (e.g., see Fig. 15-14b). In the steepest part of the sigmoidal curve, small changes in substrate or allosteric effector concentration can significantly affect the reaction rate. As discussed in Chapter 5 (p. 239, Vol. 1), the Hill cooperativity coefficient is used to describe The behavior of allosteric enzymes, with a large coefficient value indicating higher cooperativity. For an allosteric enzyme with a Hill coefficient of 4, a 3-fold increase in substrate concentration leads to an increase in reaction rate from 0.1 Vmax to 0.9 Vmax, whereas for a non-cooperative enzyme (Hill coefficient of 1; see Table 15-2), the same change in enzymatic activity requires an 81-fold increase in substrate concentration!
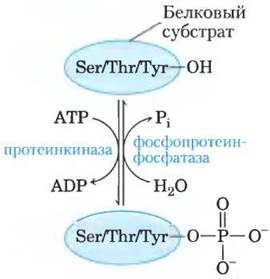
Covalent modifications of a pre-existing enzyme or other protein (Fig. 15-2, (9)) occur within seconds to minutes of receiving a signal, typically extracellular. The most common modification is phosphorylation-dephosphorylation (Fig. 15-3); up to half of all proteins in a eukaryotic cell undergo phosphorylation under certain conditions. Phosphorylation can alter the Electrostatic Properties of an enzyme's Active Site, shift an inhibitory protein segment away from the active site, affect the protein's interaction with other molecules, or induce conformational changes leading to alterations in Vmax and Km. For regulation to be effective, the cell must be able to return the protein to its initial state following covalent modification. A family of phosphoprotein Phosphatases, some members of which are themselves regulated, catalyze the dephosphorylation of proteins that have been phosphorylated by protein kinases.
Table 15-2. Relationship between the Hill coefficient and the Effect of Substrate concentration on reaction velocity for allosteric enzymes
Hill coefficient (nH) |
Fold increase in [S] required to increase V0 from 0.1 Vmax to 0.9 Vmax |
0.5 |
× 6600 |
1.0 |
× 81 |
2.0 |
× 9 |
3.0 |
× 4.3 |
4.0 |
× 3 |
Fig. 15-3. Protein phosphorylation-dephosphorylation. Protein kinases transfer a phosphoryl group from ATP to Ser, Thr, or Tyr residues in a protein. Protein phosphatases remove the phosphoryl group as Pi.
Finally, The regulation of many enzymes is achieved through the binding of regulatory proteins (Fig. 15-2, (10)). For example, cAMP-dependent protein kinase (PKA; see Fig. 12-6) remains inactive until cAMP binding causes the catalytic and Regulatory Subunits of the enzyme to dissociate.
The mechanisms discussed for influencing the rate of a specific metabolic pathway reaction are not mutually exclusive. Quite frequently, the same enzyme is regulated at the transcriptional level as well as by allosteric mechanisms and covalent modification. The combination of these mechanisms provides rapid and efficient regulation in response to a wide variety of cellular changes and incoming signals.
For our subsequent Discussion, it is useful to examine changes in enzymatic activity in the context of two distinct yet complementary functions. We will use the term metabolic regulation to describe the process aimed at maintaining homeostasis at the molecular level—that is, maintaining specific cellular parameters (such as metabolite concentrations) even when the metabolic flux through a pathway changes. We will refer to metabolic control as those processes that lead to A change in the output of a metabolic pathway over time in response to external signals or changing conditions. It should be noted, however, that drawing a sharp boundary between these two concepts is not always easy.
Typically, reactions far from equilibrium are regulated within the cell
At certain stages of a metabolic pathway, reactions approach equilibrium (Fig. 15-4). The overall flux of metabolites through such reactions is determined by the small difference between the forward and reverse reaction rates, which have similar values as equilibrium is approached. Small changes in the concentration of a substrate or product can dramatically alter the overall rate and even the direction of the process. We can identify these near-equilibrium reactions in the cell by comparing the mass-action ratio, Q, with the Equilibrium Constant, K'eq. Recall that for the reaction A + B —> C + D, Q = [C][D]/[A][B]. A reaction is generally considered close to equilibrium when Q and K'eq differ by only one to two orders of magnitude. For example, this is observed for six of the 10 reactions in glycolysis (Table 15-3).
Fig. 15-4. Equilibrium and nonequilibrium stages of metabolism. In the cell, steps (2) and (3) of this pathway are near equilibrium; their forward rates exceed their reverse rates only slightly, resulting in a rather low net rate (10), while the standard free-energy change, ∆G′, for each of these steps is close to zero. An increase in the intracellular concentration of metabolites C or D can reverse the direction of these steps. Step (1) in the cell is far from equilibrium—the forward reaction rate greatly exceeds the reverse reaction rate. The net rate of step (1) (10) is much greater than the reverse rate (0.01) and, in the steady state, equals the rates of steps (2) and (3). Step (1) is characterized by a large negative value of ∆G′.
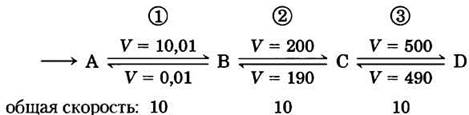
However, many cellular reactions are far from equilibrium. For instance, in the glycolytic reaction catalyzed by Phosphofructokinase-1 (PFK-1), K'eq ≈ 1000, whereas for a typical cell in a steady state, Q = [fructose-1,6-bisphosphate][ADP]/[fructose-6-phosphate][ATP] ≈ 0.1 (Table 15-3). It is precisely because this reaction is so far from equilibrium that the process is exergonic under intracellular conditions and proceeds strongly in the forward direction. The reaction remains far from equilibrium because, at normal intracellular concentrations of substrate, product, and effector, the rate of conversion of fructose-6-phosphate to fructose-1,6-bisphosphate is limited by PFK-1 activity, which is regulated by the number of PFK-1 molecules and the action of effectors. Thus, the forward rate matches the rate of the overall glycolytic flux through other steps of the pathway, while the reverse flux through the PFK-1 reaction is practically zero.
Table 15-3. Equilibrium constants, mass-action ratios, and free-energy changes for enzymatic reactions in carbohydrate metabolism
Enzyme |
K'eq |
Mass-action ratio, Q Liver Heart |
Near equilibrium in vivo?* |
∆G′ (kJ/mol) |
∆G′ in heart (kJ/mol) |
|
Hexokinase |
1 • 103 |
2 • 10-2 |
8 • 10-2 |
No |
17 |
-27 |
PFK-1 |
1.0 • 103 |
9 • 10-2 |
3 • 10-2 |
No |
-14 |
-23 |
Aldolase |
1.0 • 10-4 |
1.2 • 10-6 |
9 • 10-6 |
Yes |
+24 |
-6.0 |
4 • 10-2 |
- |
2.4 • 10-1 |
Yes |
+7.5 |
+3.8 |
|
Glyceraldehyde-3-phosphate dehydrogenase + |
2 • 103 |
6 • 102 |
9.0 |
Yes |
-13 |
+3.5 |
phosphoglycerate kinase |
||||||
Phosphoglycerate mutase |
1 • 10-1 |
1 • 101 |
1.2 • 10-1 |
Yes |
+4.4 |
+0.6 |
Enolase |
3 |
2.9 |
1.4 |
Yes |
-3.2 |
-0.5 |
Pyruvate kinase |
2 • 104 |
7 • 10-1 |
40 |
No |
-31 |
-17 |
Phosphoglucoisomerase |
4 • 10-1 |
3.1 • 10-1 |
2.4 • 10-1 |
Yes |
+2.2 |
-1.4 |
Pyruvate carboxylase + PEPCK |
7 |
1 • 10-3 |
— |
No |
-5.0 |
-23 |
Glucose-6-phosphatase |
8.5 • 102 |
1.2 • 102 |
— |
Yes |
-17 |
-5.0 |
* For simplicity, all reactions with ∆G′ < 6 kJ/mol are considered to be near equilibrium.
The cell cannot afford to let reactions with large equilibrium constants approach equilibrium. If the PFK-1-catalyzed reaction were to reach equilibrium at typical cellular concentrations of fructose-6-phosphate, ATP, and ADP (in the millimolar range), the concentration of fructose-1,6-bisphosphate would soar into the molar range, resulting in cell death due to extreme osmotic pressure.
Consider another example. If the ATP —> ADP + Pi reaction were to approach equilibrium within the cell, its free-energy change would approach zero (∆G ≈ 0; see Example 13-2, p. 31), and ATP would lose the high phosphoryl-group transfer potential that the cell critically requires. Therefore, it is vital that enzymes catalyzing ATP breakdown and other highly exergonic cellular reactions are tightly regulated. That is, when metabolic conditions shift due to external influences, these enzyme-catalyzed reactions are adjusted so that ATP concentrations remain well above equilibrium levels. Such metabolic adaptations involve coordinated adjustments of enzyme activities across interconnected pathways, preventing critical steps from reaching equilibrium. It is hardly surprising, therefore, that many enzymes (such as PFK-1) catalyzing reactions with large negative free-energy changes are intricately regulated by multiple mechanisms. This regulation is so complex that studying The properties of a single pathway enzyme in isolation cannot reveal its overall flux-control strength; this requires the principles of metabolic control analysis, which we will explore in Section 15.2.
Adenine NUCLEOTIDES play a special role in metabolic regulation
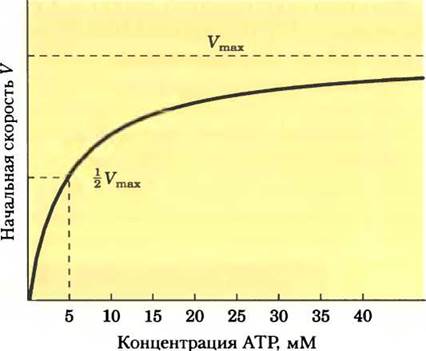
Arguably the second most important task for a cell (after safeguarding DNA integrity) is maintaining a constant supply of ATP. Many ATP-dependent enzymes have Km values between 0.1 and 1 mM, whereas the normal intracellular ATP concentration is about 5 mM. If ATP concentrations dropped significantly, these enzymes would fail to become saturated with their substrate (ATP), drastically reducing the rates of hundreds of ATP-dependent reactions (Fig. 15-5). A cell could hardly survive such a profound kinetic impact on so many processes.
Furthermore, a drop in ATP concentration has major thermodynamic consequences. Because cellular work involves the conversion of ATP to ADP or AMP, the [ATP]/[ADP] ratio profoundly influences the Thermodynamics of all reactions utilizing these Cofactors. The same applies to other key cofactors, such as NADH/NAD+ and NADPH/NADP+.
Fig. 15-5. Effect of ATP concentration on the initial velocity of a reaction catalyzed by a typical ATP-dependent enzyme. Based on these experimental data, the Km for ATP is approximately 5 mM. In animal tissues, the [ATP] is roughly 5 mM.
For example, consider the hexokinase reaction:
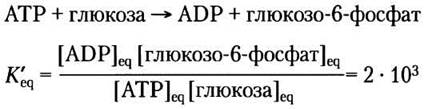
Note that this expression holds true only when reactants and products are at equilibrium concentrations, where ∆G′ = 0. Under all other conditions, ∆G′ ≠ 0. Recall (Chapter 13) that the mass-action ratio—the ratio of product concentrations to substrate concentrations—determines the magnitude and sign of ∆G′, and thus the driving force (∆G′) of the reaction:

Because shifts in this driving force affect every reaction involving ATP, organisms have evolved sophisticated regulatory mechanisms during the course of evolution specifically to maintain a stable [ATP]/[ADP] ratio.
The AMP concentration is far more sensitive to the energetic state of the cell than is the ATP concentration. Typically, intracellular ATP levels (5–10 mM) greatly exceed AMP levels (<0.1 mM). When ATP is consumed, such as During Muscle contraction, AMP is generated via a two-step process. First, ATP hydrolysis yields ADP, and subsequently, adenylate kinase converts ADP to AMP:
2ADP ⇌ AMP + ATP
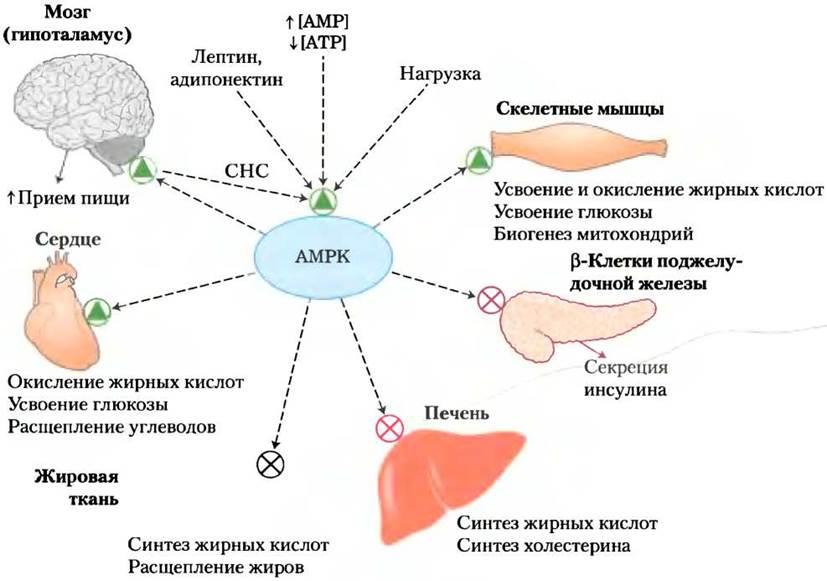
If the ATP concentration drops by 10%, the resulting relative increase in AMP concentration is vastly greater than that of ADP (Table 15-4). It is hardly surprising, therefore, that many regulatory pathways are tied directly to AMP levels. A key mediator of this regulation is AMP-activated protein kinase (AMPK), which is triggered by rising AMP levels to phosphorylate target proteins, thereby modulating their activity. An elevation in [AMP] typically signals nutrient deprivation or high physical exertion. Activation of AMPK (not to be confused with cAMP-dependent protein kinase, see Section 15.5) stimulates glucose transport, glycolysis, and Fatty acid oxidation, while simultaneously suppressing energy-demanding processes such as the synthesis of fatty acids, Cholesterol, and proteins (Fig. 15-6). We will discuss this enzyme and its MECHANISM OF ACTION in greater detail in Chapter 23.
Table 15-4. Relative changes in ATP and AMP concentrations upon ATP or functional group depletion
Adenine nucleotide |
Concentration before ATP consumption (mM) |
Concentration after ATP consumption (mM) |
Relative concentration change |
ATP |
5.0 |
4.5 |
10% |
ADP |
1.0 |
1.0 |
0 |
AMP |
0.1 |
0.6 |
600% |
Fig. 15-6. The Role of AMP-activated protein kinase (AMPK) in lipid and carbohydrate metabolism. During physical exertion, AMPK is activated in response to an increase in AMP concentration or a decrease in ATP concentration, driven by signals from the sympathetic Nervous system (SNS) or adipose tissue hormones (leptin and adiponectin; see Chapter 23 for details). Activated AMPK phosphorylates key proteins, thereby regulating metabolism across multiple tissues: it suppresses energy-demanding processes such as the synthesis of glycogen, fatty acids, and cholesterol; directs extrahepatic metabolism toward the utilization of fatty acids as fuel; and triggers gluconeogenesis in the liver to supply the brain with glucose. In the Hypothalamus, AMPK stimulates feeding behavior to ensure the organism acquires more nutrients.
Along with ATP, a cell must maintain appropriate concentrations of hundreds of metabolic intermediates. For instance, the glycolysis intermediates dihydroxyacetone phosphate and 3-phosphoglycerate serve as precursors for triacylglycerols and Serine, respectively. When needed, the rate of glycolysis must be adjusted to supply adequate amounts of these substances without compromising ATP production. This same principle applies to other vital cofactors, such as NADH and NADPH: shifts in their mass-action ratios (i.e., the ratio of the reduced cofactor concentration to its oxidized counterpart) exert a profound influence on metabolism.
Naturally, the evolutionary development of regulatory mechanisms has also been shaped by the physiological priorities of the whole organism. Mammalian brains possess virtually no energy reserves and thus rely entirely on a continuous supply of glucose via the bloodstream. When blood glucose drops to half its normal level (4–5 mM), brain function becomes impaired, whereas a fivefold decrease induces a comatose state and death. Blood glucose is maintained within the normal range by the hormones insulin and Glucagon, which are secreted in response to high and low glucose levels, respectively; these hormones trigger a cascade of metabolic reactions aimed at restoring glucose homeostasis.
In addition, evolutionary pressures must have driven other selective forces, giving rise to regulatory mechanisms tailored to specific physiological demands.
1. Maximizing energetic efficiency by preventing the simultaneous operation of opposing metabolic pathways (e.g., glycolysis and gluconeogenesis).
2. Partitioning metabolites between alternative metabolic routes (such as glycolysis and The pentose phosphate pathway).
3. Selecting the most appropriate energy source to meet the organism's immediate demands (glucose, fatty acids, glycogen, or Amino Acids).
4. Shutting down biosynthetic pathways upon the accumulation of their end products.
Subsequent chapters provide numerous examples of each type of regulatory mechanism.
Summary of Section 15.1. Regulation of Metabolic Pathways
■ In a metabolically active cell at steady state, metabolic intermediates are formed and consumed at equal rates. If an external perturbation alters the rate of formation or consumption of a metabolite, the cell mounts a compensatory adjustment in enzyme activities to restore the steady state.
■ Cells regulate their metabolism through diverse mechanisms operating over time scales ranging from milliseconds to days, by altering the activity of preexisting enzymes or the synthesis rates of specific enzyme molecules.
■ Various signaling pathways can activate or inactivate transcription factors that control GENE EXPRESSION IN The Nucleus. Alterations in the transcriptome lead to changes in the proteome and, ultimately, in the metabolome of a cell or tissue.
■ In multi-step processes such as glycolysis, some reactions remain near equilibrium at steady state; their rates are governed by substrate concentration and fluctuate accordingly. Other reactions are far from equilibrium and typically control the overall flux through the pathway.
■ Regulatory mechanisms ensure that intracellular levels of key metabolites—such as ATP, NADH, or blood glucose—remain nearly constant, while glycogen stores are mobilized to meet shifting physiological demands.
■ The levels of ATP and AMP reflect the energy status of the cell; when the [ATP]/[AMP] ratio drops, AMP-activated protein kinase triggers various cellular processes designed to boost ATP concentration and diminish AMP.
Last update: 06/08/2026
Editorial and Educational Adaptation: This material has been compiled based on the primary/original source text. The project team performed an editorial review, corrected technical inaccuracies, structured sections, and adapted the content for an educational format.
What was processed:
- elimination of formatting defects (OCR errors, structural breaks, corrupted characters);
- editorial organization of content;
- standardization of terminology in accordance with academic sources;
- verification of factual statements against the original source text.
All mentions of the author, publication year, and origin of the primary text have been preserved in accordance with the source.