Fundamentals of Molecular Biology. Part 2: Molecular Genetic Mechanisms - A. N. Ogurtsov 2011
Genomics and Proteomics
DNA Microarrays
DNA microarray analysis is a method used for the simultaneous monitoring of thousands of genes expression.
A DNA microarray consists of thousands of individual, densely packed sets of Gene sequences attached to a Glass substrate.
Combining this technique with genome sequencing results allows researchers to study the overall pattern of an Organism's Gene Expression during a specific physiological response or differentiation process.
One method of preparing a DNA microarray is as follows (Figure 117).
First, gene segments approximately 1 kb in length are amplified via PCR. Then, an automated device spots each amplified sample onto a Microscope slide in a checkered pattern, forming a 2x2 cm array containing 6,000 DNA samples.
Next, the microarray is chemically treated to firmly anchor the DNA fragments to the glass and denature the double strands.
Class="center">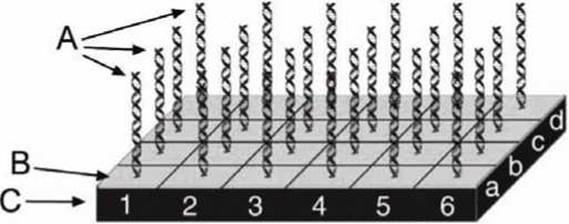
Figure 117 - Schematic diagram of a DNA microarray: A - DNA samples; B - coverslip; C - microscope slide; each sample has an "address" (e.g., 1-a)
Alternatively, DNA microarrays can be produced using a method where oligonucleotides are chemically synthesized directly on a glass substrate, starting from the first nucleotide covalently bound to the surface. Because this technology was adapted from semiconductor integrated circuit manufacturing, these are referred to as DNA chips.
To analyze gene expression, fluorescently labeled cDNA probes are first prepared corresponding to the mRNAs expressed by the Cells in the given study.
The DNA microarray is then placed into a solution containing these labeled cDNAs, which hybridize with their complementary spots on the array. The Hybridization results are detected using a scanning laser microscope, generating a map of fluorescence intensity for each feature on the array (Figure 118).

Figure 118 - Fluorescence intensity Distribution of a DNA microarray
Using this approach, researchers investigated, for instance, GENE EXPRESSION IN Yeast depending on whether glucose or ethanol served as the carbon and energy source.
To do this, yeast cDNA grown in different media were labeled with distinct fluorescent tags. In Figure 119, these tags are depicted as black and white ellipses (while the actual experiment utilized red and green labels, respectively).
The DNA microarray, containing about 6,000 genes, was placed in a mixture containing equal amounts of cDNA derived from cells grown in ethanol and glucose media. Following hybridization, the residual mixture was washed away, and the fluorescence intensity of each spot was analyzed using a microscope.
The relative intensity of red or green emission (represented in Figure 119 by black, white, or mixed gray ellipses) corresponded to the relative expression level of a given gene (corresponding to that specific array spot) in the glucose versus ethanol medium.

Figure 119 - Determining The Effect of the carbon source on yeast gene expression: a - DNA microarray in the cDNA mixture; b - fluorescence of microarray spots after hybridization with cDNA
If the expression level of a particular gene was identical in both media, the spot glowed yellow (yellow being a mixture of green and red). Genes that were not transcribed at all under the experimental conditions produced no fluorescent signal.
Using this method, it was determined that switching from a glucose-containing medium to an ethanol-containing medium approximately doubled the expression of 710 genes, while suppressing the expression of another 1,030 genes by more than half. Although the Functions of about 400 of these genes remain unknown, this finding represents a crucial first step toward elucidating their roles in yeast biology.
Last update: 12/08/2026
Editorial and Educational Adaptation: This material has been compiled based on the primary/original source text. The project team performed an editorial review, corrected technical inaccuracies, structured sections, and adapted the content for an educational format.
What was processed:
- elimination of formatting defects (OCR errors, structural breaks, corrupted characters);
- editorial organization of content;
- standardization of terminology in accordance with academic sources;
- verification of factual statements against the original source text.
All mentions of the author, publication year, and origin of the primary text have been preserved in accordance with the source.