BOTANY VOLUME 2 - PLANT PHYSIOLOGY - 2007
6. PHYSIOLOGY OF METABOLISM
6.3. Water Relations
Water in a living Cell serves not only as a universal solvent but also as a substrate in Cellular metabolic processes, such as an electron and proton donor during Photosynthesis (see 1.1). As the primary constituent of living Cells, water also fulfills a structural function. During plant growth, the vast majority of
size increase is driven by water ("growth water"). Because plants must absorb gaseous CO2 from the atmosphere for photosynthesis, and evolution has failed to produce a protective barrier that is permeable exclusively to CO2 and impermeable to water, plants are forced to continuously lose water via evaporation (Transpiration) (see 6.3.4.1). This "transpirational water" must be replenished to prevent a loss of turgor. In terrestrial plants, water evaporation additionally provides a certain degree of cooling, although this function is not strictly vital. This is evidenced, in particular, by the adaptations of many plants in hot, arid regions—the so-called CAM plants (see 6.5.9): their Stomata remain closed throughout the day, which severely limits transpiration. Nevertheless, under high temperatures, plants reduce rather than increase transpiration. Water uptake generally occurs through the same Organs responsible for the Absorption of mineral nutrients and is energetically coupled with it; therefore, water relations are typically discussed alongside Plant Mineral Nutrition. In doing so, researchers focus primarily on terrestrial higher plants (bryophytes and seed plants). Regulated water relations are of paramount importance to them, as they inhabit environments typically characterized by water scarcity (relatively dry soils, dry air).
Plants cannot transport water actively (see 6.1.4.2). It constantly moves passively—both over cellular and macroscopic distances—along its chemical potential gradient, i.e., from a region with a more positive water potential to a region with a more negative water potential (Equations 6.10, 6.15), with a concomitant decrease in the free enthalpy of water. Consequently, water transport is an exergonic process that occurs spontaneously.
The continuous pathway of water from the soil through the ROOT, then via the xylem transport system into the Tissues and ultimately to the sites of evaporation, as well as the water-loss processes themselves, can be analyzed energetically based on The water potential concept; however, the driving forces and transport mechanisms vary across different stages of water movement. For the sake of clarity, it is therefore helpful to separate the stages of water uptake, transport, and evaporation. Let us first examine the transport mechanisms and cellular water relations.
Water movement is based on two fundamental mechanisms: diffusion and bulk flow.
Diffusion is defined as the passive mixing of particles resulting from thermal motion, which is random with respect to any individual particle. Through diffusion (when observed across many particles), a net flow of a substance occurs in a specific direction if differences in the chemical potential of that substance exist within the diffusion space. In a mixed phase (e.g., a solvent with dissolved solutes), all components for which a chemical potential gradient exists—including the solvent itself—undergo a net flow until the differences in chemical potential are eliminated (see 1.4). In most cases, a concentration gradient is the underlying cause of the chemical potential difference that drives the diffusion process.
The term "flux" ("diffusion rate", Ji) denotes the diffusing mass of substance i per unit area and per unit time. The dependence of the flux on the concentration gradient 1 over a distance x (∆ci/∆х) perpendicular to the cross-sectional area is described by Fick's first law of diffusion:
Class="center">
and can be expressed in [mol m-2 s-1]. Thus, The rate of diffusion is directly proportional to the concentration gradient of the diffusing substance. The proportionality factor D is termed the diffusion coefficient (m2 s-1). Under constant Temperature and pressure conditions, D is specific to a given substance and additionally depends on the diffusion medium. Gases, particularly CO2 and O2, diffuse in air approximately 105 times faster than in water (CO2 in air: 1 cm s-1, in water: 10-5 cm s-1). The negative sign in the equation indicates that a positive substance flux is observed in the direction of the decreasing concentration gradient (from higher to lower substance concentration).
The velocity of molecular motion increases with rising temperature; hence, the rate of diffusion is proportional to temperature (and drops to zero at absolute zero, 0 K).
Fick's second law defines the relationship between the distance (x) traveled by a diffusing substance over a given time interval (t):

Thus, the distance covered via diffusion is proportional to the square root of time. The proportionality factor k has the dimension [m s-1/2]. Consequently, diffusion is a transport mechanism effective only over very short distances and is inadequate for bridging large distances.
This is supported by some numerical Examples. Here is how the dye fluorescein diffuses in water (at a constant temperature and concentration gradient): in one second—87 µm; in one minute—approximately 675 µm; in one hour—approximately 5 mm; and in one year—only about 50 cm. Therefore, diffusion is entirely efficient within the scale of plant cells. However, under prevailing concentration gradients and other conditions, a sugar molecule produced, for example, in a leaf at the crown of a 30-meter-tall tree would never reach the root purely by diffusion during the lifetime of the tree, just as a nutrient absorbed by the root would never reach the leaf in this manner.
Fig. 6.25. Diffusion of Water molecules across Introduction/36.html">Biological Membranes and channels formed by water-specific Proteins, Aquaporins

As a mechanism of water movement, diffusion is important for:
✵ partially, water transport between the soil solution and the apoplast;
✵ water transport between the apoplast and the symplast;
✵ water transport across cellular membranes;
✵ Movement of water from the apoplast into the intercellular air spaces, for instance, in leaves;
✵ movement of water from the intercellular air spaces into the atmosphere.
Rapid water diffusion across cell membranes remained poorly understood for a long time. It is currently believed that the negligible resistance to water diffusion offered by cell membranes (water diffuses across a cell membrane almost as easily as through a water layer of equal thickness) is due to the fact that water molecules diffuse, firstly, through "defects" or "pores" in the fluid lipid bilayer, and secondly, through channels formed by water-specific proteins called aquaporins, located in The Cell membrane (Fig. 6.25). By regulating the number of aquaporins and their phosphorylation, the cell can modulate the permeability of its membranes to water in response to changing demands.
Diffusion is unsuitable for long-distance water transport. Here, mass flows of water take place. They are characteristic of
✵ water transport in xylem vessels,
✵ water transport in soil,
✵ depending on circumstances, water transport in the apoplast, for example, in leaves and roots,
✵ mass flow also forms The basis of phloem transport.
While the concentration potential gradient of water is considered the driving force of diffusion, mass flow is driven primarily by the pressure potential gradient between two locations (see 6.3.5, 6.8.3). Thus, the component potentials contribute differently to The formation of the chemical potential (or water potential), thereby providing the driving force for water transport via either diffusion or mass flow.
The dependence of mass flow on the pressure potential gradient is described by the Hagen-Poiseuille law, which strictly holds true only for ideal capillaries.

Consequently, the volume flow ∆V/∆t (expressed, for example, in [m3 s-1]) at a constant capillary radius r and for a fluid with constant viscosity ɳ is directly proportional to the applied pressure gradient ∆p/∆x. Furthermore, for given values of ∆p/∆x and ɳ, it strongly depends on the capillary radius: upon doubling the radius, the volume flow per unit time increases sixteenfold (24 = 16). The negative sign indicates that a positive flow moves in the direction of decreasing hydrostatic pressure (∆p/∆x < 0).
Note that p is identical to the pressure potential from the water potential equation (see equation 6.15), whereas π in equation 6.32 is the mathematical constant "pi" derived from the geometry of a circular capillary and must not be confused with the osmotic pressure Π in the water potential equation.
6.3.2. Water Relations of the Cell
6.3.2.1. Osmosis
The uptake and release of water by cells occur predominantly through osmotic processes, with diffusion acting as the transport mechanism. Osmosis is defined as the diffusion of particles through a selectively permeable membrane, such as a biological membrane (see 2.2.5). This membrane is highly permeable to the solvent (water), but completely (in the ideal case) or only slightly permeable to the solutes dissolved in it. If a selectively permeable membrane separates two solutions with different solute concentrations, a water potential gradient also arises across the membrane ( , where
  is more negative on the side with the higher solute concentration). Water molecules diffuse along their concentration gradient from the more dilute to the less dilute solution, which can be demonstrated experimentally using an osmometer (Pfeffer cell, Fig. 6.26). As a result (due to dilution), the volume of the concentrated solution increases, and hydrostatic pressure builds up. The uptake of water by a compartment with a negative water potential continues until the hydrostatic pressure generated by the water flow balances the water potential difference between the two compartments
  .
.
Fig. 6.26. Scheme of an osmometer (Pfeffer cell)

A living cell Functions as such an osmometer. The Plasmalemma and (since osmolytes accumulate mainly in the vacuolar sap) the tonoplast serve as the selectively permeable membranes. When water is sufficiently available, the cell takes up water osmotically until it reaches the state of  . Because
elastic cell walls allow only a restricted increase in volume, osmotic water influx rapidly generates hydrostatic pressure within the cell, also known as turgor or turgor pressure. An additional contribution to the tissue pressure potential is provided by surrounding turgid cells, which counteract the expansion of the water-absorbing cells.
At THE CELLULAR LEVEL, the gravitational potential is negligible, and the WATER POTENTIAL OF a cell (or tissue) can thus be expressed by equation 6.15 (see 6.1.4.2):
 where p is the hydrostatic pressure, turgor; -Π is the osmotic potential.
The water potential of a cell (tissue)  ranges from
  (if p = Π) to
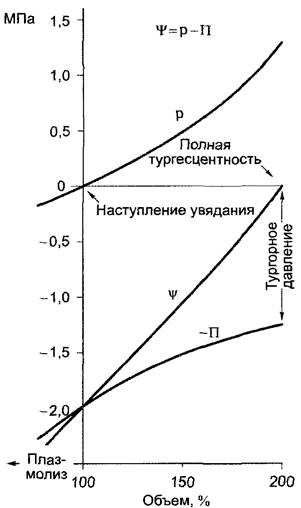
  = -Π (if p = 0). The water potential becomes zero if the turgor pressure of the cell is completely balanced by the osmotic potential (full turgidity); in the absence of turgor (p = 0, wilting state), the cell (tissue) develops the maximally negative water potential, the magnitude of which is determined by Π, reflecting the total concentration of all osmolytes in the cell (tissue). The relationships
between  , p, Π, and cell volume are illustrated in Fig. 6.27.
Fig. 6.27. Changes in state parameters during osmotic Water uptake and loss by a plant cell
Alongside Organic compounds (such as sugars and organic acids), cellular osmotics consist to an even greater extent of inorganic salts that accumulate in the Cytoplasm, but predominantly in the vacuole, i.e., in the cell sap (see 6.2.3). Quantitatively, K+ and its counterions (Cl- and/or organic acids such as malate) are The most significant osmotics. The total concentration of osmotics in the cell sap generally ranges from 0.2 to 0.8 M. In certain cells (e.g., guard cells of stomata, see 8.3.2.5), this concentration can undergo significant and reversible changes. A 0.1 M KCl solution at 25 °C has an osmotic potential of -0.46 MPa.
The osmotic potential of a cell can be determined experimentally by observing plasmolysis. Plasmolysis (see Fig. 2.60) refers to the detachment of the protoplast from The Cell wall as a result of its shrinkage in a hypertonic medium (i.e., a medium for which  holds, where C is the medium and K is the cell). Under these conditions, the cell loses water until
  is equalized (due to the water efflux, the pressure potential—turgor—initially drops rapidly, and ultimately, as water loss continues, П increases; during this process,
  becomes increasingly negative until its value reaches
  ). In a hypotonic medium (
 ), The process of plasmolysis is reversible, which is known as deplasmolysis. Deplasmolysis also occurs eventually in a hypertonic medium, as extracellular osmotics slowly equalize their concentrations via diffusion across cell membranes, allowing the cells to adjust their endogenous osmotic concentrations to match the medium.
If we now place a cell (or cells within a tissue) into solutions with various concentrations of osmotics and find the (isotonic) solution in which incipient plasmolysis is observed (a state where, due to water leaving the cell, the protoplast is just beginning to pull away from the cell wall) and accordingly turgor reaches exactly zero (p = 0), then

However,  equals -Пс, since a solution in equilibrium with its external environment exhibits no hydrostatic pressure, and therefore Пс = Пк.
Another METHOD FOR DETERMINING the osmotic potential of cell sap is cryoscopy (from Greek kryos – frost) of extracted cell saps, which involves determining the depression of the freezing point.
Osmotic potentials can vary quite significantly not only among individual plant species (Fig. 6.28), but also within different organs and tissues of a single plant. In root cortex parenchyma cells, osmotic potential values range between -0.5 and -1.5 MPa; in shoots, as a rule, they become more negative with increasing distance from the root, reaching values of -3 to -4 MPa in leaf tissue cells. Typical values for beech leaves are: lower epidermis, -1.4 MPa; spongy parenchyma, -2.1 MPa; palisade parenchyma, -3.8 MPa. In plants growing in very dry habitats, such as deserts, or on saline soils, such as seashores or salt deserts, the osmotic potentials of cell saps can reach values more negative than -10 MPa (Limonium on saline soil < -16 MPa, Atriplex < -20 MPa). Some Molds are even capable of growing on concentrated sugar solutions (e.g., fruit jelly) with substrate osmotic potentials down to -22 MPa.
Fig. 6.28. Variations in the osmotic potential of sap expressed from leaves of plants belonging to various ecological types. The given amplitude is derived from the differences between the lowest and highest values found for species within the same ecological group

Plants that tolerate large fluctuations in osmotic potential without damage are called euryhydric. Stenohydric1 species are tolerant only within a narrow osmotic amplitude (Fig. 6.28).
1 These terms are not widely used. — Editorial note.
Under natural conditions, plant Cells and Tissues only rarely reach the point of full turgidity (p = П,  ), but instead possess a more or less negative water potential. This can be measured, for example, using the compensation method (Fig. 6.29), in which tissue segments of known mass are equilibrated in media with various water potentials (e.g., sucrose solutions) and then re-weighed.
Fig. 6.29. Compensation method for determining the water potential of tissue pieces by recording weight changes before and after immersion in solutions of a non-penetrating osmotic agent with various osmotic potentials (water potentials)
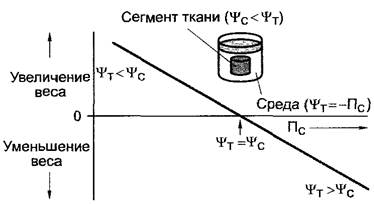
In a hypertonic medium ( ), the tissue will lose water, whereas in a hypotonic medium (
 ) it will absorb water. From the plot of mass changes as a function of
  , one can find by interpolation the point where no change in the mass of the tissue segment is detected (
 ; see above), and hence
 Thus, the water potential of the tissue
  is equal to the osmotic potential -Пс of the solution in which no net water flux (and therefore no mass change) is observed in the tissue.
In addition to the osmotic movement of water molecules between regions with different solute concentrations, matrix effects play a role in water relations within the protoplasm and, especially, cell walls. These purely physical processes are collectively termed imbibition (or Swelling). This involves, on the one hand, the formation of water shells (Hydration) around polar macromolecules such as Polysaccharides and proteins, and, on the other hand, capillary phenomena, such as capillary entrapment of water between microfibrils and interfibrillar spaces of the cell wall. In both cases, the effects on water potential can be evaluated based on the generation of local, highly negative hydrostatic pressures in thin (several molecular layers thick), highly curved water films. The cause for this is the high surface tension of water (γ = 7.28 · 10-8 MPa · m).
The relationship between the pressure potential p from the water potential equation (Eqs. 6.14; 6.15) and the surface tension of water γ is expressed by the equation

where r is the radius of curvature of the meniscus.
If r is very small, the local hydrostatic pressure becomes heavily negative and, accordingly, so does the water potential. This occurs, for example, when cell walls and protoplasts dry out (in dry seeds or lichen thalli), but it is also of significance for root cell walls in dry soils and for transpiring leaves, and accounts for the strongly negative water potentials of dry soils.
On the other hand, hydrated structures in an aqueous environment (e.g., proteins in aqueous solution, structural polysaccharides in water-saturated cell walls) make only a minor contribution to the total water potential because r becomes relatively large (Fig. 6.30).
Fig. 6.30. Appearance of locally very negative hydrostatic pressure potentials in strongly curved, thin water films. On the left, for example, hydration shells around cell wall filaments, soil colloids, and proteins. With more complete water saturation (right), effects due to large radii are very limited. Therefore, cytoplasmic proteins make only a strictly limited contribution to establishing the water potential of the cell

In systems where the water potential is determined by matrix effects (e.g., in dry seeds and cell walls, as well as in soils), making it difficult to determine p and -Π separately, their combined determination proves useful, and this value is designated as the matric potential τ (also referred to as the matric water potential). It should also be noted that matric potential is not established by any novel forces, but exclusively by those calculated from the chemical potential equation of water (Equation 6.10). From this it follows that there is no need to add an additional component τ to the general water potential equation.
Taking into account what has been discussed in Sections 6.3.1 and 6.3.2 will help to better understand the water relations of the entire plant Organism.
6.3.3. Water Uptake by the Plant
Thallophytes, which have not yet developed protection against transpiration, are able to absorb water across their entire surface from moist substrates or following wetting by raindrops or dew. In this process, not only osmosis in the hydrated state of the thalli can play a significant role, but also matric potentials in dried specimens. Upon drying, certain Algae, Lichens, and specific mosses develop such substantial negative water potentials (< -100 MPa, see Table 6.11) that they are still capable of absorbing water vapor from the air in amounts sufficient to maintain positive net photosynthesis without liquid water supply. The swelling process also contributes to water uptake in dry seeds.
Table 6.11. Relative water vapor concentration (percentage relative humidity) of air in equilibrium with a solution of a specific osmotic potential at 20 °C in a closed system
Relative humidity of air, % |
-Π, MPa |
Relative humidity of air, % |
-Π, MPa |
100 |
0 |
94,0 |
-8,32 |
99,5 |
-0,67 |
93,0 |
-9,79 |
99,0 |
-1,35 |
92,0 |
-11,2 |
98,5 |
-2,03 |
91,0 |
-12,6 |
98,0 |
-2,72 |
90,0 |
-14,1 |
97,5 |
-3,41 |
80,0 |
-30,1 |
97,0 |
-4,10 |
70.0 |
-48,1 |
96,0 |
-5,50 |
60,0 |
-68,7 |
95,0 |
-6,91 |
50,0 |
-93,3 |
Submerged aquatic plants, which have a highly permeable cuticle or lack it entirely, absorb water across their entire surface via osmosis. Certain terrestrial plants possess specific water-permeable regions on their aerial parts, such as trichomes, the inner bases of needle pairs (e.g., in pines), or specialized swellable "absorbing scales" (e.g., in epiphytic bromeliads, Bromeliaceae, see 11.2, Fig. 4.74). These permeable areas are uncurinized or only weakly cutinized and absorb water primarily through capillary phenomena. They function predominantly under dry conditions by undergoing corresponding positional changes upon severe water loss.
Aerial roots of certain epiphytes, such as orchids of the genus Dendrobium, feature a water-absorbing tissue known as velamen (see 4.3.3.3, Fig. 4.73), which retains water by capillary forces. Water is subsequently taken up from this reservoir by the roots via osmosis.
Terrestrial higher plants (ferns, seed plants) absorb water predominantly through their roots (with the exception of the aforementioned specialized SHOOT structures), because the cuticle or cork tissue of the shoot typically offers high resistance to water diffusion. Consequently, water uptake by above-ground parts plays virtually no role, even after wetting by dew or rain. Water also fails to penetrate open shoot stomata due to its high surface tension; it is assumed that the same holds true for lenticels.
The process of water uptake by the root can be divided into several stages:
✵ uptake of water by cells from the apoplast;
✵ supplemental movement of absorbed water from the soil solution into the apoplast;
✵ transport of water within the root to the xylem vessels.
Water uptake by the root from the soil is possible only when a corresponding water potential gradient  exists. The water potential of the soil is only partially determined by osmotic phenomena, as the soil solution is very dilute (typical values for
  are close to -0.02 MPa, and in saline soils ≤ -0.2 MPa). To a large extent, it is governed by the pressure potential (matric potential), which fluctuates strongly depending on soil moisture (for its origin, see Equation 6.34). In water-saturated soils following precipitation or in deeper soil layers near the groundwater table, this potential is close to zero
Part of the water that enters the soil as precipitation is adsorbed as "adhesion water, or film water" and is retained in capillaries, while another part percolates down to the groundwater table as "gravitational water." In general, only a greater or lesser fraction of the "film water" remains available to The Root System. The water-holding capacity of the soil for "film water" (grams of H2O per 100 ml of soil volume) is referred to as its water-holding capacity (field capacity). It increases with the content of fine-grained and organic material in the soil, and thus rises in the series from sand to loam and clay, and especially to marshy soils. The finer and more porous the soil particles, the more negative the water potentials become upon drying (see Equation 6.34).
As the water content in the soil decreases, its water potential becomes more negative. It easily reaches values of -2 MPa and lower. As previously discussed, root water potentials are mainly determined by the osmotic potentials of the cell sap. Within certain limits, they can adjust to current demands through Changes in the concentration of osmolytes, and they also vary substantially depending on the species. For instance, in beans (Phaseolus), the osmotic potentials in root cells range from -0.2 to -0.35 MPa, in pelargonium (Pelargonium) they are -0.5 MPa, in halophytes (su
cculents) they are less than -2 MPa, and in desert plants even less than -10 MPa. These values are sufficient to extract the bulk of its "film water" from any soil.
Water uptake by the root can be described by the formula

Accordingly, the mass of water absorbed by the root system per unit time Wa is directly proportional to the root surface area A adapted for water uptake (essentially the surface area of the root hairs) and the water potential gradient between the root and the soil, and inversely proportional to the sum of all resistances to water transport in the soil and during entry from the soil into the plant (Σr).
The surface area of root hairs adapted for water uptake often reaches very large dimensions. For example, in a single rye plant whose roots permeated a soil volume of 56 l, the total number of living root hairs was 1.43 · 1010, and their total surface area was estimated at 400 m2, thus exceeding the total transpiration-related contact surface of leaf mesophyll cells with intercellular spaces (see 6.3.4.1) by more than 10-fold.
The root Hair zones of root tips are consequently the primary sites for the uptake of both water and ions. However, root hairs are absent in plants with ectomycorrhizae (see 9.2.3). In this case, the symbiotic mycorrhizal fungus takes over the Functions of the root hairs. Root hairs come into very close contact with the soil (see Fig. 6.20). From the apoplasts, which are in equilibrium with the soil solution, water enters the root hairs via osmosis, thereby lowering the hydrostatic pressure within them. The resulting pressure gradient in the soil solution additionally supplies water to the apoplast via mass flow (capillary flow). The uptake of soil water in the root hair zone lowers the hydrostatic pressure and, consequently, the water potential of the soil in the root hair zone relative to deeper and thus unpenetrated neighboring zones. Water moves by mass flow along the pressure gradient.
However, this hydraulic conductivity of the soil depends heavily on the soil type and, even in fine-pored soils (such as clay) with relatively good conductivity, proceeds only very slowly and over very
short distances (at most a few centimetres). Plants overcome this challenge because roots grow towards moisture. In the process, PARTS OF THE root system may die back while others proliferate intensively in areas of the soil richer in water, meaning the entire root system can develop quite asymmetrically. Given appropriate water potential gradients, roots can also release water back into the soil. Consequently, roots can facilitate water transport from wetter, generally deeper soil layers to drier, predominantly upper layers (known as hydraulic lift) (see Fig. 13.25).
A significant reduction in water uptake at low temperatures (for many plants, already at a few degrees above 0 °C), alongside increased resistance to transport within the soil and decreased water permeability of the plasmalemma, is primarily responsible for the inhibition of root growth. At temperatures below -1 °C, the film water in the soil freezes, making water uptake impossible ("winter drought"); the consequences of this are frequently misinterpreted as frost damage.
If the soil dries out to such an extent that the entire root system cannot obtain sufficient water, fails to absorb it altogether, or even loses water due to a Reversal of the water potential gradient, plant wilting occurs, which becomes irreversible at a specific soil water potential. Grasses adapted to moist conditions reach this state at soil water potentials of approximately -0.7 to -0.8 MPa, most agricultural crops at -1 to -2 MPa, and plants of moderately dry habitats alongside various woody species at -2 to -3 MPa. In agricultural practice, a soil water potential of -1.5 MPa is taken as the permanent wilting point.
Within the root, water can diffuse through the symplast along an osmotic potential gradient that becomes increasingly negative towards the endodermis. Since water in the cortex can also be taken up osmotically by cells from the apoplast right up to the barrier formed by the Casparian strips, additional
movement of water into the apoplast from the peripheral zone of the root via radial mass flow is also possible. Water enters the central cylinder (stele) of the root by osmotic means—particularly when the plant has a good water supply, and more restrictedly when transpiration is absent (e.g., at night). The transport of ions from the endodermis and vascular parenchyma into the apoplast of the central cylinder leads to a drop in its water potential, which drives the movement of water from the cells into the apoplast.
Under conditions of a good water supply and limited transpiration, a positive hydrostatic pressure—known as root pressure—develops in the xylem of the roots. Thus, the second essential function of the Casparian strips and the endodermis, alongside their barrier function against dissolved Components of the soil solution diffusing through the apoplast towards the central cylinder, is to "concentrate" the Contents of the central cylinder, thereby enabling root pressure. This pressure can be measured by cutting the shoot slightly above the root and attaching a manometer to the remaining stem; it is usually <0.1 MPa, though in birches it can rise to 0.2 MPa or more, and in tomato plants it can exceed 0.6 MPa.
Thus, under certain conditions (see above), root pressure contributes to long-distance water transport.
With less abundant water supply or more intensive transpiration (see 6.3.4), sufficient water is still continuously supplied to the xylem to prevent the generation of positive hydrostatic pressure; consequently, negative hydrostatic pressure (and accordingly a negative water potential) also dominates in the root region. The existence of a negative water potential can lead to the withdrawal of water from the protoplasts of endodermal and vascular parenchymal cells, causing their osmotic potential (and consequently their water potential) to become more negative: water either diffuses through the symplast from the peripheral zone of the root or flows out of the apoplast of the root cortical parenchyma. In this physiological situation, the Casparian strips are also crucially important as a barrier because they restrict the uncontrolled "leaking" of the soil solution.
6.3.4. Water release by plants
Plants release the majority of absorbed water in the form of water vapour ("transpiration water", transpiration, see 6.3.4.1), while a portion of the water serves to increase the volume of the growing plant ("growth water"). In special cases, water is expelled from the plant in the form of droplets and streams (guttation, see 6.3.4.2).
In fast-growing herbaceous plants, growth water can account for a significant proportion of the overall water balance; for instance, in maize it makes up 10 – 20 % of the transpiration water. Transpiration serves as a major driving force for the long-distance transport of water in the xylem when stomata are open. Xylem water flow is also maintained when stomata are closed (e.g., at night), when transpiration is reduced (due to high relative air humidity), and even when transpiration is almost entirely suppressed (experimentally) in air saturated with water vapour. Xylem sap flow is driven by:
✵ the generation of root pressure (see 6.3.3);
✵ the presence of strongly negative osmotic potentials in peripheral organs with high metabolic activity, especially photosynthetically active leaves, which also "bind" the predominant share of growth water within the shoot;
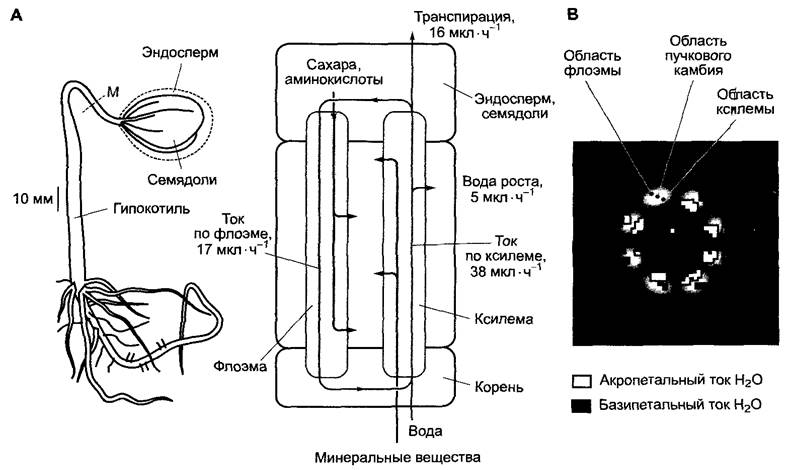
✵ the flow of water via the phloem, which is balanced by xylem water at phloem loading sites (see 6.8.2); this internal water cycle was only recently visualised directly for the first time in a living plant using nuclear Magnetic Resonance imaging (Fig. 6.31); its relative magnitude is estimated to be approximately 1–3 % in trees and 5–10 % of the transpiration water in maize.
Fig. 6.31. Water regime and internal water cycle in 6-day-old castor bean seedlings (Ricinus) (determined at 95 % relative air humidity and 28 °C in the dark) (after W. Kuckenberger, with kind permission): A – external appearance of the seedling (left) and water balance (right). The measured flow velocity at measuring point M was: in the xylem 1.7 m • h-1 (acropetally), in the phloem 2.1 m • h-1 (basipetally); B – the Presence of water flow in the living seedling visualised by NMR, i.e., nuclear magnetic resonance (English: 1H-NMR). The NMR image was obtained for a 1 mm thick stem cross-section at measuring point M (see A). In the phloem (outer regions), water moves from the shoot apex towards the root (basipetally), while in the xylem it moves in the opposite direction (acropetally), as illustrated by the screen display (basipetal and acropetal flow). Mineral nutrients, as well as water for growth and phloem loading, are transported through the seedling via the xylem. Constant water loss occurs as a result of evaporation. Nutrients from the endosperm are transported via the phloem
In such situations—i.e., under reduced transpiration—the xylem contents are transported much more slowly than during more intensive transpiration; however, this is compensated for by a higher ion concentration in the xylem, ensuring an adequate supply of mineral nutrients to the plant regardless of the rate of transpiration. This is also demonstrated by the rapid growth of plants in experiments at lower relative air humidity (compared to higher humidity) and with reduced transpiration (by up to 15-fold). Acropetal (base-to-apex) water transport can be detected
in the shoots of the submerged and therefore non-transpiring aquatic plant Ranunculus trichophyllus (water crowfoot). Its velocity (>80 cm • h-1) is entirely sufficient to maintain maximal growth and nutrient supply.
Consequently, transpiration should be viewed as an inevitable burden rather than a vital transport mechanism essential to the survival of terrestrial plants.
The transition of water molecules from the liquid to the gas phase (transpiration, evaporation) takes place across all plant surfaces bordering on air that is not saturated with water vapour. In thallophytes, these are the external surfaces of the thallus; in cormophytes, they are, firstly, the external surfaces of shoots, which are usually cutinised or suberised to reduce transpiration, and secondly, the cell surfaces within the shoot that border intercellular spaces. From the intercellular spaces, water vapour diffuses out of the plant through the stomata. In doing so, it must first cross the boundary layer (a thin layer of stationary air immediately adjacent to the plant surface) before reaching the free atmosphere, where it is rapidly removed from the plant by mixing (convection) (Fig. 6.32).
Fig. 6.32. Water transport in a leaf featuring stomata on its lower surface. Volumes filled with liquid water are highlighted in grey; spaces filled with gas (intercellular air, atmospheric air) are unshaded. The figures indicate water potential values: -1.35 MPa corresponds to 99 % relative air humidity, -6.9 MPa to 95 %, and -93.3 MPa to 50 % (in each case at 20 °C, Table 6.11)

The driving force for transpiration is likewise a water potential gradient, with the critical region being the water potential difference between the ambient air
and the air within the intercellular spaces. The water potential of air is calculated using the formula

where R is the universal gas constant; T is the absolute temperature; partial molar volume of liquid water;
 actual concentration of water in the gas phase;
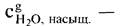 saturation concentration of water in the gas phase;
 is also called relative air humidity and is usually expressed as a percentage.
As the saturation of air with gaseous water decreases, the water potential drops very rapidly to highly negative values (see Table 6.11). The relative humidity of intercellular air can reach 99% = -1.35 MPa), in the substomatal cavity with open stomatal apertures it is about 95%
  -6.9 MPa), and at average ambient air humidity directly above the stomatal aperture it is about 50%
  = -93.3 MPa). Some average water potential values of leafy branches of various plant groups are shown in Fig. 6.33.
Fig. 6.33. Fluctuations in the water potential of leaves and branches in ecologically diverse plant groups. Measurements were carried out using a Scholander pressure chamber (see Fig. 6.39) during the day under intense solar radiation

Consequently, the plant, as it were, "bridges the gap" between the relatively high water potential of the soil and the low water potential of the air (Fig. 6.34). The driving force of transpiration is the extremely large difference in water potential between the unsaturated ambient air and the intercellular air (or the boundary layer unmixed with the surrounding air). Water molecules diffuse in gases much faster than in liquid water. The loss of water from the intercellular spaces (or from the boundary layer) stimulates the diffusion of water molecules from the apoplast into the intercellular air. Thus, highly negative hydrostatic pressures develop in the apoplast (Equation 6.34), which drive water Transport from the xylem vessels and, consequently, from the living cells of leaf tissues. The conducting vessels of leaves are highly branched at their ends, so that most leaf cells are no more than 0.5 mm away from the nearest xylem vessels.
Fig. 6.34. Water potential gradients between soil, plant, and air. The largest potential drop occurs not between the soil and the plant, but between the plant and the air (see Fig. 6.32)

An increase in the transpiring surface also leads to enhanced transpiration, as do all factors that steepen the water potential gradient between the plant and the air. An increase in air temperature reduces relative humidity and thereby lowers its water potential ( of the air becomes more negative). An increase in the temperature of transpiring organs (e.g., leaves) due to the absorption of solar radiation stimulates the transition of water from the liquid to the gas phase. A high water content in the plant (
 is slightly negative) also increases the potential difference. Wind reduces the thickness of the boundary layer with its relatively high water vapor content, thereby increasing the potential gradient. The boundary layer resistance to water vapor transport at a wind speed of 0.1 m s-1 is about 1–3 s cm-1, and at 10 m s1 it decreases to 0.1–0.3 s cm 3
The primary transpiring organs of cormophytes are the leaves. Due to the large surface areas of leafy plants, water loss through transpiration is often very significant. Since the plant must not suffer from water deficit during peak transpiration, at least the major part of this water loss must be compensated for by water absorption from the soil.
It has been calculated that in a beech forest, about 60% of the annual precipitation is returned to the atmosphere as water vapor. A sunflower can transpire 1 L of water during a sunny day, a birch tree (having approximately 200,000 leaves) up to 60–70 L, and on particularly hot and dry days even up to 400 L. In the Karakum Desert, the water loss of a legume plant Smurnovia turkestana within just 1 hour is 7 times its water content. In some plants on the dry slopes of the Kaiserstuhl, daily transpiration is 12 times The amount of water they contain. According to some estimates, in just 4,000 years, all of the Earth's water reserves pass through plant root systems to transpiring organs, from where they are released as water vapor.
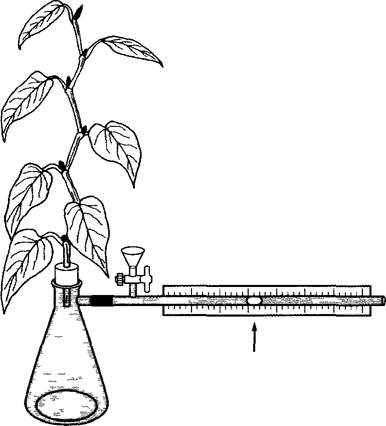
The transpiration of a plant or plant part over short periods can be measured by weighing at the beginning and end of the experiment; mass loss due to Respiration or mass gain due to photosynthesis do not play a significant role over short intervals. More precise and long-term measurements, as well as determinations on large plants, require other Methods. Since water loss is compensated for by water absorption, transpiration can also be determined using a potometer (Fig. 6.35). Combining weighing and potometer measurements allows for the determination of both water uptake and water loss, i.e., calculating the water balance of the plant (see 6.3.6, 13.5).
Fig. 6.35. Diagram of a simple potometer. The arrow points to an air bubble whose movement in the capillary can be observed.
The water potential of the shoot system of a higher plant (see Fig. 6.34) is much closer to the water potential of the soil than to that of the atmosphere. This is due to the significant resistance to water vapor diffusion that plants establish on transpiring surfaces, primarily external ones, for protection against transpiration.
The transpiration rate (TR!!!!!, mol m-2 s-1) is calculated as

where actual concentration of water in the gas phase; Σr — the sum of all diffusion resistances.
Protection against transpiration is primarily provided by the cuticle (for chemical composition, see 6.17.3), which first appears in mosses and (along with the presence of suberin and Lignin) serves as a necessary prerequisite for The Development of large land plants with regulated water exchange (so-called homoiohydric plants, see 13.5). Isolated intact leaf cuticles have extremely limited permeability to water (permeability coefficient of 10-7 to 10-8 cm • s-1); this is mainly due to the presence of wax. The water permeability of an intact leaf is further reduced by the deposition of additional wax layers on the cuticle (see Fig. 3.11) and the deposition of cutin in the outer epidermal walls. A covering of dead hairs, which can be seen on some leaves (e.g., in edelweiss), also serves to reduce transpiration by creating windless, water-vapor-saturated spaces (see Fig. 3.14). A similar effect is also achieved by sunken stomata in wind-protected cavities.
Cuticular transpiration usually does not exceed (even in delicate leaves of humid habitats) 10% of evaporation from a free water surface of equal area (evaporation, i.e., evaporation without diffusion resistance and with unlimited water replenishment). In conifer needles and sclerophyllous leaves, it is 0.5%, and in cacti, which must conserve stored water from evaporation during long dry periods, it is only 0.05% of free evaporation.
Like cutin, suberin layers serve as insulating material, for example, in Dermal Tissues, cork, and bark (see 3.2.2.1, 3.2.2.2). This is the basis for sealing champagne bottles with cork, which provides impermeability to water and gas. The shelf life of potato tubers is also due to their thin corky "Skin", which is why peeled potatoes dry out quickly.
Like coating with cutin and suberin, the insulation of plant organs with lignin (Structure and Biosynthesis, see 6.17.3) can not only reduce the loss
of water vapor, but also limit the diffusion of other gases vital to the plant (primarily CO2 for photosynthesis, see 6.4). Therefore, regulated pores, stomata (see 3.2.2.1), have evolved on plant leaves—the most important organs for gas exchange—as well as on other green organs (primary shoot axes, fruits). Suberized tissues release water through unregulated pore systems, lenticels (see 3.2.2.2), which have locally reduced diffusion resistance.
Stomata, on the one hand, facilitate The entry of CO2 required for photosynthesis (or for dark CO2 fixation in CAM plants, see 6.5.9) by reducing diffusion resistance (through stomatal opening); on the other hand, they reduce stomatal transpiration under water stress or in the absence of conditions for photosynthesis (in the dark) by increasing diffusion resistance (through stomatal closure).
Fully open stomata dramatically reduce diffusion resistance compared to cuticular transpiration resistance (Table 6.12). Differences between species and local plant forms depend on stomatal distribution (on both sides of the leaf or only on the lower side), their frequency, size, as well as structural features ("geometry").
Table 6.12. Transpiration of leaves of various plants (in mg Н2О per 1 dm2 of leaf surface on both sides per hour) during evaporation (in a Piche evaporimeter)
3 360 mg Н2О dm-2 h -1
Plant |
Total transpiration with open stomata |
Cuticular transpiration after stomatal closure |
Cuticular transpiration, %, of total transpiration |
Herbaceous plants of sunny habitats |
|||
Coronilla varia |
2 000 |
190 |
9,5 |
Stachys recta |
1 800 |
180 |
10 |
Oxytropis pilosa |
1 700 |
100 |
6 |
Shade-tolerant herbs |
|||
Pulmonaria officinalis |
1000 |
250 |
25 |
Impatiens noli-tangere |
750 |
240 |
32 |
Asarum europaeum |
700 |
80 |
11,5 |
Oxalis acetosella |
400 |
50 |
12,5 |
Trees |
|||
Betula pendula |
780 |
95 |
12 |
Fagus sytvatica |
420 |
90 |
21 |
Picea abies |
480 |
15 |
3 |
Pinus sylvestris |
540 |
13 |
2,5 |
Evergreen Ericaceae |
|||
Rhododendron |
600 |
60 |
10 |
ferrugineum |
|||
Arctostaphylos uva-ursi |
580 |
45 |
8 |
With fully open stomata, a leaf can lose through transpiration up to 50–70% of the water vapor that would evaporate from an equivalent free water surface. This is surprisingly high because, although there are several hundred stomata per square millimeter, their total area at maximum aperture rarely reaches 1–2% of the leaf area due to the narrow width of the stomatal apertures (a few µm).
Model experiments have shown that many small pores allow significantly greater water passage than a small number of large pores of the same total area. This is due to the "edge effect," i.e., the fact that water vapor molecules escaping from the edges of a pore have a free field for lateral diffusion, whereas molecules diffusing from the center are surrounded by neighboring molecules on all sides (see Fig. 6.32). Probably for this same reason, the initial slight opening of stomata that were previously completely closed has the most pronounced effect on transpiration.
The daily course of transpiration in cormophytes in most cases shows a characteristic pattern: with the onset of light, transpiration begins due to photoactive stomatal opening (see 8.3.2.5), then increases with fully open stomata until midday due to the increasing heating of the leaf and air (decrease in relative humidity), and then declines again until the stomata close again at dusk. Under increasing water stress (see 13.5.2), this leads to an earlier restriction of stomatal opening, or rarely to a midday depression. If water uptake no longer compensates for water loss during the day, this deficit can usually be balanced again during the cool and relatively humid night.
Due to The Importance of stomata for overall Gas Exchange in all plant species with functioning stomata, factors regulating stomatal aperture width play a crucial role in the physiological regulation of gas exchange. These will be discussed below (see 6.5.7; for the regulatory mechanism, see 8.3.2.5).
Lenticels are also sites of reduced resistance to water vapor diffusion. Thus, the permeability coefficient of lenticels in birch periderm is about ten times higher than that of continuous periderm, but, unlike stomata, they are not physiologically regulated.
The transpiration ratio (kt) indicates how much water is lost during transpiration when 1 g of CO2 is fixed; i.e., it is a measure of water-use efficiency. Often, the reciprocal value is used, referred to as *water-use efficiency, or transpiration productivity:*

Molar values are also used. The transpiration ratio is species- and cultivar-specific and depends heavily on the photosynthetic pathway: 200–800 in C3 plants, 200–350 in C4 plants, and 30–150 in CAM plants (CO2 fixation at night) (for C4 and CAM METABOLISM, see 6.5.8 and 6.5.9).
The phenomenon of guttation, i.e., the exudation of liquid water droplets, is probably explained by the need to maintain water flow in the plant even in the absence of transpiration. Accordingly, this phenomenon is observed primarily at high relative humidity, particularly in tropical rainforests, and in our climate, for example, at night. Such droplets are exuded on plants in specific locations, most often on leaves, through hydathodes (see 3.2.2.1) or through glandular hairs (*trichome hydathodes*). These droplets are often mistaken for dew drops, for example, in lady's mantle (Alchemilla), fuchsia (Fuchsia), nasturtium (Tropaeolum), or on the leaf tips of many grasses (Fig. 6.36). In Colocasia nymphaeifolia (Araceae family), a tropical rainforest plant, up to 100 ml of liquid can "drip" from a single large leaf during a single night. Guttation is also found in lower plants, primarily in Fungi, such as the dry rot fungus Serpula (Merulius) lacrymans, which is how it got its specific epithet ("weeping").
Fig. 6.36. Guttation droplets on the leaf tips of young wheat plants

Root pressure serves as the driving force for the exudation of guttation fluid by passive hydathodes, for example, in grass leaves (see 6.3.3). Hydathodes are pore systems through which xylem sap is forced outward under its own pressure, often passing through water stomata. This type of guttation ceases to function if the hydathodes are isolated from the root. Active hydathodes (which probably constitute the majority of epithem hydathodes), such as in nasturtium (Tropaeolum) and saxifrage (Saxifraga), and all trichome hydathodes, such as in chickpea (Cicer), common bean (Phaseolus), etc., possess water glands that operate independently of root pressure. The mechanisms of secretion in this case are not yet understood in detail, as is true for other glands.
It is generally assumed that osmotically active substances are exported, and water follows them passively. Active hydathodes are probably related to salt and nectar glands (see 6.18). Guttation fluid is not pure water, but a dilute aqueous solution of organic as well as inorganic substances.
Long-distance water transport occurs in xylem elements (see 3.2.4.2), which are specially adapted for this function. The driving force of this process in growing and transpiring plants is predominantly the *transpiration pull, while root pressure1* (see Fig. 6.31) enables the distribution of substances dissolved in the xylem sap, primarily mineral nutrients, via bulk water flow through the xylem (especially in herbaceous plants or seedlings during phases of greatly reduced or absent transpiration). In these cases, water is exuded by guttation (see 6.3.4.2; Fig. 6.36), so that it does not return to the phloem and is subject to residual transpiration.
1 In this regard, Russian literature introduces THE CONCEPT OF the upper terminal motor (transpiration) and the lower terminal motor (root pressure) of the water flow. — Editor's note.
In a castor bean (Ricinus) seedling, nuclear magnetic resonance measurements showed that water flow in the xylem was 38 µl • h-1, in the phloem — 17 µl • h-1, with a transpiration rate of 16 µl • h-1 and a growth water requirement of 5 µl • h-1. Consequently, the volumetric water flow in the xylem is exactly equal to the sum of the phloem flow + transpiration rate + growth water requirement. No guttation occurs.
Bleeding (sap exudation) in various woody plants when xylem is damaged in early spring ("bleeding of plants") is also explained by the action of root pressure.
The amount of fluid exuding from wounds can be very significant: in 24 h, a grapevine can lose about 1 L of fluid, and a birch tree up to 5 L.
Analyses have shown that the contents of the water-conducting pathways, like guttation fluid and spring sap, are not pure water but a dilute (0.1–0.4%) solution of inorganic substances, sugars, organic acids, Amino Acids, Vitamins, Hormones, etc. For example, a high (averaging 2.5%) sugar content (predominantly sucrose) is known in the sap of the sugar maple (Acer saccharum), which is used in North America to make maple syrup. A vigorous tree yields about 4 L of sap per day in mid-March and approximately 2–3 kg of sugar during the spring. However, by this time, the maple develops not only root pressure but also overpressure in the trunk, as has been demonstrated in felled trees.
However, the exudation of fluid following xylem injury does not imply that root pressure maintains an intensive water flow in the conduits of bleeding-capable trees during the sap-flow period, i.e., when they are leafless. In reality, Water Movement in a leafless trunk is so minimal (as shown by thermoelectric measurements of water flow, Fig. 6.37) that it could hardly meet water requirements or compensate for water loss. The Significance of xylem sap and overpressure in a leafless woody plant probably lies in the fact that with bud burst in early spring—i.e., before new leaves themselves begin to photosynthesize actively—there is already a demand for nutrients, which is partially met by the contents of the xylem.
Fig. 6.37. Thermoelectric measurement of flow rate in the xylem; diagram of the experimental setup. A wire loop is heated electrically for a short period (1–3 s), and the arrival of the heat wave downstream is registered by a copper (Cu)-constantan (Ko) thermocouple at a specific distance from the heating site. The moving front of the heated xylem sap first reaches the nearest measurement point and causes a deflection of the galvanometer needle. When the sap passes the second measurement point, making it warmer than the first, the galvanometer needle deflects in the opposite direction. This reverse deflection serves as clear Evidence of the passage of a certain volume of heated water

THE ORIGIN OF negative hydrostatic pressure (the tension pull of transpiration) in the apoplast of transpiring leaves was explained in Section 6.3.4.1. From there, continuous water columns extend through the water-Conducting pathways of the xylem down to the root, moving through the plant due to the tension pull of transpiration (transpiration stream). The water-conducting pathways—vessels and/or tracheids (see 3.2.4.2) (dead conducting elements)—pose relatively little resistance to the moving water due to the absence of protoplasts within them.
The cytoplasm layer between the vacuole and the cell wall (including the tonoplast and plasmalemma) of a single Chara cell has a water permeability of only about 10-4 cm s-1 MPa-1, which corresponds to the value for 600 m of pine wood in the longitudinal direction and 3 mm in the radial direction
The total cross-sectional area of water-conducting elements formed in the shoot axis of a plant per gram of fresh weight of the leaves supplied with water depends on the ecotype: plants of wet habitats (limited transpiration) show lower values than plants of dry areas (Table 6.13). Even within the crown of a single tree, these values vary in individual limbs or branches: for example, the topmost shoot is clearly preferentially supplied with water.
Transport velocities in the xylem can be determined by the thermoelectric method (see Fig. 6.37). The measured values vary significantly among individual species depending on their wood structure. Based on this parameter, three major plant types have been distinguished (gymnosperms, diffuse-porous and ring-porous angiosperms), which show markedly different maximum and average transpiration rates (Table 6.14).
Table 6.13 Cross-sectional area of the water-conducting system in various plants (mm2/g leaf fresh weight)
Plant |
Cross-section, mm2 g -1 |
Water lily (leaf petioles) |
0.02 |
Understory herbs |
0.01-0.80 |
Coniferous trees |
0.30-0.61 |
Broadleaved trees |
0.25-0.79 |
Desert plants |
1.42-7.68 |
Table 6.14 Maximum midday velocities of transpiration streams in various plant types, measured by the thermoelectric method
Object |
Velocity, m h -1 |
Mosses |
1.2-2.0 |
Evergreen conifers |
1.2 |
Larch |
1.4 |
Mediterranean sclerophyllous plants |
0.4-1.5 |
Deciduous diffuse-porous broadleaved trees |
1-6 |
Ring-porous broadleaved trees |
4-44 |
Herbaceous plants |
10-60 |
Lianas |
150 |
Applying the Hagen–Poiseuille law (Equation 6.32) allows one, based on the measured flow velocities, to determine the tension (negative hydrostatic pressure) required to move a liquid Column at the corresponding flow velocity, given the geometry of the xylem vessels and the viscosity of their contents (approximated to the viscosity of water, 103 MPa s). For an average velocity of 16 m h-1 and an average vessel radius of 30 µm (diameter 60 µm), a value of -0.02 MPa m-1 is obtained (Fig. 6.38). Since The properties of vessels and tracheids differ from those of ideal capillaries, this value may represent a minimum. The deviations of actual hydraulic conductivities of xylem from ideal values for various plants are given in Table 6.15. Consequently, the actual values for the required tension can, depending on the species, be much higher. However, ring-porous trees (oak, lianas—see Table 6.15) are surprisingly close to ideal capillaries in terms of their hydraulic conductivities. The work of lifting against gravity must also be taken into account (a 1 m water column exerts a pressure of 0.01 MPa = 0.1 bar at its base), so that in total, the negative pressure gradient must be at least -0.03 MPa m-1. For the tallest tree species—North American giant sequoias (Sequoiadendron) and Australian eucalyptus (Eucalyptus), which reach heights of 100–120 m—a negative hydraulic pressure of at least -3 to -4 MPa is thus generated, allowing water to be lifted from the root to the treetop. Admittedly, these tensions are easily achieved through the generation of matric potentials due to evaporation (see Fig. 6.32). However, the osmotic potential in leaf tissue cells also reaches values of -3 to -4 MPa (see 6.3.2.1; Fig. 6.28), which is quite sufficient to ensure the ascent of water from the roots to the tips of the uppermost shoots even in the absence of transpiration, even in the tallest trees.
Fig. 6.38. Dependence of the required hydrostatic pressure gradient (∆p) on capillary diameters at various flow velocities, according to Hagen–Poiseuille (see Equation 6.32)

Table 6.15. Hydraulic conductivity of the xylem of various plants (% of theoretical values for ideal capillaries with the same diameters)
Plant |
Hydraulic conductivity, % |
Grapevine (liana) Oak (root wood) Fir Birch (root wood) Poplar (stem wood) Various herbs and shrubs |
100 53-84 26-43 34.8 21.7 12-22 |
Experimental evidence of negative pressure in the xylem can be obtained using a Scholander pressure chamber. For this purpose, the overpressure required to make the menisci reappear at the cut surfaces of excised plant parts is determined; these menisci, upon cutting the water columns, are drawn inside the conducting vessels by the tension in the xylem (Fig. 6.39). First, this method determines the average water potential of the entire organ enclosed in the pressure chamber. In most cases, the water potential of the xylem approximately corresponds to this value, since the osmotic potential of the xylem sap is very small, and therefore the water potential of the xylem contents is approximately equal to the negative hydraulic pressure of the water column in the xylem, which is also in very close contact with the adjacent tissues.
Fig. 6.39. Pressure chamber for measuring negative hydrostatic pressure in the xylem of plant parts

Using this method, the existence of a pressure gradient of the required order of magnitude (slightly over 0.01 MPa m-1) was indeed demonstrated in tall conifers (Fig. 6.40). The absolute values of the negative pressure showed a clear diurnal dynamic, with the most negative values occurring during the period of most intensive transpiration. It follows that water supply does not always keep pace with its consumption (see 6.3.6—Water Balance). Diurnal rhythms of negative hydrostatic pressures cause trees to exhibit a distinct decrease in diameter during periods of more intensive transpiration (at midday) compared to conditions of weaker transpiration or its absence (e.g., at night).
Fig. 6.40. Pressure gradients in the xylem of Douglas fir (Pseudotsuga) during the day, measured using a pressure chamber. Circles indicate the positions of the branches used for each measurement

Water columns in the conducting pathways can withstand tension only if the adhesion to the vessel walls and the cohesion of water molecules can endure this force. The tension at which the cohesion of water molecules is disrupted can be calculated theoretically or measured experimentally. The first determination of this kind was carried out on a natural system by studying the rupture of water-filled Cells of the annulus of a fern sporangium (see 8.4; Fig. 8.37). It occurs at values between -22 MPa (saturated sucrose solution) and -36 MPa (saturated sodium chloride solution). Purely physical methods can generate even more negative values (below -100 MPa). Consequently, there is no danger that the cohesion of water will be disrupted under the tensions prevailing in the conducting vessels (cohesion theory of water transport).
The danger of continuous water columns rupturing due to tension lies to a much greater extent in the occurrence of gas embolism in the conducting pathways, where, under the pressure conditions existing in the xylem, even the smallest gas bubbles expand to occupy large volumes (since there is no cohesion between gas molecules). Using sensitive ultrasonic detectors, it is possible to acoustically record the sound waves generated by the cavitation of water columns in the stems of intensively transpiring plants.
For wide-lumened conducting elements, it seems to be only a matter of time before they lose their ability to function as a result of embolism (which is irreversible in most cases). In ring-porous trees, such as oak, large vessels typically function for only a single growing season, and by THE START OF the new growth period, the entire water-conducting system must be recreated by the cambium. This is one of the reasons why oaks burst their buds so late in the spring. It is not yet clear how the wide-lumened vessels of lianas maintain their ability to function for many years.
Tracheid-based conduits, such as those in gymnosperm wood, are much less susceptible to embolism. If a tracheid does fail due to embolism, pressure changes cause the tori of bordered pits to immediately and irreversibly seal the conducting element, isolating it from neighboring tracheids ("bulkhead principle", see 3.2.4.2; Fig. 2.75). Reversible closure occurs when the tracheid contents begin to freeze and experience pressure resulting from the volume expansion during ice formation. In the now hermetically sealed tracheids, the freezing of only a small fraction of the water content is sufficient to compensate for any tension that may have existed previously, thereby reducing gas bubble formation. Each subsequent ice formation further compresses the remaining liquid phase and keeps the gas in solution until all the water is frozen. During thawing, the processes occur in reverse, so that even when negative pressure arises, gas bubbles do not form. This function of bordered pits, along with other structural features, accounts for the special adaptation of gymnosperms to colonizing cold regions. Tellingly, the only gymnosperms that lack tori in their bordered pits are those not exposed to the danger of frost (e.g., Cycas or the Paleozoic genera Callixylon and Cordaites).
Living cells adjacent to conduits, primarily large vessels (paratracheal parenchyma), may function to protect against the penetration of gas bubbles into the conducting elements; it remains unclear whether they are also capable of removing bubbles already present in the conduits.
It is assumed that xylem pressure, which increases in the absence of transpiration, facilitates the dissolution of gas bubbles (the solubility of gases in liquids increases with increasing pressure). This may represent another function of root pressure.
In large trees at night (with closed stomata), water movement in the crown is not detectable by thermoelectric methods. In the morning, with the onset of stomatal transpiration, water movement begins in the peripheral parts of the crown and then propagates down the trunk. In the evening, the transpiration stream ceases in the same sequence: first in the crown, and only then in the upper parts of the trunk; it often does not stop completely at night at the Base of the trunk and in the root. Such prolonged operation of these organs is required to fully replenish water reserves.
6.3.6. Water balance
The difference between water uptake and water loss is called the water balance. A negative water balance is observed when transpiration exceeds water uptake; otherwise, it is referred to as a positive water balance. During intensive daytime transpiration, a negative water balance may occur, whereas at night this deficit is equilibrated again. During a dry period, full recovery does not occur, so the balance becomes increasingly negative. Consequently, the osmotic potential and water potential become increasingly negative. Different species, as well as different plant ecotypes within a species, tolerate varying degrees and durations of such a deficit, i.e., they possess different drought tolerance.
The water balance of a plant (or organ) is often expressed as a percentage water saturation deficit (WSD); it indicates how much water the tissue requires for full saturation:

where WН is the saturating water content; WР is the actual water content (for the ecology of water relations, see 13.5).
Last update: 07/08/2026
Editorial and Educational Adaptation: This material has been compiled based on the primary/original source text. The project team performed an editorial review, corrected technical inaccuracies, structured sections, and adapted the content for an educational format.
What was processed:
- elimination of formatting defects (OCR errors, structural breaks, corrupted characters);
- editorial organization of content;
- standardization of terminology in accordance with academic sources;
- verification of factual statements against the original source text.
All mentions of the author, publication year, and origin of the primary text have been preserved in accordance with the source.