Review of Medical Physiology - William F. Ganong 2002
Respiration
Pulmonary Functions
Mechanics of Breathing
Inhalation and Exhalation
The Lungs and chest wall are elastic structures. Under normal conditions, they are separated only by a thin film of fluid. The lungs slide easily against the chest wall, yet resist being separated from it—much like two moistened Glass slides slide smoothly over one another, but are quite difficult to pull apart. The pressure in the space between the lungs and the chest wall (intrapleural pressure) is subatmospheric (see Fig. 34-3). During breathing, the lungs expand; at the end of each exhalation, the tendency of the lungs to pull away from the chest wall is balanced by the capacity of the chest wall to spring in the opposite direction. If the chest wall is punctured (e.g., a chest wound), the lungs collapse; conversely, when the lungs lose their elasticity, the chest wall expands and becomes barrel-shaped.
Class="center">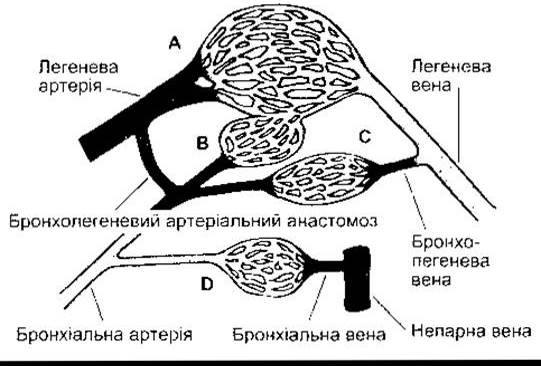
Fig. 34-5. Relationship between bronchial and pulmonary Blood supplies. The pulmonary Arteries form a capillary network in the lungs. The bronchial artery A supplies capillary networks B, C, and D. Network B consists of bronchial capillaries supplying the bronchioles, which anastomose with pulmonary capillaries and drain into Pulmonary Veins. Network C comprises bronchial capillaries that pass to most of the Bronchi; these vessels form bronchopulmonary veins that empty into the pulmonary veins. Capillary network D consists of bronchial capillaries supplying the lobar and segmental bronchi, forming true bronchial veins that drain into the hemiazygos or intercostal veins. Areas shown in dark shading have a low O2 content (Reproduced, with permission, from Murray JF: The Normal Lung. Saunders, 1986).
The act of inhalation is an active process. Contraction of the Respiratory Muscles increases the volume of the thoracic cavity. Intrapleural pressure at the Base of the lungs—normally about -2.5 mm Hg (relative to atmospheric pressure) at THE START OF inhalation—drops to -6 mm Hg. The lungs transition to a larger volume. Airway pressure becomes slightly negative, and air flows into the lungs (Fig. 34-6). At the end of inhalation, once the elastic recoil forces of the lungs and chest wall are no longer balanced, the recoil force of the lungs guides the chest wall back into the exhalation position. Airway pressure becomes slightly positive, and air flows out of the lungs. Overall, the respiratory muscles are not involved in exhalation, making it a passive process. Only at the very beginning of exhalation do certain respiratory muscles contract briefly to brake the outflow of air.
A forceful inhalation can lower the intrapleural pressure to -30 mm Hg or more, causing a high degree of lung inflation. When ventilation increases, the expiratory volume of the lungs also increases through the contraction of expiratory muscles, which decreases the volume of the intrathoracic space.

Fig. 34-6. Changes in intrapleural (intrathoracic) and intrapulmonary pressures relative to atmospheric pressure during inhalation and exhalation. Note: In the absence of air and tissue resistance, intrapleural pressure would follow the dashed line, whereas the actual pressure curve is shifted to the left due to these resistances (see also Fig. 34-15).
Lung Volumes
The volume of air entering the lungs with each breath (or leaving the lungs with each breath) is called the tidal volume. The extra volume of air that can be inhaled over and above the tidal volume during a maximal inhalation is termed the inspiratory reserve volume.
The volume of air that can be exhaled during a maximal exhalation beyond the tidal volume is known as the expiratory reserve volume.
The volume of air remaining in the lungs after a maximal exhalation is the residual volume. Figure 34-7 illustrates normal lung volumes and their combinations. The volume of the conducting airways filled with gas that does not exchange with blood in the Pulmonary Circulation is called the dead space volume.
Vital capacity is the maximum volume of air that can be expelled from the lungs after a maximal inhalation. It is often used clinically as an index of pulmonary function, providing valuable insight into both respiratory Muscle strength and Other Aspects of breathing mechanics. The fraction of the vital capacity exhaled During the first second of a forced expiration (FEV1, forced expiratory volume in 1 second) (Fig. 34-8) yields crucial additional information. Sometimes the vital capacity is within normal limits while FEV1 is reduced due to increased airway resistance, such as during bronchospasm in Bronchial Asthma. The volume of air inspired per minute (minute ventilation, or minute respiratory volume) normally averages about 6 L (500 mL per breath × 12 breaths/min). The maximal voluntary ventilation (MVV), often called the maximum breathing capacity, is the largest volume of gas that can be moved into and out of the lungs in 1 min by voluntary hyperventilation. Normally, MVV ranges from 125 to 170 L/min.
Respiratory Muscles
Movement of the Diaphragm accounts for roughly 75% of The change in intrathoracic volume. Forming the floor of the thoracic cavity, the diaphragm arches over The Liver and moves downward like a piston during inhalation. The excursion of the diaphragm ranges from 1.5 to 7.0 cm during deep breathing (Fig. 34-9). The diaphragm consists of three parts: the costal part, composed of fibers originating from the lower Ribs and costal cartilages; the central tendon, into which the costal fibers insert; and the crura (singular, crus). The central tendon is continuous with the inferior portion of the Pericardium. The fibers of the crura flank the Esophagus and can compress it upon contraction. Because the costal fibers and the crura are innervated by different Branches of the phrenic nerve, they can contract independently. For example, during vomiting and regurgitation, intra-abdominal pressure increases due to the contraction of the costal fibers. At a time when the crura fibers are relaxed, gastric contents can pass into the esophagus. The Role of the crura in swallowing is discussed in Chapter 26.

Fig. 34-7. Lung volumes and dynamic ventilatory measurements. The diagram at the upper right shows a spirogram recorded over time.

Fig. 34-8. Volume of gas inhaled by a normal adult male during a forced expiration, demonstrating FEV1 and vital capacity (VC) (Reproduced, with permission, from Crapo RO: Pulmonary-function testing. N Engl J Med 1994;331:25. Massachusetts Medical Society, 1994).
Other important inspiratory muscles include the external intercostals, which run obliquely downward and forward from rib to rib. Since the pivot point of the ribs is at the spine, contraction of the external intercostals elevates the lower ribs. This pushes the Sternum forward and increases the anteroposterior diameter of the chest. The transverse diameter also increases, though to a lesser extent. Both the diaphragm and the external intercostal muscles are capable of independently maintaining adequate pulmonary ventilation. Transection of the Spinal Cord above the third cervical segment is fatal unless Artificial ventilation is provided, whereas transection below the fifth cervical segment is not, because the phrenic nerve, originating from spinal segments C3-C5, remains intact. Conversely, patients with bilateral phrenic nerve paralysis—yet with preserved intercostal innervation—exhibit labored breathing, which is nevertheless sufficient to sustain life. The scalene and sternocleidomastoid Muscles of the neck serve as accessory Muscles of inspiration, helping to elevate the rib cage during labored breathing. A decrease in intrathoracic volume and active expiration are achieved through the contraction of expiratory muscles. The internal intercostals act in this manner because they run obliquely downward and backward from rib to rib, pulling the rib cage downward upon contraction. Contraction of the anterior abdominal wall muscles also AIDS expiration by pulling the rib cage downward and inward, and, by increasing intra-abdominal pressure, pushing the diaphragm upward.

Fig. 34-9. Chest radiographs at maximal expiration (left) and maximal inspiration (right). The dashed white line outlines the BOUNDARIES OF THE lungs at maximal expiration (Reproduced, with permission, from Comroe JH Jr: Physiology of Respiration, 2nd ed. Year Book Medical Publishers, 1974).
The Glottis
During inhalation, the abductor muscles of the Larynx contract slightly. This abducts the vocal cords and opens the glottis. During swallowing, the adductor muscles contract reflexively, closing the glottis to prevent food, liquids, or vomitus from entering the lungs. In unconscious or anesthetized patients, closure of the glottis may be incomplete, allowing vomitus to reach the Trachea and cause an inflammatory lung reaction (aspiration Pneumonia).
The laryngeal muscles are innervated by branches of the Vagus nerve. Paralysis of the abductor muscles results in inspiratory stridor. Conversely, if the adductor muscles are paralyzed, food and fluid can easily enter the trachea, leading to aspiration pneumonia and pulmonary edema. Bilateral cervical vagotomy in experimental animals leads to the gradual development of fatal pulmonary failure and pulmonary edema. Pulmonary edema typically occurs in the terminal stages of aspiration, but can occasionally result from a tracheotomy performed prior to vagotomy.
Bronchial Tone
In general, the smooth muscle of the bronchial wall aids in respiration. The bronchi dilate during inspiration and constrict during expiration. Dilation (bronchodilation) is regulated by the sympathetic Nervous system, whereas constriction (bronchoconstriction) is controlled by parasympathetic innervation. Stimulation of airway sensory receptors by irritants and chemical agents (such as sulfur dioxide) induces reflex bronchoconstriction via cholinergic innervation. Cold air also triggers bronchoconstriction; Physical Exercise acts similarly because the forced breathing characteristic of it is accompanied by airway cooling. Additionally, bronchial muscles protect the bronchi from coughing. A circadian rhythm of bronchial tone has been documented, with maximum susceptibility to constriction occurring around 6:00 AM and peak dilation at 6:00 PM. As noted above, bronchodilation is mediated by VIP. Conversely, substance P induces bronchodilation—much like the action of adenosine via A-receptors (see Chapter 4)—along with other cytokines and inflammatory modulators. Although the role of these substances in the Pathogenesis of asthma is discussed in Chapter 37, their exact significance in the physiological regulation of bronchial tone remains unclear.
Elasticity of the Lungs and Chest Wall
The relationship between the movement of the lungs and the chest wall can be illustrated using living subjects. In this experiment, the subject's nostrils are closed with a specialized clip, requiring them to breathe exclusively through the Mouth via a spirometer equipped with a pressure-measuring valve. As soon as the subject inhales a certain volume of air, the valve trips and blocks any further inflow. The airway pressure is then recorded while the respiratory muscles remain relaxed. This pressure recording is repeated during each inhalation and exhalation of varying air volumes. The curve plotting airway pressure against air volume is referred to as the pressure-relaxation curve (Fig. 34-10) for the entire Respiratory system. When the gas volume in the lungs at the end of each expiration equals zero, the pressure is zero (the relaxation volume, which corresponds to the functional residual capacity). Pressure is positive at larger lung volumes and negative at smaller ones. The ratio of the change in lung volume to the change in airway pressure (ΔV/ΔP) reflects the distensibility (elasticity) of the lungs and chest wall. Under normal conditions, this relationship is observed at the pressure where the relaxation curve is steepest, with a volume approaching 0.2 L/cm H2O. Lung volume plays a crucial role here; for instance, individuals with a single lung exhibit approximately half the ΔV for a given ΔP. This ratio is slightly higher during expiration than during inhalation. Consequently, analyzing the pressure-volume curve across the entire respiratory cycle provides more comprehensive information. The curve shifts downward and to the right (decreasing elasticity) in pulmonary insufficiency and interstitial pulmonary fibrosis (Fig. 34-11), and upward and to the left (increasing elasticity) in emphysema (see Chapter 37). Thus, this ratio serves as a static measure of the interaction between the lungs and the chest wall. Respiratory resistance is determined by the pressure gradient and depends on airflow rate. Its measurement is more dynamic and relies on airway resistance.
Alveolar Surface Tension
Lung elasticity depends heavily On the surface tension of the fluid film lining the alveolar walls. THE CONTRIBUTION OF this component at various lung volumes can be measured by removing the lungs from an experimental animal and alternately filling them with saline and air while simultaneously recording intrapleural pressure. Because saline reduces alveolar surface tension to zero, the resulting pressure-volume curve reflects solely the elasticity of the lung parenchyma (Fig. 34-12). The curve obtained by inflating the lungs with air represents the combined elasticity of the lung tissue and alveolar surface tension. The difference between the two curves decreases significantly as lung volumes increase. Furthermore, alveolar surface tension is lower than the expected surface tension of an air-Water mixture.
Surfactant
The decrease in surface tension with decreasing alveolar volume is attributed to the presence of surfactant (a lipid-based substance) in the fluid lining the alveolar surface. Surfactant is a mixture of dipalmitoylphosphatidylcholine (DPPC) along with other Lipids and Proteins (Table 34-2). If surface tension did not decrease as alveolar volume drops during expiration, the alveoli would simply collapse According to the Law of Laplace (see Chapter 30). In spherical structures like alveoli, the distension pressure is equal to twice the tension divided by the radius ($P = 2T/r$). If $T$ does not decrease as $r$ decreases, the tension force exceeds the distension pressure. Consequently, surfactant prevents pulmonary edema. Calculations show that in the absence of surfactant, alveolar surface tension would drop to 20 mm Hg, triggering unchecked transudation of plasma and blood into the alveoli. Phospholipids consist of a hydrophilic "HEAD" group and two parallel hydrophobic fatty acid "tail" groups (see Chapter 1), with their tails oriented toward the alveolar lumen. Alveolar surface tension is directly proportional to surfactant concentration per unit area. Phospholipid molecules repel each other as alveolar volume expands during inspiration, thereby increasing surface tension. Conversely, these same molecules pack tightly together when surface tension decreases during expiration.
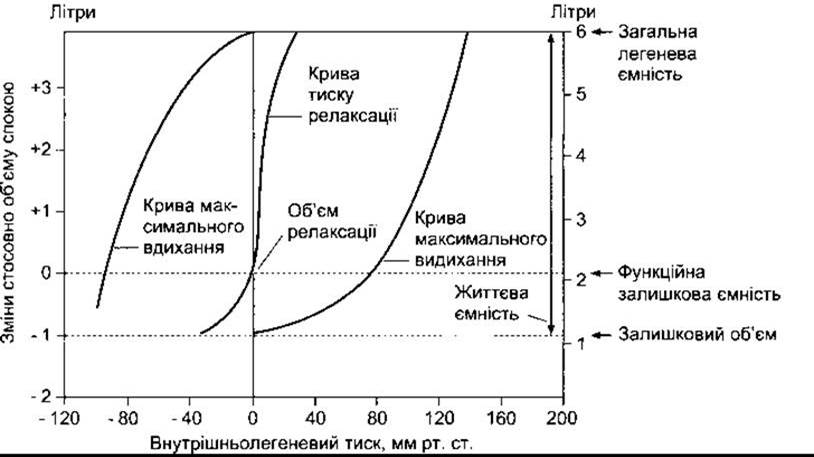
Fig. 34-10. Relationship between intrapleural pressure and volume. The middle curve represents the relaxation pressure curve of the respiratory system—that is, the static pressure curve obtained at various degrees of lung inflation or deflation; intrapulmonary pressure (elastic recoil pressure) is measured with the airways closed. The relaxation volume is defined by the point where the recoil forces of the chest wall and lungs are in equilibrium. The slope of the curve corresponds to the elasticity of the lungs and chest wall. The maximum inspiration and expiration curves illustrate the airway pressures generated during maximal inhalation and exhalation.
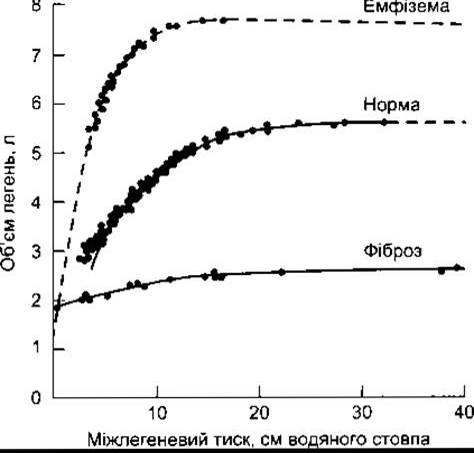
Fig. 34-11. Static expiration pressure-volume curves in normal individuals and patients with severe emphysema and pulmonary fibrosis (modified and reproduced with permission from Pride NB, Maćkiem PT: Lung mechanics in disease. In: Handbook of Physiology. Section 3, The Respiratory System. Vol. III, part 2. Fishman AP [editor]. American Physiological Society, 1986).
Surfactant is produced by type II alveolar Cells (Fig. 34-13). Typical lamellar bodies—membrane-bound Organelles containing phospholipid whorls—are synthesized within these cells and secreted into the alveolar lumen via exocytosis. Lipid tubules known as tubular myelin form from used lamellar bodies, and this tubular myelin in turn generates the phospholipid film. Certain surfactant protein-lipid complexes are taken up by type II alveolar cells via endocytosis and undergo recycling.
The Structure of the surfactant phospholipid film is largely determined by specific proteins, with four unique proteins—SP-A, SP-B, SP-C, and SP-D—playing a leading role. For instance, SP-A is a large glycoprotein containing a Collagen-like domain in its structure. It performs diverse Functions, including the feedback regulation of surfactant Synthesis and Secretion by type II alveolar cells. SP-B and SP-C are smaller proteins that facilitate The formation of the monomolecular phospholipid film. Like SP-A, SP-D is also a glycoprotein, although its exact function remains undetermined. Nevertheless, both SP-A and SP-D belong to a family of proteins involved in innate Immunity.

Fig. 34-12. Pressure-volume relationship in excised cat lungs. Air - lungs inflated with air (infl) and deflated (defl). Saline - lungs inflated with saline and deflated (reproduced with permission from Morgan TE: Pulmonary surfactant. N Engl J Med 1971;284:1185).
Surfactant plays a vital role at birth. Although the fetus performs breathing movements in utero, the lungs remain collapsed prior to delivery. Following birth, the newborn takes several powerful breaths, causing the lungs to expand. Surfactant protects the lungs from subsequent collapse. Surfactant deficiency is a major cause of neonatal respiratory distress syndrome (NRDS; hyaline membrane disease)—a severe pulmonary disorder occurring in infants born before their surfactant system becomes functional. Pulmonary surface tension in such infants is so high that widespread alveolar collapse (Atelectasis) ensues. An additional factor contributing to NRDS is fluid retention in the lungs. During the prenatal period, pulmonary epithelial cells secrete a fluid containing Cl-. At birth, these cells absorb Na+ via epithelial sodium channels (ENaCs), and the fluid is reabsorbed alongside Na+. Prolonged immaturity of ENaCs leads to the pulmonary abnormalities characteristic of NRDS.
Inhaling phospholipids alone yields minimal therapeutic benefit in NRDS. However, clinicians can now administer synthetic surfactant or surfactant extracted from bovine lungs via inhalation. Their prophylactic and therapeutic use during delivery has significantly reduced the severity of NRDS, though unfortunately it has not decreased the incidence of chronic lung disease in surviving infants.
Table 34-2. Surfactant Composition
Component |
Content, % |
Dipalmitoylphosphatidylcholine |
62 |
Phosphatidylglycerol |
5 |
Other phospholipids |
10 |
Neutral lipids |
13 |
Proteins |
8 |
2 |

Fig. 34-13. Formation and METABOLISM of surfactant. Lamellar bodies (LBs) are produced by type II alveolar cells and secreted via exocytosis. Material released from lamellar bodies is converted into tubular myelin (TM), which serves as the likely source of the phospholipid surface film (SF). A portion of the surfactant is engulfed by alveolar macrophages, but the majority undergoes endocytosis by type II alveolar cells; N - Nucleus; RER - rough Endoplasmic reticulum; CB - composite bodies (reproduced with permission from Wright JR: Metabolism and turnover of lung surfactant. Am Rev Respir Dis 1987;136:426).
Impaired surfactant maturation frequently leads to partial (segmental) atelectasis in patients undergoing cardiac surgery with mechanical ventilation and cardiac arrest. Furthermore, surfactant deficiency is a contributing factor in pathologies accompanied by main bronchus obstruction, unilateral pulmonary artery occlusion, or prolonged inhalation of 100% O2. Surfactant levels are also known to be reduced in the lungs of smokers. Interesting findings have emerged from studies on excess surfactant lipids and proteins in experimental mice with a GM-CSF Gene knockout. The role of GM-CSF in hematopoiesis is described in Chapter 27. Notably, the pathological changes observed in the lungs of these knockout mice closely resemble those found in humans with pulmonary alveolar proteinosis.
Work of Breathing
The action of the respiratory muscles stretches the elastic Tissues of the chest wall and lungs (elastic work). Moving non-elastic tissues against viscous resistance requires air to flow through the airways (Table 34-3). Because the product of pressure and volume (g/cm2 × cm3 = g × cm) shares the same units as work (force × distance), the work of breathing can be determined using the pressure-relaxation curve (Figs. 34-10 and 34-14). In Fig. 34-14, the total elastic work corresponding to inspiration is represented by area ABCA. Note that the relaxation pressure curve for the entire respiratory system differs from that of the lungs alone. Area ABDEA reflects the actual elastic work expended in increasing the volume of the lungs themselves. The elastic work required to inflate the total respiratory system is lower than that needed to inflate the lungs alone, because part of this work is powered by elastic energy stored in the chest wall. The elastic energy of the chest wall (area AFGBA) equals the energy imparted to the lungs (area AEDCA).
Table 34-3. Components of the Work of Breathing During Quiet Inspiration and the Percentage Contribution of Each
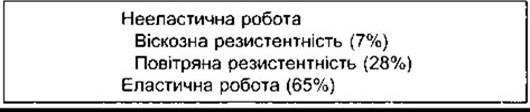
Frictional resistance to airflow is relatively low during quiet breathing; however, as lung volume changes during inspiration and expiration and intrapleural pressure fluctuates, this resistance varies significantly (see Fig. 34-6). This is why the hysteresis curve differs from a straight-line relationship between pressure and lung volume (Fig. 34-15). On the diagram, the area AXBYA represents the work expended in overcoming the resistance of the airways and lung tissue. The energy consumed by airflow through the airways increases when flow becomes turbulent during rapid breathing, compared to when the airflow is laminar. Total resting work of breathing generally ranges from 0.3 to 0.8 kg-m/min. It increases substantially during physical exertion, yet under any circumstances, an individual expends only about 3% of their total energy consumption specifically on breathing during exercise. The work required for breathing increases markedly in conditions such as emphysema, asthma, and acquired Heart disease accompanied by dyspnea and orthopnea. The length-tension relationship in respiratory muscles is nearly identical to that of skeletal and cardiac muscles; when these muscles are overstretched, they contract with less force, and their fatigue or failure (ventilatory failure) leads to inadequate pulmonary ventilation (see Chapter 37). For reasons not yet fully understood, aminophylline increases the contractile force of the human diaphragm, which is why it is used in the Treatment of ventilatory failure.
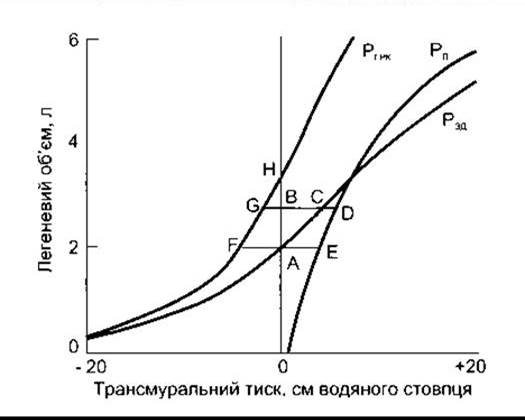
Fig. 34-14. Relaxation pressure curve for the total respiratory system (P) and pressure-relaxation curves for the lungs (Pл) and chest wall (P ). Transmural pressure for the lungs is defined as intrapulmonary minus intrapleural pressure, for the chest wall as intrapleural minus exterior (barometric) pressure, and for the total respiratory system as intrapulmonary minus barometric pressure (modified from Mines AH: Respiratory Physiology, 3rd ed. Raven Press).
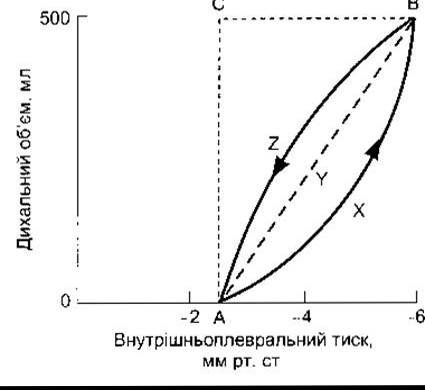
Fig. 34-15. Schematic representation of pressure and volume changes during quiet inspiration (line AXB) and expiration (line BZA). AYB represents the tension line.
Regional Differences in Ventilation and Blood Flow Within the Lungs
In the upright position, ventilation per unit of lung volume is greater in the basal regions than at the apex. This occurs because, at the onset of inspiration, intrapleural pressure is less negative at the base of the lungs than at the apex (Fig. 34-16). When the difference between intrapulmonary and intrapleural pressure becomes smaller than at the apex, the lungs expand to a lesser degree. Conversely, when the lungs are more stretched, their maximum volume increases. Given the Elastic properties of the lungs, a unit increase in their volume is accompanied by a smaller rise in pressure than when the lungs are initially more stretched, resulting in enhanced ventilation in the basal regions. Blood flow is also greater in this area compared to the apex (see below). The variation in blood flow from the apex to the base is more pronounced than the corresponding changes in lung ventilation. Consequently, the ventilation-perfusion ratio is lower at the base of the lungs and higher at the apex. Some of the differences in ventilation and perfusion from the apex to the base are attributed to gravity. These gradients are abolished in the supine position, and in the upright position, the weight of the lungs causes intrapleural pressure to be lower at the base. However, recent spaceflight data have revealed ventilation-perfusion inequalities in various lung regions observed in astronauts during weightlessness. Evidently, additional, yet unidentified factors also contribute to these regional differences.

Fig. 34-16. Upright intrapleural pressures and their effect on ventilation. Note that because intrapleural pressure is atmospheric, the greater negative intrapleural pressure at the apex holds the lungs in a more expanded position at the onset of inspiration. A subsequent increase in volume per unit increase in intrapleural pressure is smaller than at the beginning because further lung expansion is more difficult (reproduced with permission from West JB: Ventilation/Blood Flow and Gas Exchange, 3rd ed. Blackwell, 1977).
It has been established that at very low lung volumes, particularly following a forced expiration, intrapleural pressure at the base of the lungs may exceed the airway pressure, leading to the collapse of small-diameter airways such as respiratory bronchioles (airway closure). In elderly individuals and patients with chronic pulmonary diseases, the elastic recoil of the lungs is diminished, which results in a less negative intrapleural pressure. Consequently, airway closure can occur at the base of the lungs in the upright position even without a forced expiration, at volumes exceeding the functional residual capacity.
The Clinical significance of the EFFECT OF GRAVITY on ventilation is evident in the improvement of arterial oxygenation in patients with unilateral lung disease lying on their healthy side. In infants, this relationship is reversed, although the underlying reasons remain unclear.
Dead Space and Uneven Ventilation
Since Gas Exchange in the respiratory system occurs exclusively in the terminal portion of the airways, the gas contained in the remaining airways is excluded from gas exchange by the pulmonary capillary blood. Under normal conditions, the volume of this dead space in milliliters roughly corresponds to body weight in pounds. For example, in a person weighing 68 kg (150 lbs), only the first 350 mL of a 500 mL inspired breath actually reach the alveoli. Conversely, with each expiration, the first 150 mL originates from the dead space, and only the subsequent 350 mL comes from the alveoli. Consequently, alveolar ventilation represents the volume of air entering the alveoli per minute. Naturally, alveolar ventilation is less than the minute ventilation. Note that due to the dead space, rapid, shallow breathing results in lower alveolar ventilation than slow, deep breathing at the same minute volumes (Table 34-4).
It is clinically important to distinguish between anatomical dead space (the volume of the respiratory system excluding the alveoli) and total (physiological) dead space (the volume of gas that does not undergo gas exchange with the blood, also known as wasted ventilation). In healthy individuals, these two dead spaces are virtually identical; however, in various pathologies, a portion of the alveoli is excluded from gas exchange while another portion is hyperventilated. The volume of gas in unperfused and hyperventilated alveoli required for arterialization in the alveolar capillaries constitutes part of the dead space gas volume (wasted ventilation). Anatomical dead space can be measured by analyzing the single-breath N2 washout curve (Fig. 34-17). Following a normal expiration, the subject takes a maximal inspiration of pure O2, followed by a steady expiration during which N2 concentration is measured. The initial expired gas (Phase I) represents the gas that filled the dead space and contains no N2. This is followed by a mixture of dead space gas and alveolar gas (Phase II), which transitions into pure alveolar gas (Phase III). The dead space volume is defined as the volume of gas expired from the peak of inspiration to the midpoint of Phase II (see Fig. 34-17).
Phase III of the single-breath N2 curve is designated as the closing volume (CV), which transitions into Phase IV, during which the N2 concentration in the expired gas rises sharply. The CV represents the lung volume above residual volume at which dependent airways begin to close. This closure depends on regional reductions in transmural pressure in these lung areas (see above). Gas in the upper lung regions is more enriched with N2 than gas in the lower dependent regions because the upper alveoli are more expanded at the start of the O2 inspiration (see above), resulting in less mixing of N2 with O2. Furthermore, in most normal subjects, the Phase III curve exhibits a slight positive slope before reaching Phase IV. This indicates that a gradual, proportional increase in expired gas originates from the relatively N2-enriched upper lung zones during Phase III. Regional pulmonary ventilation can also be assessed by inhaling the radioactive inert gas isotope xenon (133Xe) and monitoring thoracic radioactivity. Areas showing low radioactivity correspond to poor ventilation.
Table 34-4. Effect of Changes in Respiratory Rate and Depth on Alveolar Ventilation
Respiratory rate |
30/min |
10/min |
Tidal volume |
200 mL |
600 mL |
Minute volume |
6 L |
6 L |
Alveolar ventilation |
(200-150)x30 =1500 mL |
(600-150)x10 =4500 mL |
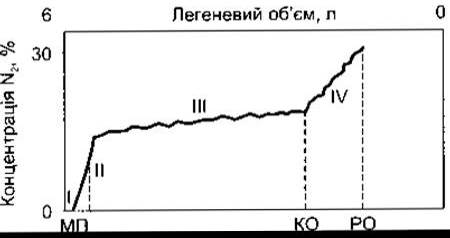
Fig. 34-17. Single-breath N2 washout curve. Following a normal expiration, the subject takes a deep inspiration of pure O2, followed by a slow expiration. The changes in expired N2 concentration are shown, with the various phases indicated by Roman numerals; DS = dead space; CV = closing volume; ERV = expiratory reserve volume.
Total dead space can be calculated from expired PCO2, arterial PCO2, and tidal volume using the Bohr equation:

where PECO2 is expired gas; VT is tidal volume; PaCO2 is arterial gas; VDS is dead space; PICO2 is inspired gas.
The term PICO2 x VDS is so small that it can be neglected, and the equation is solved for VDS. For example, if PECO2 = 28 mmHg, PaCO2 = 40 mmHg, and VT = 500 mL, then VDS = 150 mL.
This equation can also be used to determine the anatomical dead space by substituting PaCO2 with the alveolar PCO2 (PACO2), which represents the PCO2 value in the final 10 ml of expired gas (see below). The PACO2 value is an average for gas from various alveoli, proportional to their ventilation, regardless of perfusion. It is the opposite of PaCO2, which equilibrates only with perfused alveoli and is therefore greater than PACO2 in individuals with unperfused alveoli.
Although it is possible to stay underwater and breathe using a snorkel extending above the water's surface, it should be noted that the snorkel increases the dead space volume. With every milliliter of the snorkel's volume, the depth of inhalation must increase by 1 ml to maintain the same volume of air in the alveoli. Therefore, if the snorkel volume is too large, breathing can become excessively laborious. In addition, extra effort is required against the surrounding water pressure to expand (increase the volume of) the chest cavity.
Last update: 10/08/2026
Editorial and Educational Adaptation: This material has been compiled based on the primary/original source text. The project team performed an editorial review, corrected technical inaccuracies, structured sections, and adapted the content for an educational format.
What was processed:
- elimination of formatting defects (OCR errors, structural breaks, corrupted characters);
- editorial organization of content;
- standardization of terminology in accordance with academic sources;
- verification of factual statements against the original source text.
All mentions of the author, publication year, and origin of the primary text have been preserved in accordance with the source.