Review of Medical Physiology - William F. Ganong 2002
Functions of the Nervous System
Hearing and Equilibrium
Hearing
Sound Waves
Sound is the sensory perception that occurs when longitudinal vibrations—specifically, phases of compression and rarefaction of molecules in the external environment—strike the tympanic membrane. These movements result in a time-varying pressure on the tympanic membrane, which manifests as a series of waves (Fig. 9-11). The totality of such movements in the external environment is referred to as sound waves. In air, sound waves propagate at a speed of 344 m/s at 20°C at sea level. The speed of these waves increases with rising Temperature and altitude. Other media that humans may enter also conduct sound waves, albeit at different velocities. For example, the speed of sound in fresh Water at 20°C is 1450 m/s, and it is even higher in sea water. It is estimated that the whistle of a blue whale reaches an intensity of 188 decibels (see below) and can be heard over a distance of 900 km.
Class="center">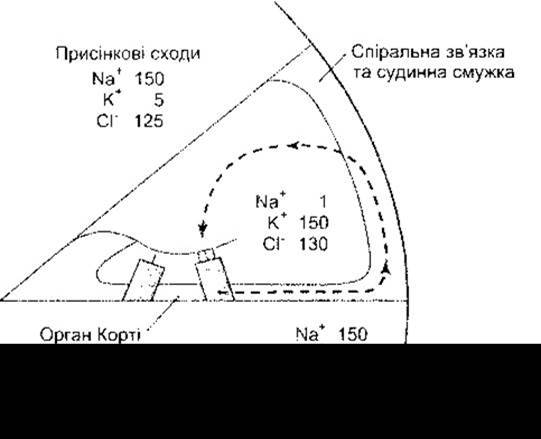
Fig. 9-9. Ionic COMPOSITION OF THE perilymph in the scala vestibuli and scala tympani, as well as the endolymph in the scala media. The dashed line indicates the K+ recycling pathway: from Hair Cells through supporting cells to the spiral ligament, and via the Cells of the stria vascularis into the endolymph.
Loudness correlates with the amplitude of a sound wave, whereas pitch correlates with its frequency (the number of cycles per unit time). The greater the amplitude, the louder the sound; the higher the oscillation frequency, the higher the pitch. In addition to frequency, pitch is influenced by certain other factors that are not fully understood; frequency also exerts a slight effect on loudness, as the hearing threshold is lower for certain frequencies than for others (see below). Repeating sound waves, even when complex, are perceived as musical sounds; non-periodic, non-repeating vibrations produce the sensation of noise. Most musical sounds consist of a fundamental frequency wave that determines the pitch, overlaid with a series of harmonic vibrations (overtones) that impart the characteristic timbre (sound quality) to the tone. Differences in timbre allow us to distinguish the sounds of various musical instruments even when they perform at the same pitch.
The amplitude of a sound wave can be expressed as the maximum pressure change on the tympanic membrane; however, a relative scale, the so-called decibel scale, is more convenient. Sound intensity in bels is the logarithmic expression of The ratio of the intensity of the sound under investigation to a specified acoustic standard: 1 decibel (dB) equals 0.1 bel. Therefore,

Sound intensity is proportional to the area of sound pressure. Therefore,

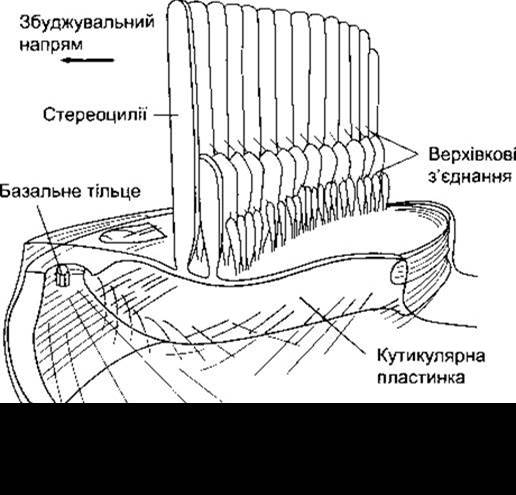
Fig. 9-10. Structure OF THE apical region of a hair Cell. Note the apical junctions between the rows of stereocilia. The arrow indicates the direction in which Displacement of the stereocilia leads to an increased ion influx into the hair cells (reprinted with permission from Hackney CM, Furness DN: Mechanotransduction in vertebrate hair cells: Structure and function of the stereociliary bundle. Am J Physiol 1995;268:C1).
According to the standard of the Acoustical Society of America, 0 decibels is defined as a pressure of 0.000204 N/cm2, which represents the threshold of hearing for the average human. Fig. 9-12 shows the decibel values for common sounds. It should be borne in mind that the decibel scale is logarithmic. Therefore, 0 decibels does not mean the absence of sound, but rather reflects the presence of a sound whose intensity corresponds to the standard. Furthermore, the range between 0 and 140 decibels—which spans from the lower threshold of hearing to levels that can damage The Organ of Corti—practically represents a tenfold million-fold (107) difference in the pressure exerted by waves on the tympanic membrane. In other words, if atmospheric pressure at sea level is 1 bar, the intensity range from a barely audible sound to one potentially destructive to the cochlea encompasses pressures from 0.0002 to 2000 microbars.
Humans can hear sound frequencies ranging from 20 to 20,000 Hz (hertz, or cycles per second). Some animals, notably bats and dogs, perceive sounds of much higher frequencies. The thresholds of the human ear vary for different pitches, reaching maximum sensitivity in the 1-4 kHz range. By comparison, the pitch of a male voice is about 120 Hz, and that of an average female voice is 250 Hz. The average person can distinguish up to 2,000 tones, although musical training can significantly increase this number. Tones in the 1-3 kHz range are the easiest to discriminate, whereas frequencies above or below this range are considerably more difficult to distinguish (Fig. 9-13).
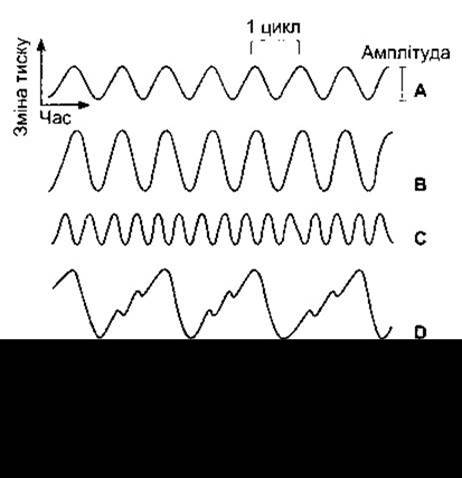
Fig. 9-11. Characteristics of sound waves: A - tracing of a pure tone; B - tracing of a sound with a larger amplitude and greater loudness than in fragment A; C - sound with the same amplitude as in fragment A, but of a higher frequency and consequently higher pitch; D - complex, periodically repeating sound wave. Fragments A-D are graphical representations of musical sounds, whereas the waves in fragment E are disordered and possess the character of noise.
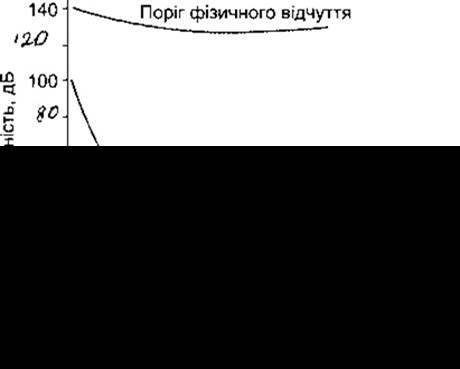
Fig. 9-13. Graphs of human sound perception. The middle curve was obtained by audiometry under normal conditions, and the lower curve under ideal conditions. At 140 dB, sounds are not only heard but also felt physically.
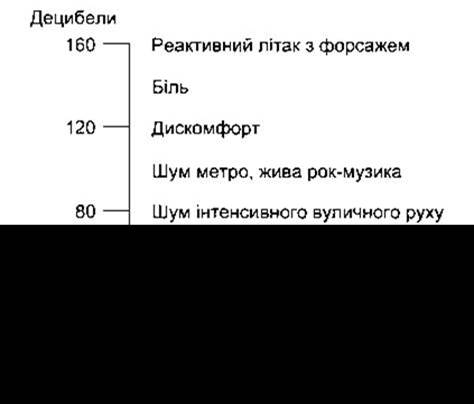
Fig. 9-12. Intensity of common sounds.
Masking
It is well known that one sound can impair a person's ability to hear other sounds. This phenomenon is termed masking. Masking is thought to be caused by the relative or absolute refractoriness of previously stimulated auditory receptors and nerve fibers to new stimuli. The degree of masking depends on the pitch. The masking effect of ambient noise, in the absence of reliable ear protection, leads to a noticeable elevation of the hearing threshold.
Sound Transmission
In the ear, environmental sound waves are converted into action potentials in the auditory nerves. Via the tympanic membrane and auditory ossicles, sound vibrations are transmitted to the Base of the stapes, the movements of which cause fluid oscillations within the Inner ear. Driven by these vibrations, the organ of Corti generates action potentials in the nerve fibers.
Functions of the Tympanic Membrane and Auditory Ossicles
In response to pressure changes caused by the action of sound waves on its outer surface, the tympanic membrane moves inward and outward. It acts as a resonator that reproduces the vibrations of the sound source. The vibrations of the tympanic membrane cease almost simultaneously with the Termination of the sound; that is, it has a very short critical damping period. The Movements of the tympanic membrane are transmitted to the handle of the malleus, which rotates around an axis passing through the junction of its long and short processes. As a result, the short process transmits the vibrations to the incus, which in turn passes them on to the HEAD of the stapes. The movements of the stapes head cause its footplate to rock back and forth like a hinged door anchored at the posterior edge of the oval window. In this manner, the auditory ossicles act as a lever system that converts the resonant vibrations of the tympanic membrane into movements of the stapes, and through it, into movements of the perilymph in the scala vestibuli of the cochlea (see Fig. 9-2). This system amplifies the pressure of sound waves reaching the oval window, because the lever System of the malleus and incus increases the force of the strokes by a factor of 1.3, while the area of the tympanic membrane significantly exceeds the area of the stapes footplate. Although the inertia and resistance of the entire system cause some loss of sound energy, it has been calculated that at frequencies up to 3,000 Hz, approximately 60% of the sound energy striking the tympanic membrane reaches the perilymph of the scala vestibuli.
Tympanic reflex
During contraction, the Muscles of the Middle ear (the stapedius and tensor tympani) pull the malleus inward and the base of the stapes outward, which attenuates sound transmission. Loud sounds trigger a reflex contraction of these muscles, known as the tympanic reflex. This reflex serves a protective function by preventing the overstimulation of auditory receptors by loud sounds. The reaction time of the tympanic reflex is 40–160 ms, meaning it cannot protect against brief, high-intensity sounds such as gunshots.
Bone and air conduction
The propagation of sound waves through the tympanic membrane and auditory ossicles to the fluid of the inner ear—the primary pathway for normal hearing—is referred to as ossicular conduction. Sound waves also cause vibrations of the secondary tympanic membrane, which seals the round window. This phenomenon is known as air conduction, though it plays no significant role in normal sound perception. A third type of sound propagation, bone conduction, involves the transmission of environmental vibrations directly to the inner-ear fluid via the BONES OF THE Skull. Pronounced bone conduction occurs when a tuning fork or another vibrating object is placed directly against the skull. This type of conduction is also important for the perception of very loud sounds.
Traveling waves
Movements of the stapes footplate generate a series of traveling waves in the perilymph of the scala vestibuli, which are graphically represented in Fig. 9-14. As a wave travels along the cochlea, its height reaches a maximum at a specific point and then rapidly decreases. The distance from the stapes footplate to the point in the cochlea where the wave reaches its maximum height depends on the frequency of the vibrations that generated it. High-frequency waves reach their maximum near the base of the cochlea, whereas low-frequency waves peak near the apex. While the bony walls of the scala vestibuli are rigid, Reissner's membrane is flexible. Driven by fluid pressure, the basilar membrane can also easily shift into the scala tympani at the peaks of the waves originating in the scala vestibuli. The perilymph vibrations of the scala tympani are dissipated into the air through the round window. In this manner, sound waves cause a displacement of the basilar membrane, with the point of maximum displacement determined by the wave frequency. The apical portion of the hair cells in the organ of Corti is anchored by the reticular lamina, and the stereocilia of the outer hair cells are embedded in the tectorial membrane (see Fig. 9-4). During movements of the stapes, both membranes shift in the same direction; however, because they are oriented at different angles in space, their relative displacement causes the stereocilia to bend. The stereocilia of the inner hair cells do not Touch the tectorial membrane, yet they also bend in response to endolymph displacements in the space between the tectorial membrane and the tips of the hair cells.
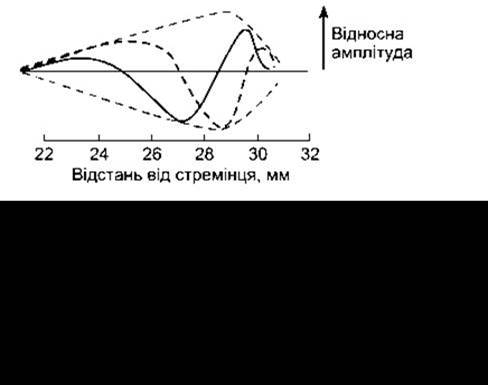
Fig. 9-14. Traveling waves. Top: Solid and short-dashed lines represent waves recorded at different moments in time. The long-dashed line represents the sound "corridor" formed by connecting the peaks that occur in temporal progression. Bottom: Displacement of the basilar membrane by waves generated as a result of stapes oscillations at the frequencies indicated near the peak of each curve.
Functions of inner and outer hair cells
The inner hair cells are the primary sensory cells of the organ of Corti, responsible for generating action potentials in the auditory nerves, presumably in response to the fluid displacements described above.
The outer hair cells are innervated by cholinergic efferent nerve fibers originating from the superior olivary complexes. These cells shorten upon depolarization and elongate upon hyperpolarization. Outer hair cells are hyperpolarized by acetylcholine released from efferent nerve fibers. Their function is to increase the amplitude and sharpen the peaks of basilar membrane vibration, although the fine mechanisms of this process remain incompletely understood.
Action potentials of auditory nerve fibers
The firing rate of individual auditory nerve fibers is proportional to the intensity of sound stimuli. At low sound intensities, each axon discharges only in response to a specific frequency, corresponding to the region of the cochlea it represents. At higher sound intensities, axons discharge in response to a broader spectrum of sound frequencies (Fig. 9-15), or more precisely, they respond to waves with frequencies below their excitation threshold.
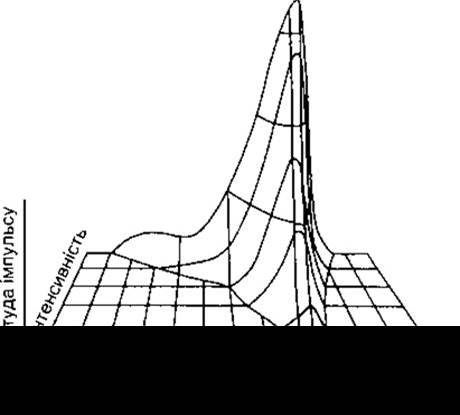
Fig. 9-15. Relationship between the amplitude of impulses in auditory nerve fibers and sound frequency and intensity. Because the diagram illustrates the general response pattern of many nerve fibers, the axes do not include numerical values (modified and reprinted with permission from Kiang NYS: Peripheral neural Processing of auditory information. Handbook of physiology. Section 1, The Nervous system, vol 3, part 2. Brookhart JM, Mountcastle VB [editors] American Physiological Society, 1984).
The primary factor determining perceived pitch is the region of maximum stimulation within the organ of Corti. A traveling wave caused by a sound of a specific frequency produces maximum deflection of the basilar membrane and, consequently, maximum excitation of receptor cells at a single point. As noted above, the distance between this point and the stapes footplate is inversely proportional to pitch: low tones cause maximum stimulation near the apex of the cochlea, whereas high tones do so near its base.
Neural Pathways projecting from different Regions of the cochlea to the Brain differ. An additional factor in the perception of tones up to 2,000 Hz may be the temporal pattern of auditory nerve action potentials. At low sound frequencies, nerve fibers fire an impulse with each cycle of the sound wave. The Significance of this volley effect is limited, as the firing rate of a given nerve fiber encodes loudness rather than pitch.
Although pitch depends primarily on the frequency of the sound wave, loudness also plays a role in its perception: low tones (below 500 Hz) sound lower, and high tones (above 4,000 Hz) sound higher as loudness increases. Sound duration also exerts a minor influence on pitch perception. Tone cannot be determined if a sound lasts less than 0.01 s; between 0.01 and 0.1 s, pitch perception increases with duration. Finally, the pitch of complex sounds consisting of multiple harmonic frequencies is perceived even in the absence of the fundamental frequency (base tone).
Auditory responses of Brainstem Neurons
The response of individual second-order neurons in the cochlear Nucleus to sound stimuli is similar to that of individual auditory nerve fibers. The frequency at which low-intensity sounds elicit a response varies among individual segments; as sound intensity increases, the range of frequencies that trigger a response expands. The main difference between first- and second-order neuronal responses lies in the sharper low-frequency cutoff ("inhibitory side-bands") of brainstem neurons. The higher Specificity of second-order neurons is likely due to inhibitory processes within the brainstem, although the exact mechanism remains unclear.
Primary auditory cortex
The pathways from the cochlea to the auditory cortical areas were outlined at the beginning of this chapter. Ascending impulses travel from the dorsal and ventral cochlear nuclei along complex pathways, some of which cross the midline (decussate) while others do not. Animals possess an orderly tonotopic representation in the primary auditory cortex—much like an unrolled cochlea mapped across its surface. In humans, low tones are processed by the anterolateral regions of the auditory cortex, and high tones by the posteromedial regions. In this case, pitch is encoded in the Cerebral Cortex rather than raw sound frequency, because when a complex sound is played without its fundamental frequency (see above), the cortical area corresponding to the perceived pitch is still stimulated. Therefore, The conversion of sound frequency into perceived pitch must occur at subcortical levels.
Other auditory cortical areas
The Use of positron emission tomography (PET) and functional MRI (fMRI) (see Chapter 16) has led to a rapid expansion of knowledge regarding human auditory association areas. The auditory cortical pathways rival the visual pathways in processing complexity and in the presence of two main streams. In the auditory system, the dorsal-parietal pathway is presumably involved in sound localization (answering the "where" question). Parietal regions are linked to the tracking of moving sound sources; interestingly, neurons that respond exclusively to nearby sounds—which presumably carry the highest survival value for the animal—have been discovered in the frontal cortex of monkeys. Conversely, the human temporal lobes contain ventral pathways that answer the "what" question; neurons in these pathways selectively respond to voices. These voice-selective regions may be functionally analogous to the face-recognition areas of the visual cortex (see Chapter 8).
Similar to the somatic and visual cortical systems, the auditory system is shaped by experience and other factors. An expansion of cortical sound-processing areas driven by auditory stimulation, coupled with high-frequency stimulation of basal Forebrain pathways, is described in Chapter 7. Evidence of auditory plasticity in humans comes from studies of individuals who lost their hearing before acquiring spoken language: visual language symbols activate auditory association areas beyond the primary auditory cortex in these individuals. Conversely, individuals who lost their sight in early childhood localize sound significantly better than normally sighted people. Other studies have shown that infants older than six months rapidly develop enhanced neural responses to sounds specific to their native language, while responses to non-native sounds gradually fade.
Musicians provide additional Examples of cortical plasticity. For instance, as a result of constant stimulation by musical tones, the size of their auditory areas increases. Furthermore, violinists exhibit a slightly altered somatosensory representation of the fingers required for playing the violin. Due to acquired fine finger motor skills, musicians also have a significantly larger Cerebellum compared to non-musicians.
A portion of the posterior superior temporal gyrus, known as the planum temporale (Fig. 9-16), is typically larger on the left than on the right, particularly in right-handed individuals. This region has been implicated in speech and auditory perception. An interesting and as yet unexplained observation is that the left planum temporale exceeds its normal size in musicians and individuals with absolute pitch. General aspects of cortical Asymmetry are discussed in Chapter 16.
Sound Localization
Determining the direction of a sound source in the horizontal plane relies on detecting the interaural time difference of the stimulus arriving at both ears, which results in a phase difference between the sound waves on either side of the head. The fact that the sound is louder on the side closer to the source is also significant. The time difference, which can be as small as 20 µs, is considered the primary cue for sound localization at frequencies up to 3,000 Hz, whereas at higher frequencies, interaural intensity differences play the decisive role. Auditory cortex neurons receiving inputs from both ears show a maximum or minimum response when the arrival of the sound signal at one ear is delayed by a specific interval relative to the other. This interval varies among different neurons.
Sounds originating from in front of the listener differ from those arriving from behind because each pinna is angled slightly forward. In addition, the pattern of sound wave reflection from the pinna surface changes as a sound source moves upward or downward; these spectral modifications are the primary factor in vertical sound localization. Sound localization is severely impaired following lesions of the auditory cortex.
Audiometry
Hearing acuity is typically measured using an audiometer. This device generates pure tones of specific frequencies, which the test subject perceives through headphones. For each frequency, the hearing threshold is determined and plotted on a diagram as a percentage of normal hearing. Such a diagram provides an objective representation of the degree of hearing loss and a qualitative Assessment of the most affected frequency ranges.
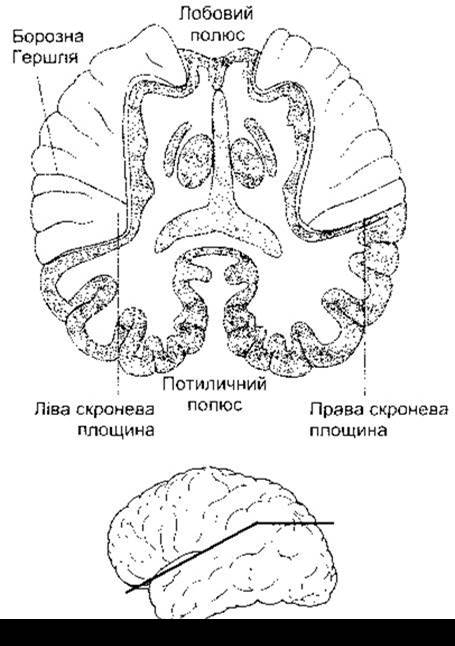
Fig. 9-16. Left and right plana temporalia of the cerebral hemispheres. Horizontal section along the Sylvian fissure (the orientation of the section plane is shown in the lower part of the figure) (reprinted with permission from Kandel ER, Schwartz JH, Jessel TM [editors]: Principles of Neural Science, 3rd ed. McGraw-Hill, 1991).
Deafness
Clinical deafness can result from impairments in sound transmission through the outer or middle ear (conductive deafness), or from damage to hair cells or neural pathways (sensorineural deafness). These two forms of hearing impairment are distinguished using various simple tuning fork tests. Three such tests, named after their authors, are presented in Table 9-1. The Weber and Schwabach tests reflect the masking effect of ambient noise on the hearing threshold.
Causes of conductive deafness include occlusion of the external auditory canals by cerumen or foreign bodies, damage to the ossicles, thickening of the tympanic membrane due to recurrent middle ear infections, or excessive fixation of the stapes footplate to the oval window. Aminoglycoside Antibiotics, such as streptomycin and gentamicin, block mechanosensitive Ion Channels in the stereocilia of hair cells and can cause hair cell degeneration, leading to sensorineural deafness and vestibular dysfunction. The destruction of outer hair cells resulting from prolonged exposure to intense noise is also associated with hearing loss. Other causes include tumors of the Vestibulocochlear nerve and cerebellopontine angle, as well as vascular brain lesions. Presbycusis—a progressive, age-related hearing loss affecting more than one-third of individuals over the age of 75—is presumably caused by the gradual degeneration of both hair cells and neurons.
Deafness caused by Gene Mutations affects approximately 0.1% of all newborns. In 30% of cases, it is accompanied by anomalies in other Organ Systems (syndromic deafness), while in the remaining 70%, it is the only overt defect (nonsyndromic deafness). Evidence suggests that mutation-induced nonsyndromic deafness initially manifests in adulthood and accounts for up to 16% of individuals with severe hearing impairment. In recent years, many gene mutations leading to deafness have been described. This has not only broadened our understanding of the Pathophysiology of deafness but has also provided valuable insights into auditory physiology. Today, it is known that normal hearing requires the METABOLISM/31.html">Transcription products of more than 100 genes, and deafness loci have been mapped to 19 of the 24 Human Chromosomes.
An interesting example of Proteins whose mutation leads to hearing loss is connexin 26. Defects in connexons caused by this protein (see Chapter 1) presumably disrupt normal K+ recycling through supporting cells (see Fig. 9-9). Deafness is also caused by mutations in three non-Muscle myosins (see Chapter 1). These include Myosin VIIa, which, in its Actin-bound form, is localized in the projections of hair cells; myosin Ib, which is likely a component of the "adaptation motor" regulating tension at the tip links of hair bundles (see above); and myosin IV, which is essential for The formation of normal cilia. Furthermore, deafness can be associated with mutant forms of α-tectorin, one of the major Proteins of the tectorial membrane.
An example of syndromic deafness is Pendred syndrome, in which a mutation in a sulfate transporter protein causes deafness and goiter. Another example is
long QT syndrome, which involves a mutation in a K+ channel protein, specifically KVLQT1. Within the cells of the stria vascularis, this protein helps maintain a high K+ concentration in the endolymph, whereas in the cardiac cycle, its role is to ensure a normal QT interval. Individuals homozygous for the mutant KVLQT1 gene are deaf and prone to ventricular arrhythmias and sudden death, which are hallmark features of long QT syndrome (see Chapter 28).
Last update: 10/08/2026
Editorial and Educational Adaptation: This material has been compiled based on the primary/original source text. The project team performed an editorial review, corrected technical inaccuracies, structured sections, and adapted the content for an educational format.
What was processed:
- elimination of formatting defects (OCR errors, structural breaks, corrupted characters);
- editorial organization of content;
- standardization of terminology in accordance with academic sources;
- verification of factual statements against the original source text.
All mentions of the author, publication year, and origin of the primary text have been preserved in accordance with the source.