Biochemical Foundations of Human Vital Activity - Volkov N.I., Nesen E.N. 2000
Biochemistry of Sports
Biochemical Control in Sports
Main biochemical parameters of blood and urine composition, and their changes during muscular activity
Indicators of Carbohydrate METABOLISM
Glucose. Blood glucose levels are maintained at a relatively constant range of 3.3–5.5 mmol ⋅ L-1 (80–120 mg%) by specialized regulatory mechanisms. Fluctuations in blood glucose during muscular activity vary by individual, depending on the body's level of conditioning, as well as the intensity and duration of Physical Exercise. Short bouts of high-intensity (submaximal) exercise can cause an increase in blood glucose due to the enhanced mobilization of hepatic Glycogen. Conversely, prolonged physical exertion leads to a decrease in blood glucose levels, a reduction that is more pronounced in untrained individuals than in trained athletes. Elevated blood glucose indicates intensive hepatic Glycogenolysis or relatively low glucose uptake by Tissues, whereas low blood glucose points to depleted hepatic glycogen stores or high rates of glucose utilization by the body's tissues.
Changes in blood glucose levels reflect The rate of its Aerobic Oxidation in body tissues during muscular activity and the rate at which Liver glycogen is mobilized. This carbohydrate metabolism metric is rarely used on its own in sports Diagnostics, as blood glucose levels depend not only on the physical stress placed on the body, but also on a person's emotional state, humoral regulatory mechanisms, diet, and other factors.
In healthy individuals, glucose is absent from the urine; however, it may appear during intense muscular activity, pre-start emotional excitement, and following excessive carbohydrate intake (alimentary glucosuria) As a result of elevated blood glucose (hyperglycemia). The appearance of glucose in the urine during physical exertion indicates intensive mobilization of liver glycogen. Persistent glucosuria serves as a diagnostic test for Diabetes Mellitus.
Class="center">
Fig. 214 Changes in CrP (1) and ATP (2) reserves, lactate concentration in Skeletal Muscle (3), arterial blood (4), and femoral venous blood (5) during heavy physical work, as well as arterial (6) and femoral venous (7) blood pH values
Lactic Acid. The Glycolytic Pathway of ATP resynthesis in skeletal Muscles concludes with The formation of lactic acid, which subsequently enters the bloodstream. Its release into the blood following the cessation of work occurs gradually, peaking between the 3rd and 7th minutes of recovery. Under resting conditions, normal blood lactic acid levels range from 1 to 1.5 mmol ⋅ L-1 (15–30 mg%) and rise significantly during intense physical exertion (Fig. 214). This accumulation in the blood corresponds to accelerated production within the muscles, which increases sharply following intense short-term exertion and can reach approximately 30 mmol ⋅ kg-1 of body mass upon exhaustion. Lactic acid concentrations are higher in venous blood than in arterial blood. As exercise intensity increases, blood lactate may rise to 5–6 mmol ⋅ L-1 in untrained individuals and to 20 mmol ⋅ L-1 or higher in trained athletes (see Fig. 146). During aerobic exercise, lactate levels typically range from 2 to 4 mmol ⋅ L-1; in mixed-intensity exercise, from 4 to 10 mmol ⋅ L-1; and in anaerobic exercise, exceeding 10 mmol ⋅ L-1. The conventional threshold of Anaerobic Metabolism corresponds to 4 mmol of lactate per 1 liter of blood and is referred to as the anaerobic threshold (AnT) or lactate threshold (LT).
A decrease in blood lactate in the same athlete performing a standardized workload at different stages of training indicates improved physical conditioning, whereas an increase points to a decline in fitness.
Significant blood concentrations of lactic acid following maximal exertion indicate a higher level of conditioning coupled with superior athletic performance, or a greater metabolic capacity for Glycolysis along with an increased resistance of its Enzymes to acidotic pH shifts.
Thus, changes in blood lactic acid concentration following a specific physical workload are closely linked to an athlete's level of conditioning. Monitoring these changes helps assess the body's anaerobic glycolytic capacity, which is vital for athlete Selection, The Development of motor skills, and The regulation of training loads and recovery processes.
Indicators of Lipid Metabolism
Free Fatty acids. As Structural components of Lipids, circulating free fatty acids reflect the rate of triglyceride lipolysis in The Liver and adipose tissue depots. Under normal conditions, their blood concentration is 0.1–0.4 mmol ⋅ L-1 and increases during prolonged physical exertion.
Tracking changes in blood free fatty acids allows specialists to evaluate the extent to which lipids are recruited to meet the energy demands of muscular activity, as well as the energetic efficiency of metabolic systems and the degree of coupling between lipid and carbohydrate metabolism. A high degree of coupling between these energy-supplying mechanisms during aerobic exercise is a marker of an athlete's high level of functional preparedness.
Ketone Bodies. These are synthesized in the liver from acetyl-CoA during the accelerated Oxidation of Fatty acids in body tissues. Ketone bodies leave the liver via the bloodstream and are delivered to tissues, where the majority are utilized as an energy substrate and a minor portion is excreted. Blood ketone levels generally reflect the rate of fat oxidation. Under normal conditions, blood ketone concentrations are relatively low, at 8 mmol ⋅ L-1. When they accumulate to 20 mmol ⋅ L-1 (ketonemia), they may spill over into the urine (ketonuria), whereas they are normally undetectable in urine. In healthy individuals, ketonuria occurs during fasting, carbohydrate elimination from the diet, and very intense or prolonged physical exertion. This indicator also holds diagnostic value in identifying diabetes mellitus and thyrotoxicosis.
An elevated blood concentration and urinary excretion of ketone bodies signal a metabolic shift from carbohydrate to lipid energy substrates during muscular activity. An earlier recruitment of lipid sources indicates greater economy in the aerobic mechanisms of muscular energy supply, which correlates with improvements in physical conditioning.
Cholesterol. This steroid lipid does not participate in the body's energy-yielding processes. Normal plasma cholesterol ranges from 3.9 to 6.5 mmol ⋅ L-1 and varies by sex (higher in men), age (lower in children), diet (lower in vegetarians), and physical activity levels. A persistent rise in plasma cholesterol and its specific lipoprotein fractions serves as a diagnostic indicator of atherosclerosis, a severe vascular disease (see Chapter 10). A direct correlation has been established between coronary disorders and blood cholesterol concentration (Fig. 215). Vascular damage can lead to myocardial ischemia or infarction when affecting Heart vessels, strokes in cerebral vessels, and limb atrophy in peripheral Vessels of the legs.

Fig. 215 Correlation between cardiovascular diseases and blood cholesterol concentration
Recent studies have shown that dietary fiber found in vegetables, fruits, dark bread, and other foods, alongside lecithin and regular exercise, helps promote the Elimination of Cholesterol from The Human Body.
Lipid Peroxidation (LPO) Products. Physical exertion intensifies lipid peroxidation processes, leading to the accumulation of peroxidation products—a key factor that can limit physical performance. Consequently, Biochemical Monitoring of the body's response to exercise, assessments of an athlete's specialized fitness, and evaluations of tissue damage depth during stress syndrome development involve analyzing blood levels of lipid peroxidation products, such as malondialdehyde and diene conjugates, along with the activities of enzymes like Glutathione peroxidase, glutathione reductase, and catalase.
Phospholipids. Normal blood phospholipid levels range from 1.52 to 3.62 g ⋅ L-1. Elevated levels are observed in diabetes, Kidney disease, hypothyroidism, and other Metabolic Disorders, while decreased levels occur in Fatty liver disease, i.e., when the hepatic structures responsible for their synthesis are damaged. To stimulate phospholipid synthesis and lower blood triglycerides, an increased intake of lipotropic substances is required. Because prolonged physical endurance training is often accompanied by fatty liver changes, sports practice sometimes incorporates the monitoring of blood triglycerides and phospholipids.
Indicators of Protein metabolism
Hemoglobin. The primary protein of red Blood Cells is hemoglobin, which performs the critical function of Oxygen transport. It contains iron, which binds atmospheric oxygen. Hemoglobin concentration depends on sex—averaging 7.5–8.0 mmol ⋅ L-1 (120–140 g ⋅ L-1) in women and 8.0–10.0 mmol ⋅ L-1 (140–160 g ⋅ L-1) in men—as well as on the individual's conditioning level. Muscular activity sharply increases the body's oxygen demand, which is met by more complete oxygen extraction from the blood, elevated blood flow velocity, and a gradual increase in total hemoglobin mass driven by changes in total blood volume. As endurance athletes become better conditioned, blood hemoglobin concentration increases on average to 130–150 g ⋅ L-1 in women and 160–180 g ⋅ L-1 in men. This elevation in hemoglobin content partly reflects physiological adaptation to physical exertion under hypoxic conditions.
Intense training—particularly among female athletes in cyclical sports—combined with poor Nutrition, can lead to red blood Cell breakdown and a drop in hemoglobin concentration to 90 g L-1 or lower, a condition recognized as iron-deficiency "sports anemia." In such cases, the training regimen should be modified, and the diet enriched with protein, iron, and B-group Vitamins.
Blood hemoglobin levels provide valuable insight into the body's aerobic capacity, the efficacy of aerobic training sessions, and the overall health status of the athlete.
Myoglobin. The sarcoplasm of skeletal and cardiac muscles contains a highly specialized protein that performs the function of oxygen transport, much like hemoglobin. The normal blood myoglobin level is negligible (10–70 ng ⋅ L-1). Under The Influence of physical exertion or pathological conditions, it can leak from the muscles into the blood, leading to elevated blood levels and its appearance in the urine (myoglobinuria). The concentration of myoglobin in the blood depends on the volume of physical work performed and the athlete's level of conditioning. Therefore, this indicator can be used to diagnose the functional state of working skeletal muscles.
Actin. The content of actin in skeletal muscles, serving as a structural and contractile protein, significantly increases during training. Although tracking changes in its concentration could theoretically help monitor the development of an athlete's speed-and-strength qualities, determining its exact level in Muscle tissue presents major methodological challenges. Nevertheless, actin appears in the blood following physical exertion, indicating the breakdown or remodeling of skeletal muscle myofibrillar structures. Blood actin levels are determined via radioimmunoassay and used to assess tolerance to physical loads and the rate of myofibril recovery after muscular work.
Albumins and globulins. These are low-molecular-weight major Blood Plasma Proteins. Albumins account for 50–60% of all Serum proteins, and globulins make up 35–40%. They perform diverse Functions in the body: they are part of The Immune System (especially globulins) and protect against infections, help maintain blood pH, transport various organic and inorganic substances, and serve as building blocks for Other Compounds. Their quantitative ratio in blood serum is normally relatively constant and reflects the state of human health. This protein ratio shifts during fatigue and various illnesses, making it a valuable diagnostic indicator in sports medicine.
Urea. During the accelerated breakdown of tissue proteins and an excessive intake of Amino Acids, the liver synthesizes a non-toxic nitrogenous substance—urea—as a way to neutralize ammonia (NH3), which is toxic to the human body. From the liver, urea enters the bloodstream and is excreted in the urine.
The normal blood urea concentration for any healthy adult is individual, typically ranging from 3.5 to 6.5 mmol ⋅ L-1. It may rise to 7–8 mmol ⋅ L-1 with a high-protein diet, reach 16–20 mmol ⋅ L-1 in cases of impaired renal excretory function, and exceed 9 mmol ⋅ L-1 following prolonged physical work due to intensified Protein Catabolism.
In sports practice, this indicator is widely used to evaluate an athlete's tolerance to training and competitive loads, monitor training progress, and track recovery processes. To obtain objective data, urea concentration is measured in the morning on an empty Stomach the day after training. If the physical load corresponds to the body's functional capacity and metabolism recovers relatively quickly, morning fasting blood urea levels return to normal (Fig. 216). This occurs due to the balancing of protein Synthesis and Breakdown rates in body tissues, signaling recovery. If the urea level remains above normal the next morning, it indicates incomplete recovery or the onset of fatigue.
Detection of protein in urine. Healthy individuals have no protein in their urine. Its appearance (proteinuria) is observed in kidney diseases (nephrosis), Urinary Tract infections, as well as after excessive protein intake or anaerobic muscular activity. This is caused by impaired permeability of renal cell membranes due to acidification of the body's internal environment, allowing plasma proteins to leak into the urine.
The concentration of urinary protein following physical exertion serves as an indicator of its intensity. For instance, after work in the high-intensity zone, it accounts for 0.5%, whereas after work in the submaximal intensity zone, it can reach 1.5%.
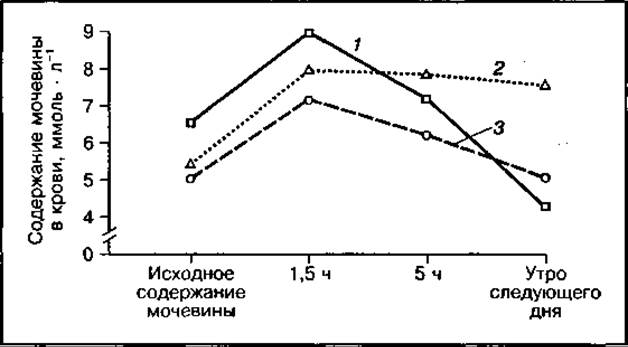
Fig. 216. Blood urea levels in rowers during rest (1.5 h, 5 h, and the morning after a training day): 1 — complete recovery; 2, 3 — varying degrees of incomplete recovery
Creatinine. This substance is formed in muscles during The breakdown of creatine phosphate. Its daily urinary excretion is relatively constant for a given individual and depends on total muscle mass. In men, it ranges from 18 to 32 mg ⋅ kg-1 of body mass per day, and in women, from 10 to 25 mg ⋅ kg-1. Urinary creatinine levels provide an indirect estimate of the rate of the creatine kinase reaction and The amount of lean body mass. The lean body mass can be calculated from the amount of creatinine excreted in the urine using the following formula:
lean body mass = 0.0291 × urinary creatinine (mg ⋅ day-1) + 7.38.
Changes in lean body mass indicate an increase or decrease in an athlete's weight specifically due to protein tissue. These data are particularly important in bodybuilding and strength sports.
Creatine. Creatine is normally absent from the urine of healthy adults. It is detected during overtraining and pathological muscle changes, making its presence in urine a useful test for identifying the body's reaction to physical stress.
Creatine is constantly present in the urine of young children, which is due to the rate of its synthesis exceeding its utilization in skeletal muscles.
Acid-Base Balance (ABB) Indicators of the Body
During intense muscular activity, large amounts of lactic and pyruvic acids are produced in the muscles; these diffuse into the blood and can cause metabolic acidosis, leading to muscle fatigue accompanied by soreness, dizziness, and nausea. Such metabolic changes are associated with the depletion of the body's buffer reserves. Because the condition of the body's buffer systems is critical for high physical performance, ABB indicators are widely used in sports diagnostics. Normally, ABB indicators are relatively constant and include:
✵ Blood pH (7.35–7.45);
✵ pCO2 — partial pressure of carbon dioxide (H2CO3 + CO2) in the blood (35–45 mmHg);
✵ SB — standard Blood Plasma bicarbonate HCO-3, which accounts for 22–26 mEq ⋅ L-1 when blood is fully saturated with oxygen;
✵ BB — buffer bases of whole blood or plasma (43–53 mEq ⋅ L-1), representing the total buffering capacity of blood or plasma;
✵ NBB — normal buffer bases of whole blood at physiological pH and alveolar air CO2 values;
✵ BE — base excess or alkaline reserve (from -2.4 to +2.3 mEq ⋅ L-1), indicating a surplus or deficit in buffer capacity (BB - NBB = BE).
ABB indicators reflect not only Changes in the Blood Buffer Systems but also the functional state of the respiratory and excretory Organs. Acid-base equilibrium (ABE) in the body is characterized by a stable blood pH (7.34–7.36). An inverse correlation has been established between the dynamics of blood lactate and changes in blood pH. Monitoring ABB parameters during muscular activity allows trainers and scientists to track the body's response to physical loads and the Development of the athlete's fitness, as Biochemical Control of ABB can be based on measuring any one of these indicators.
TABLE 50 Changes in the Acid-Base Balance of the Body
Acid-base balance |
Urine pH |
Plasma HCO3-, mmol ⋅ L-1 |
Plasma H2CO3, mmol ⋅ L-1 |
Norm |
6-7 |
25 |
0,625 |
Respiratory acidosis |
↓ |
↑ |
↑ |
Respiratory alkalosis |
↑ |
↓ |
↓ |
Metabolic acidosis |
↓ |
↓ |
↓ |
Metabolic alkalosis |
↑ |
↑ |
↑ |
Note. The arrow direction indicates an increase or decrease in the parameters.
The most informative indicator of the acid-base balance is the base excess (BE) value—the alkaline reserve, which increases with the qualification level of athletes, particularly those specializing in speed and strength sports. Large buffer reserves of the body serve as a solid prerequisite for improving athletic performance in these sports.
The active reaction of urine (pH) directly depends on the body's acid-base status. In metabolic acidosis, urine acidity increases to pH 5, whereas in metabolic alkalosis, it drops to pH 7. Table 50 shows the directional changes in urine pH values in relation to plasma acid-base parameters (after T.T. Berezov and B.F. Korovkin, 1998).
BIOLOGICALLY ACTIVE SUBSTANCES: Regulators of metabolism
Enzymes. Tissue enzymes are of particular interest in sports diagnostics; under various functional states of the body, these enzymes enter the blood from skeletal muscles and other tissues. Such enzymes are termed cellular or indicator enzymes. They include aldolase, catalase, Lactate dehydrogenase, creatine kinase, and others. Certain cellular enzymes, such as skeletal muscle lactate dehydrogenase, exhibit multiple forms (Isoenzymes). The appearance of indicator enzymes or their individual isoforms in the blood, associated with impaired permeability of tissue cell membranes, can be utilized in biochemical monitoring of an athlete's functional state.
In sports practice, the presence in the blood of such tissue ENZYMES OF BIOLOGICAL oxidation processes as aldolase (a glycolysis enzyme) and catalase (an enzyme that reduces hydrogen peroxides) is frequently determined. Their appearance in the blood following physical exertion serves as an indicator of inadequate exercise load and the onset of fatigue, while the rate of their disappearance reflects the rate of body recovery.
Following physical exertion, specific tissue-specific isoforms of enzymes—such as creatine kinase and lactate dehydrogenase—may appear in the blood. For instance, after prolonged exercise, a skeletal muscle-specific isoform of creatine kinase appears in the blood of athletes; in acute myocardial infarction, a cardiac muscle-specific isoform of creatine kinase appears. If physical exertion causes a significant release of enzymes from tissues into the blood and they persist there for a long time during the rest period, this indicates a low level of training in the athlete and potentially a pre-pathological state of the body.
Hormones. In the biochemical diagnostics of an athlete's functional state, hormone levels in the blood are highly informative indicators. More than 20 different hormones regulating Various metabolic pathways can be measured. The concentration of hormones in the blood is quite low, typically ranging from 10-8 to 10-1 mol ⋅ L-1, which complicates the widespread use of these indicators in sports diagnostics. The main hormones used to assess an athlete's functional state, along with their normal blood concentrations and directional changes during standard physical exertion, are presented in Table 51.
The magnitude of changes in blood hormone levels depends on the intensity and duration of the exercise performed, as well as the athlete's level of training. At the same workload intensity, highly trained athletes exhibit less significant changes in these blood parameters (Fig. 217). Furthermore, changes in blood hormone content can be used to assess the body's adaptation to physical exertion, the intensity of the metabolic processes they regulate, the development of fatigue, and The Use of anabolic Steroids and Other Hormones.
Vitamins. The DETECTION OF VITAMINS in urine is part of the diagnostic profile characterizing the health status and physical performance of athletes. In sports practice, the body's supply of Water-Soluble Vitamins, particularly Vitamin C, is most frequently assessed. Vitamins appear in the urine when the body is sufficiently supplied with them. Data from numerous studies indicate an inadequate vitamin status in many athletes; therefore, monitoring their levels in the body allows for timely dietary adjustments or the prescription of additional vitamin supplementation through special multivitamin complexes.
TABLE 51 Directional changes in blood hormone concentrations during physical exertion
Hormone |
Blood concentration, ng ⋅ L-1 |
Direction of concentration change during physical exertion |
Adrenaline |
0—0,07 |
↑ |
1—1,5 |
↓ |
|
70-80 |
↑ |
|
Somatotropin |
1-6 |
↑ |
ACTH |
10-200 |
↑ |
Cortisol |
50-100 |
↑ |
Testosterone |
3—12 (men) 0,1—0,3 (women) |
↑ |
Estradiol |
70-200 |
↓ |
Thyroxine |
50—140 |
↓ |
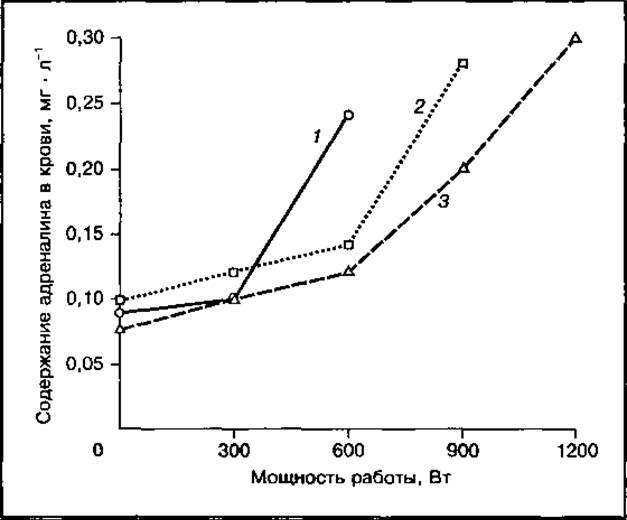
Fig. 217 Direction of changes in blood adrenaline content depending on work intensity and the athlete's training level:
1 — non-athletes; 2 — ranked athletes; 3 — masters of sports
Inorganic phosphate is formed in muscles as phosphoric acid (H3PO4) during transphosphorylation reactions in the creatine kinase ATP synthesis mechanism and other processes. Changes in its blood concentration can be used to gauge the capacity of the creatine kinase energy supply mechanism in athletes, as well as their training status, since the increase in blood inorganic phosphate in highly qualified athletes during anaerobic physical work is greater than that in less qualified athletes (Fig. 218).
Last update: 06/08/2026
Editorial and Educational Adaptation: This material has been compiled based on the primary/original source text. The project team performed an editorial review, corrected technical inaccuracies, structured sections, and adapted the content for an educational format.
What was processed:
- elimination of formatting defects (OCR errors, structural breaks, corrupted characters);
- editorial organization of content;
- standardization of terminology in accordance with academic sources;
- verification of factual statements against the original source text.
All mentions of the author, publication year, and origin of the primary text have been preserved in accordance with the source.