Practical Protein Chemistry - A. Darbre 1989
Determination of the composition of protein oligomers. Preparation of monomers and polypeptide chains
Identification of monomers
Methods for isolation of monomers
Isolation and Purification of monomers for Amino Acid Composition analysis, peptide mapping, or sequencing are performed using preparative Protein Chemistry Methods.
When working with micro-amounts of material, a radioactive label is introduced into the protein, followed by Analytical Methods. The label can be internal (i.e., introduced in vivo) [14, 161] or attached chemically via amino acid functional groups (as described in Section 1.4.5.1).
1.3.2.1. Size-based subunit Separation. If subunits differ significantly in molecular weight, they are isolated by Gel filtration in the presence of Denaturing Agents. The principles and methodology of analytical-scale gel filtration are discussed in Section 1.3.1.3; they remain essentially unchanged for preparative fractionation. Chromatography is typically performed on preparative columns 2.5:5 cm in diameter and 100 cm in length, designed for loads ranging from 500 mg to several grams of protein.
Volatile buffer systems, particularly dilute ammonia solutions, acetic acid, and formic acid, are used for separation, enabling Proteins to be recovered from eluates via lyophilization. Samples for Amino acid analysis are recommended to be prepared by gel filtration in 50–75% formic acid. Formic acid, a strong denaturing and solubilizing agent, causes degradation of polysaccharide-matrix Supports; specifically, Sephadex should not be kept in contact with 75% formic acid for more than three weeks.
Columns are made of Glass, and connecting tubing is made of Teflon (Fig. 1.3). Proteins are isolated from the eluate by lyophilization in a Vacuum system equipped with traps, after which the fractions are pre-diluted to a formic acid concentration of ~10%. It is generally accepted that formic acid does not hydrolyze peptide bonds, with the exception of the labile Asp-Pro bond.
Class="center">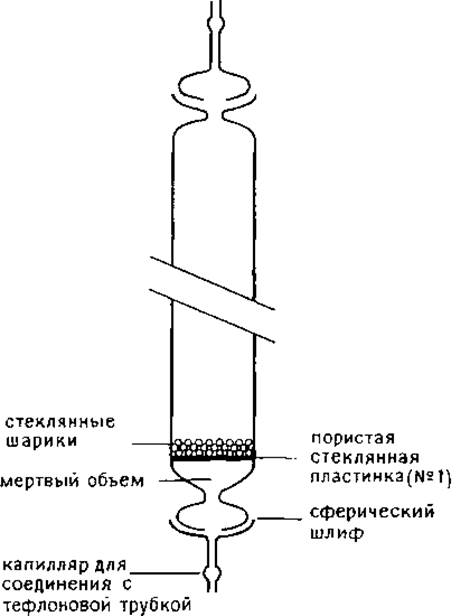
FIG. 1.3. Glass chromatography Column designed for chromatography using formic acid as the eluent.
When working with quantities of 2–3 mg and potentially up to 100 mg, HPLC offers certain advantages over traditional gel filtration. In this case, the shortened analysis time easily compensates for the small capacity of the columns. Undoubtedly, due to technological advancements, high-capacity columns will become available in the near future, although it is safe to assume they will carry a high cost. Monomers can also be separated using preparative SDS-Polyacrylamide gel Electrophoresis (SDS-PAGE). In terms of throughput, this method is inferior to gel filtration, with a load limit of 50 mg of protein; however, electrophoresis allows the separation of subunits with approximately equal molecular weights [168]. In practice, two main variants of electrophoresis are predominantly used. The first variant is a Modification of the analytical method. For instance, the thickness of the gel slab can be increased, or, by omitting the comb, the sample can be applied as a continuous band. Following electrophoresis, protein zones are visualized using one of the following Procedures:
1. The gel is stained for a shorter duration or with a more dilute dye solution (0.05% Coomassie solution) than is standard in the routine protocol (Section 1.2.1.1).
2. Control gel strips are stained (when comparing with the original gel, plate shrinkage during destaining in a methanol–acetic acid mixture must be taken into account).
3. The gel is soaked in 1 M KCl, after which protein zones are detected by opalescence caused by The formation of insoluble potassium dodecyl sulfate [180].
4. The gel is soaked in 4 M sodium acetate, revealing protein zones as transparent bands (detection limit 0.1 ng/mm3) [76].
Zones of interest are excised, and the protein is recovered by extraction [49, 64] or electrophoretic elution [2, 175]. When determining The amino acid composition of samples prepared in this manner, appropriate corrections accounting for the presence of the acrylamide gel must be applied [26]. Alternatively, proteins are separated by electrophoresis in an acrylamide gel block, where an electric field drives the protein fractions into a flow-through chamber from which they are continuously washed out by an eluent stream. The elution process is monitored using a flow-through densitometer, and the eluate is collected with a fraction collector. Recently, a technique has been developed for eluting proteins from an SDS-PAGE system into an intermediate gel using upward electrophoresis [121]. While yields are high, the sample may contain traces of acrylamide gel components and buffer system impurities. Gels for Preparative Electrophoresis can be in the form of columns (LKB) or slabs/blocks (Biorad). Various commercially available instruments are used for separations According to the described methodology.
1.3.2.2. Ion-exchange chromatography. Ion-exchange chromatography, electrophoresis (Section 1.3.2.3), isoelectric focusing, and chromatofocusing (Section 1.3.2.4) are used to separate proteins into subunits based on their net charge.
In ion-exchange chromatography, the sample is applied to a column packed with an ion exchanger (sorbent) bearing positively charged (anion exchanger) or negatively charged (cation exchanger) ionizable groups. On a positively charged sorbent, mixture components that also carry a positive charge (provided the buffer pH does not exceed the pK) pass freely with the eluent flow, whereas negatively charged components are retained. Weakly sorbed substances are eluted with the starting buffer, while strongly sorbed ones are "stripped" from the column by passing a solution of higher Ionic strength or a different pH. As a result, the mixture components are eluted in order of increasing net charge.
Ionizable groups are immobilized on various inert supports, the most common being granular Cellulose (Whatman, Serva, Bio-Rad, Eastman) and spherical cellulose (Pharmacia). Cross-linked agarose and dextran are also used as supports. Dextran-based ion exchangers exhibit high capacity and are successfully employed for separating moderately sized Biomolecules. The main drawback of this ion exchanger type is the strong dependence of bead volume on the ionic strength and pH of the buffer solution. The cation exchanger TSK-Gel LS-212 was successfully used for the HPLC separation of soybean lipoxygenase-1 isoforms [9]. Recently, Pharmacia introduced a wide-pore ion exchanger for HPLC that enables high-speed, high-resolution separations (Chapter 6).
Most anion exchangers incorporate diethylaminoethyl (DEAE) or diethyl(2-hydroxypropyl)aminoethyl (DHPAE) groups as ionizable functional groups. In cation exchangers, the ionizable groups are carboxymethyl (CM), phosphate (P), and sulfopropyl (SP) groups. Strong ion exchangers (containing DHPAE, P, and SP groups) are recommended for fractionating substances with weakly acidic or weakly basic properties, or for separations under extreme pH conditions. The efficiency of protein separation on ion exchangers depends on more than just the net charge. For instance, proteins with a high content of aromatic Amino Acids were fractionated on DEAE-cellulose at pH 0.5 based on their hydrophobic properties [65].
The choice of ion exchanger depends on The properties of the target proteins. Chromatography is typically performed in a buffer where the target Components of the mixture exhibit the maximum difference in net charge. When selecting the operating pH range, one can be guided by the results of electrophoresis or isoelectric focusing (i.e., the isoelectric points of the mixture components) (Section 1.3.2.4). If the net charge is negative, chromatography is performed on an anion exchanger; if positive, on a cation exchanger. The Selection of optimal conditions for ion-exchange separation should be preceded by a preliminary Assessment of the mixture's properties using simple tests.
Selection of the ion exchanger. Aliquots of the protein solution are mixed with a cation exchanger and an anion exchanger equilibrated with a buffer at a specific pH. The degree of protein binding to the sorbent is determined by measuring the optical density of the liquid above the ion exchanger, thereby identifying the ion type and pH value at which sorption of the target protein reaches a maximum. In practice, 0.05 g of each ion exchanger (e.g., DEAE- and CM-cellulose) and 30 ml of the corresponding buffer solution (0.05 M Tris-HCl, pH 8.5 for the anion exchanger; 0.05 M sodium acetate, pH 5.0 for the cation exchanger) containing 8 M urea (required for oligomer dissociation) are placed into test tubes. The ion exchangers are equilibrated with the buffer solution by replacing the supernatant with fresh buffer twice or more, and most of the liquid above the ion exchanger is removed (so that the total volume of ion exchanger with buffer above it is 10 ml). An equal amount of protein is added to each tube, mixed by vortexing, and the liquid is separated after the ion exchanger settles. The optical density of the supernatant is measured spectrophotometrically. Some proteins are sorbed onto both cation and anion exchangers, in which case both ion exchangers are suitable as chromatographic sorbents. However, if the protein does not sorb onto DEAE- and CM-cellulose, it is necessary to decrease the buffer concentration or use stronger ion exchangers.
Procedure for ion-exchange chromatography. Comprehensive information regarding the properties and physical characteristics of various ion exchangers, as well as practical recommendations for working with them, can be found in manufacturer technical bulletins. A good Overview of cellulosic ion exchangers has been published by Peterson [133].
Dry ion exchangers are first subjected to acid and alkali Treatment before being equilibrated with the working buffer. Anion exchangers, such as DEAE-cellulose, are suspended in 0.5 M HCl (15 ml/g) and stirred for 30 min. The liquid is removed by filtration, and the ion exchanger is washed with Water and suspended with stirring in an equal volume of 0.5 M NaOH for 30 min. The liquid is removed again, and the ion exchanger is washed with water. Next, the ion exchanger is suspended in the working buffer (20 ml/g), stirred for 10 min, and recovered by decantation and filtration. This operation is repeated three times until the pH and electrical conductivity of the liquid above the ion exchanger match those of the working buffer. Cation exchangers are treated similarly, but in a different sequence. For example, CM-cellulose is washed first with 0.5 M NaOH and then with 0.5 M HCl. Ion exchangers supplied in a pre-swollen (wet) state do not require preliminary conditioning and are equilibrated with the working buffer according to standard procedures.
Next, fine particles of the ion exchanger are removed. The suspension is mixed thoroughly in a graduated cylinder, allowed to settle for 1 h, and the supernatant is discarded.
A suspension that allows air bubbles to pass freely is prepared, degassed in a water-aspirator vacuum, and used to pack the column. For preparative purposes, columns 1.5:2.5 cm in diameter and 50:100 cm in length are used; prior to packing, the column is fitted with a reservoir that allows the entire mass of the ion exchanger to be loaded in a single step. After packing, 1–2 column volumes of the working buffer are passed through the ion exchanger bed. The flow rate during washing should match the intended elution rate, and the sorbent bed volume must remain constant.
The sample is dissolved in the starting buffer and, if necessary, dialyzed for 12 h. If the target components of the mixture are sorbed quite strongly, the volume of the sample solution is of little consequence. In the case of weak sorption, the volume of the sample applied to the column should not exceed 1–2% of the column volume. The sample load should be <10% of the sorbent capacity.
The course of elution is monitored by measuring changes in optical density at 280 nm (or using the methods described in Section 1.2.2.1), and the eluate is collected in fractions. Mixture components retained by the ion exchanger are eluted by stepwise or continuous gradients of ionic strength or pH of the working buffer. Stepwise gradient elution tends to cause artifacts and is therefore used less frequently.
Methods of gradient formation. Concentration gradients or pH gradients are formed using two communicating vessels or a peristaltic pump. Special gradient makers are also commercially available.
A system of two communicating vessels with vertical walls is shown in Fig. 1.4, a. Let us designate the cross-sectional areas of mixer 1 and reservoir 2 as A1 and A2, and the initial and final buffer concentrations as C1 and C2. If both Buffer solutions have the same density, The change in eluent concentration can be described as follows:
С = С2 — (С2 — С1) (1 — v/V)A2/A1
where V is the volume of eluent delivered by the system to the column, and V is the total volume of the mixer and reservoir. When A1=A2, a linear gradient is formed; if A1<A2, the gradient is convex; if A1>A2, the gradient is concave [22].
To generate gradients, a multichannel peristaltic pump can be used (Fig. 1.4, b). The gradient profile is determined by the flow rates R1 (from vessel 2 to vessel 1) and R2 (from vessel 1 to the column), the concentrations C1 and C2, and the volume V1 of vessel 1. After time t, the concentration of the buffer applied to the column can be calculated using the formula [96]:

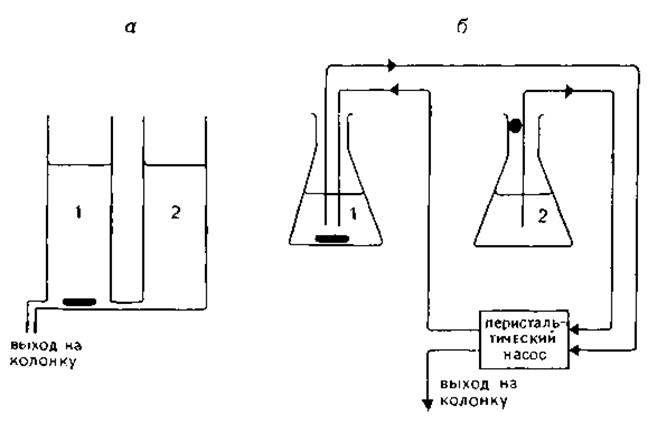
FIG. 1.4. Methods for gradient formation using communicating vessels (a) and a peristaltic pump (b). 1 — mixer; 2 — reservoir. The gradient profile is determined by the cross-sectional area of the vessels (a) or the inner diameter of the peristaltic pump tubing (b).
If R2 = 2R1, a linear gradient is formed, the slope of which is determined by the formula:
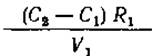
When R2>2R1, a convex gradient is formed, and when R2<2R1, a concave gradient is formed. If R1<R2, The ratio of the mixer volume V1 to the total eluent volume V must satisfy the following condition:

In most peristaltic pumps, the flow rates R1 and R2 can be varied by changing the tubing diameter. Pumps that allow flow rates to be varied over a wide range are commercially available. If the tubing diameter can only be varied within a limited range, a linear gradient is formed using three channels of identical diameter. Buffer is pumped from vessel 2 into vessel 1 through one channel, and from vessel 1 into the column through the other two channels.
1.3.2.3. Polyacrylamide gel electrophoresis. Analytical electrophoresis in the presence of 8 M urea is used to identify monomers with different charge-to-mass ratios, as well as to determine the appropriate buffer type and pH for monomer isolation by ion-exchange chromatography. Preparative scale-up utilizes conditions identical to the analytical system or employs electrophoretic elution (see Section 1.3.2.1).
The optimization of PAGE conditions is detailed in [33]. A computer printout of 5,000 buffer systems for the electrophoretic separation of cations and anions in the pH range of 2.5–11 is available [35]. In practice, only a few of these systems with the most typical pH values are used [119]. Below is described the system proposed by Davis [43], slightly modified by The addition of 8 M urea.
The task often arises to determine the molecular weights of proteins that have been successfully separated electrophoretically based on their charge. In this case, tube electrophoresis is performed in the presence of 8 M urea, followed by second-dimension slab electrophoresis in the presence of SDS (two-dimensional gel electrophoresis is discussed in Section 7.3.2).
Electrophoresis at pH 8.9 in the presence of 8 M urea. Experimental procedures, equipment, Reagents, stains, and photographic documentation methods are described in Sections 1.2.1.1 and 1.3.1.1. Below we focus on the modified Davis system [43].
Resolving gel buffer: 3 M Tris, titrated with HCl to pH 8.9.
Stacking gel buffer: 0.5 M Tris, titrated with phosphoric acid to pH 6.8.
Sample buffer: 2 ml of stacking gel buffer, 6 g of urea, 5 ml of water, 5 mg of bromophenol blue.
Electrode buffer: 0.005 M Tris + 0.04 M Glycine.
Stock solution: 29.2% (w/v) acrylamide, 0.8% (w/v) N,N'-methylenebisacrylamide.
Proportions of components for preparing 10 ml of resolving polyacrylamide gel of various concentrations
|
7.5% |
10% |
12.5% |
|
|
30% Acrylamide solution |
2.50 ml |
3.33 ml |
4.17 ml |
|
Resolving gel buffer |
1.25 ml |
1.25 ml |
1.25 ml |
|
Urea |
4.8 g |
4.8 g |
4.8 g |
|
Water |
2.65 ml |
1.82 ml |
0.98 ml |
|
TEMED |
5 µl |
5 µl |
5 µl |
|
Ammonium persulfate |
5 mg |
5 mg |
5 mg |
After adding ammonium persulfate to the mixture, the solution is degassed under water-aspirator vacuum and transferred to the electrophoresis chamber (protected from atmospheric oxygen with a layer of water or water-saturated isobutanol). Upon polymerization, the protective layer is removed, the surface is washed with stacking gel solution, and the freshly degassed stacking gel solution is applied. To prepare 10 ml of stacking gel, mix 1.3 ml of stock solution, 1.25 ml of stacking gel buffer, 4.8 g of urea, 3.8 ml of water, 5 µl of TEMED, and 5 mg of ammonium persulfate.
Samples are applied using a microsyringe or micropipette. Electrophoresis is carried out at 100 V until the dye front passes through the stacking gel, and then at 200 V until the dye front approaches the bottom of the gel.
Two-dimensional electrophoresis. Electrophoresis in the first dimension is performed at pH 8.9 (or another appropriate pH) in the presence of 8 M urea, followed by the second dimension in the presence of SDS. To sharpen the zones at the gel boundary, the second-dimension electrophoresis is carried out in a discontinuous buffer system. The tube gel is placed on top of the stacking gel at the edge of the slab and secured with agarose (SDS concentration in the sample buffer 1% (w/v), see section 1.3.1) [115]. Alternatively, second-dimension electrophoresis can be performed in a continuous buffer system on a gradient gel, in which case zone sharpening will occur near the steady-state position. In this case, the tube gel (3.5 mm diameter) is equilibrated for 30 min with 100 ml of electrode buffer (0.025 M phosphate, pH 7 + 0.15% SDS) and placed on the upper edge of a ready-made (commercial) gradient gel slab (4–27%) (section 1.3.1.1), which has been pre-soaked with SDS by electrophoresis at 50 mA for 3 h. Separation is carried out at 30 mA for 15 min and 50 mA for 3.5 h [114].
1.3.2.4. Isoelectric focusing. In isoelectric focusing, a solution containing a mixture of carrier ampholytes (aliphatic polyaminopolycarboxylic acids) is subjected to an electric field. Under these conditions, the various components of the mixture migrate to the region where their net charge is zero; i.e., substances with lower isoelectric points move toward the anode. As a result, a pH gradient is formed between the electrodes. Carrier ampholytes are commercially available from several companies (LKB, Serva, Bio-Rad, Pharmacia, Pierce). When a protein is introduced into a system with a pH gradient formed by ampholytes, the sample migrates under the Influence of the field to the zone corresponding to its isoelectric point. Isoelectric focusing provides the most accurate Assessment of Protein heterogeneity with respect to charge. Identifying the cause of charge heterogeneity, evidenced by multiple zones, is not straightforward. Such heterogeneity may result from trace impurities of other proteins in the sample, chemical Modification of protein molecules due to deamidation, varying degrees of phosphorylation, or the reaction of cyanate with the N-terminal amino group or the ε-amino group of Lysine residues. Therefore, the protein must first be characterized electrophoretically before being studied by isoelectric focusing. It has been established that out of 500 proteins examined, 70% have isoelectric points in the acidic range, and 38% in the pH range of 4.5–6.0 [63].
Analytical isoelectric focusing in the presence of 8 M urea can be performed in conventional gels such as polyacrylamide or Sephadex. Preparative isoelectric focusing is carried out in columns using a density gradient (sucrose); however, in recent years, separation in a layer of Sephadex or another support has been preferred (experimental procedures are described in booklets from LKB and Pharmacia).
First, isoelectric focusing is performed over a broad pH range (e.g., 3–10), followed by a second run over a narrower range (pH 5–7). Carrier ampholytes are expensive; therefore, for economy, separation can be carried out initially in tubes, and preparative separation performed only after careful optimization of conditions.
Analytical isoelectric focusing. To prepare 10 ml of working buffer, mix 1.65 ml of stock solution (30% acrylamide), 4.8 g of urea, 3.75 ml of water, 1.0 ml of ampholyte solution, and 5 mg of ammonium persulfate. The COMPOSITION OF THE anode buffer is 0.03 M phosphoric acid + 8 M urea; the cathode buffer is 0.05 M NaOH + 8 M urea. The sample is dissolved in a buffer of the following composition: 1) 0.03 M phosphoric acid + 8 M urea + 20% glycerol (pH 4.0), or
2) 0.05 M Tris + 8 M urea + 20% glycerol (pH 8.0) (the first for the acidic and the second for the basic region of the gel). Perform pre-focusing at 400 V for 2 h, apply the samples, and carry out separation at 400 V for 17 h. Wash the gel with 10% trichloroacetic acid to remove ampholytes, and then proceed with detection (staining). Detection can be performed directly by soaking the gel for 3 h in a solution of the following composition: 25% ethanol + 10% acetic acid + 0.1% copper sulfate + 0.01% Coomassie Brilliant Blue R-250; destaining solution: 10% ethanol + 10% acetic acid [144].
The pH gradient is measured on the unstained gel using a contact electrode (type LoT 403-30, Ingold). Wire segments are inserted into the gels at 1 cm intervals, the pH is measured, and the gel is then stained and photographed [116]. Measurements are performed on at least three gels, and the average of the three determinations is calculated. The obtained isoelectric point values serve as a characteristic of the protein in an 8 M urea environment. This latter point is crucial, as the presence of urea affects the pK values of ionizable groups [28, 176].
The molecular weights of the mixture components can be determined using two-dimensional electrophoresis [128] according to the procedure described in section 1.3.2.3.
Preparative isoelectric focusing. The focusing apparatus must include an efficiently cooled horizontal plate, electrode vessels, and a power supply.
15 g of Ultrodex or Sephadex IEF (Sephadex G-75 after special treatment) is allowed to swell fully in 225 ml of an 8 M urea solution, 12 ml of ampholyte solution is added, and the mixture is stirred thoroughly. The suspension is then degassed and poured into a special tray (e.g., 200x200x5.0 mm in size) within a cooling unit, and leveled with a glass rod. Excess moisture is removed by natural evaporation or absorbed using dry Sephadex (an open jar of Sephadex is covered with gauze and secured with adhesive tape over The surface of the wet suspension). A gel layer prepared in this manner should not slump when the tray is tilted at 45°.
The sample is either applied directly to the gel surface (as a strip) or mixed with dry Sephadex (1 ml of sample solution in 8 M urea per 60 mg of Sephadex) and placed in a trough specifically cut into the gel layer. The sample can be applied at any position along the pH gradient, with a load of 1 mg of protein per 1 ml of gel suspension.
Contact between the gel layer and the electrode buffer is established using Whatman 3MM paper strips wrapped in cellophane or dialysis membrane. Depending on the distance between the electrodes and cooling efficiency, electrophoresis is conducted at 300 V for 16 h, and then at 600 V for 4 h. Protein zones are detected by the print technique; for this purpose, a sheet of Whatman 3MM paper is placed onto the gel layer and rolled with a roller. After two minutes, the paper sheet is peeled off, dried, washed twice (10 min each) with 10% trichloroacetic acid to remove ampholytes, washed (5 min) with destaining solution to remove trichloroacetic acid, stained with Coomassie Brilliant Blue G-250 (section 1.2.1.1) for 10 min, and destained.
Zones containing the proteins of interest are excised, transferred to a small column (e.g., a small syringe plugged with a piece of glass wool), and suspended in buffer. Ampholytes are removed by dialysis or gel filtration on Sephadex G-10.
Occasionally, ampholyte impurities are difficult to remove and interfere with biological assays. In such cases, the Buffalyte system supplied by Pierce should be tried [139]. The procedure is discussed in more detail in several publications [140, 141] and in manufacturer brochures.
1.3.2.5. Fractional precipitation. Neutral salts exert a specific and profound effect on the conformational stability of proteins [179], with cations and anions typically influencing the unfolding of native structures differently. While Protein solubility increases in the presence of low salt concentrations (the so-called salting-in effect), high concentrations (usually several moles) lead to The phenomenon of salting-out, which causes protein precipitation. The relative effectiveness of neutral salts in the salting-out reaction was first studied in 1888 [79]. Lyotropic series of cations and anions have been proposed:

The physicochemical basis of protein salting-out in concentrated salt solutions is quite complex [163]. One of the causes of salting-out is linked to a decrease in The activity of water molecules associated with the protein, resulting from their weaker interaction with polar protein groups. Another crucial factor determining protein solubility is the surface tension at the interface between protein molecules and the protein-water boundary, with the lyotropic effect explained by METABOLISM/18.html">The Influence of extraneous ions On the surface tension value [27]. The solubility $S$ of many proteins (at high salt concentrations) decreases logarithmically with increasing salt concentration:
lgS = ß — Ksw
where ß is the protein solubility in water (usually determined by extrapolation to w = 0), Ks is the salting-out constant, and w is the ionic strength. The curves shown in Fig. 1.5 illustrate the change in solubility of various proteins in ammonium sulfate solutions [36]. As a rule, the most complete protein precipitation is observed near its isoelectric point, although this does not always hold true.
Ammonium sulfate precipitation is frequently used as a preliminary Protein Purification step, for instance, for concentration or separation from concomitant impurities. Sometimes this approach can be useful for separating subunits, particularly if they differ in solubility in ammonium sulfate (or other salt solutions).

FIG. 1.5. Change in protein solubility in ammonium sulfate solutions: 1 — fibrinogen; 2 — Hemoglobin; 3 — serum albumin; 4 — Myoglobin [36].
However, even in favorable cases, precipitation must be repeated to minimize the potential co-precipitation of other subunits. Ammonium sulfate has clear advantages over other neutral salts: it has a high salting-out capacity, does not denature proteins, is inexpensive and available in a sufficiently pure form, is highly soluble in water, and releases little heat upon dissolution. In addition, concentrated ammonium sulfate solutions have low viscosity and density, which is important since ultracentrifugation is typically the next step.
In practice, achieving optimal results requires trial and error. First, a calibration curve is constructed for a specific range of ammonium sulfate concentrations, taking into account that ammonium sulfate slightly lowers the pH of unbuffered solutions. The "percent saturation" value (100% saturation corresponds to a 4.05 M solution at 20°C), which characterizes The behavior of a particular protein, varies greatly depending on protein properties, concentration, pH (usually pH 5.5–7.5), and solution Temperature (usually 20°C). When preparing ammonium sulfate solutions, one can use the nomogram given in [48]. The nomogram makes it easy to determine The amount of salt that must be added to a specific volume of solution to achieve the desired degree of saturation. At pH < 5, protein precipitation can be carried out at lower salt concentrations (such solutions have lower density, which improves phase separation conditions during centrifugation).
Separation using organic Solvents. Proteins can be fractionated by precipitation with organic solvents such as ethanol or acetone. Aggregation-prone proteins are precipitated with ammonium sulfate in the presence of propanol [51]. Organic solvents decrease protein solubility by altering the Dielectric Constant of the medium. Because precipitation is driven by the aggregation of molecules resulting from Electrostatic Interactions—similar to precipitation at the isoelectric point—pH is a more critical factor here than in salt precipitation. Consequently, organic solvents make it possible to separate structurally very similar proteins that have different isoelectric points. For example, at pH 6.5, parvalbumins II, III, and IV were separated by acetone precipitation [163]. Protein IV precipitated at an acetone concentration of 55–60%, proteins III and IV at 60–65%, proteins III and II at 65–70%, and the most acidic components of the mixture, with isoelectric points around pI ∼ 4, precipitated at an acetone concentration of 70–80%.
As a rule, the lower the Molecular Weight of a protein, the higher the concentration of the organic solvent required for its precipitation. If the solvent concentration is too high, precipitation can be hindered by Protein-Structure/156.html">Protein Interactions. In this case, zwitterionic substances, such as glycine, are added to the solution to act as a buffer and stabilize the dielectric constant. If the protein denatures at room temperature, precipitation is carried out at a reduced temperature (at 0 °C). Adding an organic solvent to a protein solution initially causes a gradual temperature increase (until a 20% (v/v) concentration is reached), sometimes accompanied by a decrease in volume. It is important to maintain a constant temperature of the solution during precipitation, as the Solubility of proteins decreases sharply upon cooling.
In this regard, precipitation with organic solvents differs from salt fractionation, where the dependence of solubility on temperature is not as pronounced.
1.3.2.6. Other Separation Methods. Among these, Affinity Chromatography, which is discussed in Chapter 5, should be mentioned first.
Last update: 06/08/2026
Editorial and Educational Adaptation: This material has been compiled based on the primary/original source text. The project team performed an editorial review, corrected technical inaccuracies, structured sections, and adapted the content for an educational format.
What was processed:
- elimination of formatting defects (OCR errors, structural breaks, corrupted characters);
- editorial organization of content;
- standardization of terminology in accordance with academic sources;
- verification of factual statements against the original source text.
All mentions of the author, publication year, and origin of the primary text have been preserved in accordance with the source.