Practical Protein Chemistry - A. Darbre 1989
Determination of protein oligomer composition. Preparation of monomers and polypeptide chains
Methods for oligomer identification
Gel filtration
In gel filtration, protein Separation is based primarily on the size of the protein globule [6, 59]. This chapter focuses on open-Column Chromatography, although today, with the advent of advanced columns, instruments, and packing techniques, High-Performance Liquid Chromatography (HPLC; see Chapter 6) has become the preferred method. Nevertheless, the underlying principles of separation in open and closed columns are completely identical.
Gel filtration is carried out using columns packed with swollen gel beads containing pores of a defined diameter. The total volume of the gel bed is designated as Vt. This total volume can be calculated geometrically from the dimensions of the column or determined experimentally from the volume of Water required to fill it. During elution, large molecules that cannot enter the gel pores move rapidly through the void space between the beads, eluting as a narrow zone. The elution volume corresponding to The Emergence of this zone is designated as v0 (void volume). Smaller molecules migrate less rapidly because they diffuse into the gel beads, delaying their passage through the column. Since the extent of penetration into the gel matrix depends on molecular size, substances elute from the column in order of decreasing molecular weight. The molecular weight M of a target protein is determined by comparing its elution volume Ve with those of standard marker Proteins. Comprehensive reviews [1, 59] and Pharmacia product brochures [134] provide detailed information on this topic.
1.2.2.1. Procedures. To obtain satisfactory results, chromatographic columns of appropriate dimensions and design must be used. Such columns are commercially available from Pharmacia (Sweden). Analytical experiments are typically performed in columns with a diameter of ~15 mm, whereas preparative runs utilize columns of 25–50 mm in diameter. Column lengths generally range from 500 to 1000 mm, or even longer if the mechanical rigidity of the gel permits. In addition, a fraction collector, peristaltic pump, and continuous flow densitometer are required.
For any chromatographic experiment, a gel should be selected such that the elution zone of the protein of interest falls near the middle of the elution profile. Porous matrices are prepared from dextran, acrylamide, and/or agarose (with varying degrees of cross-linking), allowing the separation of substances across a broad range of molecular weights. Agarose gels (Sepharose, Bio-Gel A) are used to fractionate large proteins with molecular weights up to several millions. Specialized Processing of agarose yields cross-linked Sepharose CL, which exhibits high mechanical strength and permits high flow rates. Proteins with molecular weights <1 000 000 are fractionated on Sephadex, Bio-Gel P, or Ultrogel (LKB). Decreasing the degree of cross-linking reduces gel rigidity and the maximum allowable flow rate, but increases the exclusion limit for molecular weight. A more robust gel (Sephacryl), which allows for 5- to 10-fold higher flow rates, is produced by cross-linking allyldextran with N,N'-methylenebisacrylamide [89, 123].
To achieve optimal results, it is recommended to follow established standard protocols [134]. Dry gel beads are allowed to swell (or are autoclaved) in the working buffer for three days. Gels supplied as pre-swollen Suspensions, such as Sephacryl, are washed with the operating buffer and prepared as a slurry in the same buffer. A small amount of buffer is first poured into the column, and the degassed gel slurry is then carefully transferred down the inner wall. A thin protective layer of rigid Sephadex G-25 can be placed over the porous support at the bottom of the column to prevent clogging by bead fragments when working with soft gels. If the volume of the slurry exceeds the column volume Vt, a flow adapter or extension reservoir is attached. During packing, the liquid (buffer) flow rate may be slightly higher than that used in subsequent fractionation; however, neither the flow rate nor the hydrostatic pressure should exceed the limits recommended by the manufacturer. Once the gel bed has settled, at least two bed volumes of the working buffer should be passed through the column. For long columns, upward flow elution is often recommended. To facilitate this, columns can be equipped with specialized flow adapters (Pharmacia, LKB, Wright).
Buffer systems with a pH around 6–8 and an Ionic strength >0.1 (e.g., 0.1 M Tris-HCl containing 0.1 M NaCl, pH 8.0) are typically employed. Depending on The properties of the protein being studied, buffer parameters may need adjustment, such as increasing ionic strength to prevent oligomer aggregation. However, in the case of Sepharose, separation efficiency can be sensitive to salt concentration and pH [104]. Chromatography on Sephacryl is best performed at an ionic strength >0.5 or at pH 5.5, as this gel exhibits weak ion-exchange properties [191].
A constant elution rate is maintained using a peristaltic pump. The eluate collected in the fraction collector is analyzed continuously or fraction-by-fraction for protein content, usually by monitoring changes in absorbance at 280 nm. Alternative detection Methods are used if the protein lacks typical chromophores (Tryptophan and Tyrosine residues), when working at a micro-scale, or when absorbance at 280 nm is excessively high due to the presence of a cofactor. In such cases, absorbance can be measured at 220 nm, or fluorescence intensity and radioactivity (for radiolabeled proteins) can be utilized [14, 161]. Finally, chemical modification methods can be applied to analyze protein fractions (Section 1.4.5.1). For example, specific aliquots of individual fractions can be subjected to alkaline Hydrolysis followed by a ninhydrin reaction. Alternatively, Proteins can be detected using the Lowry assay or dye-binding assays. The latter method is particularly recommended as it is simple, highly sensitive, and unaffected by the presence of various chemical Reagents. In addition, fraction composition can be assessed using Polyacrylamide gel Electrophoresis.
The void volume V0 is usually determined using Blue Dextran 2000 (Pharmacia), tobacco mosaic virus suspensions, ferritin, or other high-molecular-weight markers that are completely excluded from the gel pores. Theoretically, V0 accounts for approximately 35% of the total bed volume Vt. Obtaining a sharp, symmetrical band of Blue Dextran serves as a key indicator of proper Column packing quality. The marker solution is prepared by dissolving Blue Dextran (1 mg/mL) or a reference protein (5–20 mg/mL) in a buffer containing 10% (w/v) sucrose to ensure the sample density exceeds that of the elution buffer. The sample is then carefully applied to the column using a syringe or a sample injection valve. To minimize the nonspecific sorption of Blue Dextran on Sephadex and Sepharose, the working buffer should be maintained at pH >5, or pH ≥7 for Sephacryl. The sample volume should not exceed 1–2% of the total gel volume Vt. Upon completion of the run, the elution volume Ve of the target protein is determined from the peak maximum of the absorbance-versus-elution-volume profile. If the recommended sample volume is exceeded, the elution peak may exhibit a plateau, making it difficult to determine the true Ve. The elution volume Ve can also be calculated from the flow rate, which is either measured directly in real-time or determined indirectly by measuring the volume of eluate collected over a set time interval. Since Ve is directly proportional to elution time, the retention time of the protein can equally serve as the basis for calculations.
1.2.2.2. Analysis of Results. When determining molecular weights by gel filtration, a calibration curve must first be established for the specific chromatographic column being used. The elution volume, or a related parameter, is plotted on the abscissa against the logarithm of the Molecular Weight of standard proteins on the ordinate. Pharmacia marker protein kits typically include Ribonuclease A (M 13 700), chymotrypsinogen A (M 25 000), Ovalbumin (M 43 000), bovine serum albumin (M 67 000), aldolase (M 158 000), catalase (M 232 000), ferritin (M 440 000), and thyroglobulin (M 669 000). While the elution volume Ve is frequently used in calculations, the distribution coefficient Kav between the liquid phase and the gel phase is much more convenient because this parameter is independent of column dimensions:
Class="center">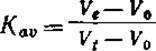
Figure 1.2 shows a typical calibration curve plotted in coordinates of log M versus Kav for Sephadex G-200. Another convenient representation is a linear plot of log(100∙Kav) versus N2/3 (where N is the number of amino acid residues in the marker proteins). When calibrating the column, it is advisable to use marker proteins that provide good resolution and allow Kav to be determined with high precision.
The parameters for most Globular proteins fit well onto the calibration curve. Deviations may occur if an oligomeric protein tends to aggregate or dissociate into monomers, or if the protein departs significantly from a globular conformation [12]. Proteins must not adsorb to the gel matrix, as this gives rise to spurious peaks that can be mistaken for low-molecular-weight contaminants. It is well known that proteins with a high content of aromatic Amino Acids or oligosaccharide chains can exhibit non-specific adsorption on Sephadex. Protein losses on the column due to precipitation or adsorption can be estimated by comparing the total protein content (based on absorbance at 280 nm) in the recovered eluate with that of the initial sample applied to the column.

FIG. 1.2. Calibration curve for Sephadex G-200 obtained using Pharmacia marker proteins (adapted from the manufacturer's manual).
Last update: 06/08/2026
Editorial and Educational Adaptation: This material has been compiled based on the primary/original source text. The project team performed an editorial review, corrected technical inaccuracies, structured sections, and adapted the content for an educational format.
What was processed:
- elimination of formatting defects (OCR errors, structural breaks, corrupted characters);
- editorial organization of content;
- standardization of terminology in accordance with academic sources;
- verification of factual statements against the original source text.
All mentions of the author, publication year, and origin of the primary text have been preserved in accordance with the source.