Practical Protein Chemistry - A. Darbre 1989
Determination of the composition of protein oligomers. Preparation of monomers and polypeptide chains
Methods for identification of oligomers
PAAG gradient electrophoresis
The Molecular Weight of an intact oligomer is determined under non-denaturing conditions using ultracentrifugation, Gel filtration, and Polyacrylamide gel Electrophoresis (PAGE) in a gradient. The stability and solubility of most Oligomeric Proteins depend on the Ionic strength and pH of the buffer solution. Unlike PAGE, which imposes certain restrictions on the composition of Buffer solutions—specifically, that the ionic strength must not exceed 0.1—gel filtration can be performed in buffers that stabilize the oligomer (for example, in the presence of Metal Ions or Cofactors). The molecular weight of proteins is typically determined using classical gel filtration on cross-linked dextrans, polyacrylamide, or agarose. Recently, new types of gels have been developed that allow the process to be carried out under elevated pressure, thereby reducing analysis time from 1–2 days to 30 minutes (Chapter 6).
The Essence of the method is that, under METABOLISM/18.html">The Influence of an electric field, protein zones migrate through a polyacrylamide gel with decreasing pore sizes until they reach a final position determined by the resistance of the medium. Thus, the distance traveled by a protein zone correlates with its molecular weight, which can be determined by comparison with The behavior of marker proteins.
Although proteins with a low net charge exhibit low electrophoretic mobility, the final position of the zones is virtually independent of the charge magnitude, provided that all studied proteins carry a charge of the same sign and the buffer pH differs significantly from their isoelectric points.
1.2.1.1. Description of the Method. Numerous apparatus designs for electrophoresis in vertical or horizontal polyacrylamide gel plates (slabs) are documented [24, 73, 142, 170]. The power supply must provide voltage and current stabilization; The Use of a thermostat with such units is optional.
Polyacrylamide gels, which have completely replaced starch formerly used for this purpose, serve as the primary porous medium. Gels of varying porosity (gradient gels) are prepared by adjusting the ratio and concentration of monomers: acrylamide CH2=CHCONH2 and the bifunctional cross-linking agent N,N'-methylenebisacrylamide CH2=CHCONHCH2NHCOCH = CH2 (Section 1.3.1.1). It should be kept in mind that acrylamide is a neurotoxic poison. Some researchers believe that optimal results can be achieved only by using monomers additionally purified by recrystallization [35]. However, quite satisfactory results are obtained using standard commercial Reagents. All Other reagents should be of analytical grade.
A linear concentration gradient is generated using two interconnected cylindrical vessels and a peristaltic pump, or by means of a gradient mixer of another, more complex design [113]. When lacking experience, preparing high-quality, reproducible gradient gels can be challenging; in such cases, pre-cast plates (from Gradipore, LKB, or Pharmacia) can be used.
Proteins with a molecular mass of 13,000–100,000 are fractionated in 4–30% gradient gels, whereas proteins with a molecular mass of 200,000–1,000,000 are analyzed using 4–16% gradient gels. The gel is first equilibrated with the working buffer solution by performing a preliminary electrophoresis run at 150 V for 1 h.
Performing Electrophoresis. To prepare the stock electrode buffer (Tris–EDTA–boric acid), dissolve 121 g of Tris, 15.6 g of EDTA (disodium salt), and 9.2 g of boric acid in distilled Water and bring the volume to 1 L. Before use, the stock solution is diluted with distilled water (1:10).
The protein sample is dissolved or dialyzed against a diluted electrode buffer containing bromophenol blue (0.1% w/v) and glycerol (10% w/v). Aliquots of 2–5 µL of the sample solution (at a concentration of 0.5 µg/µL) are applied to the wells using a micropipette or microsyringe. Electrophoresis is carried out at 150 V for 7–16 h. The gel is calibrated using protein markers [93]. Standard protein kits supplied by Pharmacia represent a lyophilized mixture of thyroglobulin (M 669,000), ferritin (M 440,000), catalase (M 232,000), Lactate dehydrogenase (M 140,000), and albumin (M 67,000).
Staining with Coomassie Brilliant Blue. Following electrophoresis, protein zones are localized by staining with Coomassie Brilliant Blue, designated in the literature as CBB G-250. For gel staining, a 0.15% (w/v) solution of CBB G-250 in a methanol–glacial acetic acid–water mixture (50:10:40) is used. To prepare the staining solution, the dye is first dissolved in methanol, then acetic acid and water are added, and the resulting solution is filtered. To destain the gel, the plate is immersed for 12 h in a methanol–glacial acetic acid–water mixture (5:7.5:87.5).
Gel Processing is carried out in a photographic tray covered with a lid to minimize methanol evaporation. The tray is agitated occasionally (approximately every hour). The staining solution (which can be reused up to 20 times) is poured into a Glass-stoppered bottle, and the destaining solution is added to the tray. If the destaining solution does not contain dye-absorbing Materials (such as a 100x100 mm piece of wool fabric, sponge rubber, or ion-exchange resin beads), the solution is replaced with fresh solvent 2–3 times over 24 h. Gels are stored in 10% acetic acid. Although electrophoretic destaining Procedures have been developed, such Methods can occasionally lead to the bleaching of protein bands.
Silver Staining. The most sensitive method for detecting protein zones involves soaking the gel in a silver nitrate solution, followed by Treatment with a reducing agent and a sodium carbonate solution. Under these conditions, polypeptide–silver complexes appear as dark bands. Silver staining can be performed after Coomassie staining, provided the dye has been previously washed out with a methanol–acetic acid mixture [138]. Reagent kits for silver staining are commercially available from Upjohn (GelCode) and Bio-Rad. Both kits increase the detection sensitivity compared to Coomassie staining by factors of 250 and 50, respectively. GelCode allows the detection of proteins at levels as low as 5–10 ng [154]. Both the hue and intensity of silver staining depend on The properties of the analyzed protein. This property can be exploited to monitor the purification of a target protein from a complex mixture (for details on detection methods in gels, see Section 8.19). Because the method is highly sensitive, glass plates must be cleaned very thoroughly (Section 8.2). If the gel does not make uniform contact with the glass (due to grease residues), sample leakage into the resulting gap may occur.
Class="center">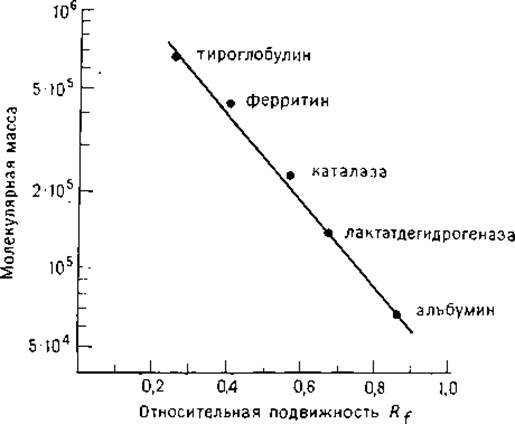
FIG. 1.1. Calibration curve for gradient (4–30%) PAGE constructed using thyroglobulin, ferritin, catalase, lactate dehydrogenase, and bovine serum albumin as marker proteins [101].
Photography of Electrophoretograms. After staining, the finished electrophoretograms are photographed on color or high-contrast black-and-white negative or positive film (Agfa Copek or Kodak Recordak). Photography is typically performed using a yellow filter No. 16; faint bands are shot with an orange filter No. 2, while intense bands can be photographed without a filter, with an exposure time of 1–6 s. The film is developed using an appropriate developer, such as Agfa Rodinal (diluted 1:25, 20°C, 3.5 min). The choice of photographic paper for printing depends on the quality of the electrophoretogram and the resulting negative.
1.2.1.2. Analysis of Results. When constructing the calibration curve, the migration distance (in millimeters) or the relative mobility Rf of the protein zones is plotted on the abscissa, and the molecular weight of the marker proteins is plotted on the ordinate (Fig. 1.1). The relative mobility Rf is measured relative to the migration front of the dye or marker protein. The molecular weight of the test protein is determined from the calibration curve using the experimental Rf values. To avoid errors caused by batch-to-batch variations in gel properties, it is recommended to run the test protein and the standard mixture on the same plate. The error in molecular weight determination from the calibration curve can reach up to 25% [98]. Larger deviations are observed if the oligomer dissociates into monomers during electrophoresis or if the protein lacks a globular Structure—such as fibrinogen, a fibrous protein that exhibits a significantly larger hydrodynamic volume compared to Globular proteins of the same molecular weight.
Last update: 06/08/2026
Editorial and Educational Adaptation: This material has been compiled based on the primary/original source text. The project team performed an editorial review, corrected technical inaccuracies, structured sections, and adapted the content for an educational format.
What was processed:
- elimination of formatting defects (OCR errors, structural breaks, corrupted characters);
- editorial organization of content;
- standardization of terminology in accordance with academic sources;
- verification of factual statements against the original source text.
All mentions of the author, publication year, and origin of the primary text have been preserved in accordance with the source.