Protein Chemistry - Part 1 - General Protein Chemistry - Ashmarin, I. P. 1968
Spatial Organization of the Protein Molecule
Tertiary Structure of Proteins. X-ray Diffraction Analysis of Proteins
From the available information on natural Proteins, it is evident that the structural forms (α- and β-structures) described in the previous sections cannot characterize all aspects of their molecular Organization. For most proteins, helical regions constitute only a part of their macromolecule and, in most cases, can account for only a minor fraction of its conformation. At the same time, protein macromolecules possess a clearly defined spatial configuration that is no less strictly determined than the configuration of highly helical systems. As we have already mentioned, this level of ORGANIZATION OF THE protein molecule, which encompasses the Introduction/11.html">Secondary Structure of polypeptide chains, is currently referred to as the tertiary structure. By way of explanation, let us recall that globular protein molecules are "super-coils" consisting of helical and amorphous segments. The latter impart sufficient flexibility to The polypeptide chains, allowing them to fold into a compact globule stabilized by various types of bonds. It is precisely this spatial packing of alternating helical and amorphous Regions of the primary chain into a compact and symmetrical body that constitutes the Tertiary Structure of a protein macromolecule.
The bonds stabilizing the tertiary structure of a protein molecule are of a highly diverse nature. These include disulfide cross-links, Van der Waals interactions of nonpolar amino acid radicals, Electrostatic Interactions of polar groups, Hydrogen Bonds, and several others. The mere enumeration of these bonds and interactions shows that the main role in stabilizing this level of macromolecular organization is played not by the peptide backbone, but by The amino acid side chains. All these types of secondary bonds were discussed in previous sections; here we shall focus exclusively on hydrogen bonds. Unlike the hydrogen bonds formed by imide hydrogen and carbonyl oxygen that stabilize the α-Helix, the preservation of the tertiary structure involves those H-bonds that are formed by side Tyrosine rings and the free carboxyl groups of glutamic and aspartic acids. The tyrosine hydroxyl group acts as a donor, and the carboxyl oxygen acts as an acceptor in The formation of this bond:
Class="center">
It has been spectroscopically proven that the Hydrogen bond is formed specifically with the carboxyl ion rather than with the uncharged carboxyl group. Upon transition from pH 1.5, when the COOH group is uncharged, to pH 5, a noticeable shift (by 6 mµ) of the protein absorption band at 280 mµ occurs, which is attributed to the formation of a hydrogen bond. Two such bonds were detected in the Insulin molecule and three in the Ribonuclease molecule. Bonds of this kind play an important role in preserving the tertiary structure of certain proteins. Thus, Treatment of ribonuclease with β-mercaptoethanol in 8 M urea (a hydrogen bond-disrupting agent) resulted in the Cleavage of S—S bridges and complete inactivation of the enzyme. However, after the removal of these agents and The oxidation of sulfhydryl groups by atmospheric oxygen, a complete restoration of activity and of the number of S—S bonds was observed. Evidently, the formation of these bonds occurred in the same locations as in the native protein. Conversely, if the oxidation of SH groups was also carried out in 8 M urea, the enzyme activity was not restored, although a complete recovery in the number of Disulfide Bonds was observed. Presumably, the reconstitution of these bonds proceeded in complete disorder, chaotically, and the protein remained denatured.
These experiments, conducted by Anfinsen, demonstrate that the tertiary structure of proteins can form and become fixed even in the absence of disulfide bridges, driven by the interaction of side radicals, the formation of hydrogen bonds of the described type, and the electrostatic interaction of polar groups. As for disulfide bonds, in this case they merely serve to anchor the tertiary structure. At the same time, these data indicate that the Primary Structure of a protein determines not only its secondary but also its tertiary structure. A specific arrangement of nonpolar radicals, tyrosine residues, and dicarboxylic acid residues in the polypeptide chain dictates the specific topological folding of the chain and the formation of hydrogen bonds in certain regions thereof, thereby enabling The Emergence of disulfide bonds in the order characteristic of the given protein.
Several authors suggest that hydrogen bonds may arise not only between the hydroxyl groups of tyrosine and the carboxyl groups of dicarboxylic Amino Acids, but also between the amino group of Histidine and the carboxyl group of the same acids. Finally, dipole-dipole interactions—such as those between the OH groups of two Serine residues—likely also play a role in stabilizing the tertiary structure. All these types of interactions are schematically represented in Fig. 25.

Fig. 25. Some possible types of side-chain interactions in Globular proteins (Steiner, 1965):
a — electrostatic, b — hydrogen bond, c — nonpolar radical interaction, d — dipole-dipole interaction.
Since side radicals play the primary role in the formation and stabilization of the tertiary structure, any generalization becomes impossible here, and each protein must be considered as a special case.
For a semi-quantitative characterization of the tertiary structure and its changes, one can use protein hydrodynamic constants—intrinsic viscosity [η], sedimentation constant S, and diffusion constant D—along with Flow Birefringence and several other parameters. However, precise knowledge of the tertiary structure can be achieved exclusively through X-Ray Diffraction Analysis. This method has been widely used to study the arrangement of atoms in crystals of simple inorganic and Organic compounds and can be applied only to crystalline material or material possessing a certain structural regularity. The ultimate goal of X-ray diffraction analysis is to determine the coordinates of all atoms. Knowledge of these coordinates makes it possible to construct a three-dimensional spatial model of the molecule in which all its constituent atoms are arranged in a definite order. A detailed Discussion of the principles of X-ray diffraction analysis is beyond The Scope of this book, and therefore only elementary theoretical prerequisites will be considered here.
X-rays, discovered in 1895 by Röntgen, are short-wave electromagnetic radiations produced when a metal target is bombarded with a beam of electrons. Such bombardment is carried out in a special device known as an "X-ray tube." While X-ray wavelengths range from 0.01 to 20 Å, crystallographic work utilizes rays whose wavelengths are commensurate with interatomic distances in a crystal, approximately 1.5 Å. Like ordinary light rays, X-rays exhibit properties of reflection, refraction, scattering, diffraction, Interference, etc.
As already mentioned, the method is suitable for studying systems that possess a certain regularity in their spatial geometry. Systems that have a fully ordered three-dimensional organization are called crystals. Any crystal is formed by the repetition of a small three-dimensional unit called the unit Cell, which consists of a single molecule or a small whole number of molecules. For example, the Myoglobin unit cell consists of two molecules. Since parallel repetition of the unit cell reproduces the entire crystal structure, describing this repeating unit is sufficient to characterize the latter. The task of X-ray diffraction analysis is precisely to determine the geometry and size of the unit cell and the relative positions of the atoms forming it. The second part of the task—determining the coordinates of the atoms and, consequently, The structure of the molecules—turns out to be incomparably more complex.
When studying the principles of X-ray diffraction analysis, it is permissible to view a crystal as being constructed from a series of parallel planes in which various atoms of the molecule lie. Each atom is part of a spatial lattice, and the entire set of atoms in a given layer forms a flat grid of the crystal lattice. Obviously, the number of such flat grids (parallel planes) can be very large, and for each system of planes, There is a characteristic Separation, i.e., the distance between parallel planes (Fig. 26). Consequently, a crystal can be regarded as a three-dimensional diffraction grating for X-rays. Upon reflection from a series of crystal planes, not only does the direction of the X-rays change (diffraction), but individual wave oscillations also superimpose upon one another (interference). This ability of X-rays to undergo diffraction and interference when reflected from the flat grids of the crystal lattice forms The basis of X-ray diffraction analysis of crystalline substances.
Let us consider the reflection of X-rays from one of the systems of crystal planes with a characteristic distance λ (Fig. 27). Let a beam of parallel rays of the same wavelength fall upon it at a certain angle θ. As a result of reflection from the parallel planes, these rays will merge at point C and produce a combined reflected ray L. In this process, ray L2 must travel a greater distance to point C because it lags behind ray L1 by the distance AC — BC. If this "lagging" section accommodates an integer number of wavelengths (AC — BC = n ∙ λ, where n is an integer), both rays will be in phase.

Fig. 26. Traces of various systems of parallel planes in a crystal lattice (from Neurath and Bailey, 1956).
Due to interference, they will reinforce each other and produce a "brighter" reflected ray. Such an intensified ray can be recorded on a photographic plate as a dark spot (reflection).
Conversely, if the AC — BC section does not accommodate an integer number of wavelengths, partial or complete attenuation occurs depending on the magnitude of the phase difference. In this case, the combined reflected ray will either be weakened or completely canceled out.
Reinforcement of the combined reflected ray is possible only if the angles of incidence of the X-rays on the crystal planes are such that the lagging section accommodates an integer number of wavelengths, i.e., the angles of incidence satisfy the Bragg condition:

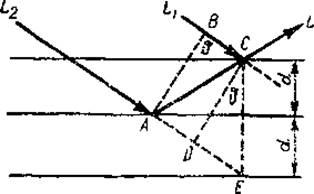
Fig. 27. Diagram of ray interference (from Nekrasov, 1954). Explanations in the text.
Consequently, there is a certain critical angle value ϑ at which mutual reinforcement of the diffracted X-rays must occur. Any deviation from the critical angle of incidence results in a significant attenuation of their intensity due to interference. In other words, every reflection on a diffraction photograph represents the fulfillment of the Bragg condition for a separate group of crystal planes. Knowing λ and the critical angle of incidence, one can always determine the interplanar spacing d.

Fig. 28. Diffraction in a single crystal (from Perutz and Bragg, 1956):
1 — filter transmitting monochromatic X-rays, 2 — collimating slits, 3 — photographic paper cylinder, 4 — protein crystal, 5 — spot on photographic paper (reflection).
This problem is approached in the following manner. A narrow beam of monochromatic X-rays is directed at a crystal positioned in such a way that it can rotate or oscillate around a crystallographic direction (axis) perpendicular to the path of the X-ray beam. When the angle of incidence reaches a certain critical value, the parallel rays are reflected from a series of equidistant planes, producing a spot On the surface of photographic paper or a photographic plate (Fig. 28). Obviously, the number of such spots will be large, since the number of different systems of parallel planes is also very large. In addition, a central spot caused by undeflected rays will appear in the center of the X-ray diffraction pattern.
An example of such an X-ray diffraction pattern is shown in Fig. 29. Even a casual glance at this pattern reveals a definite regularity. For instance, the upper and lower halves of the photograph are identical, as are the right and left halves. The reflections symmetrically surround the central spot and lie along a series of horizontal lines. The intensity of the spots on a given line varies in a regular manner. This leads to the Conclusion that the geometric arrangement of the spots on the X-ray pattern is related in a specific way to the geometric arrangement of atoms in the crystal lattice and to the orientation of the series of planes from which diffraction occurs. This relationship is governed by Bragg's law: the distance of each reflection from the center of the X-ray pattern is inversely proportional to the spacing between the corresponding planes in the crystal. Consequently, the geometry of the X-ray pattern allows one to calculate the characteristic distances for various systems of planes and thereby estimate the dimensions and geometry of the unit cell (the angles between its axes).
However, data on the dimensions and geometry of the unit cell are not yet sufficient to construct a three-dimensional model of the molecule, as they reveal nothing about the spatial coordinates of its constituent atoms. This problem can be solved by studying the intensities of the corresponding reflections. Just as the geometry of the unit cell determines the geometry of the X-ray pattern, the distribution of diffraction maximum intensities depends on the arrangement of atoms within the unit cell.
The reflection of X-rays from crystal planes is due to the scattering of these rays by the electrons of the atoms that populate a given plane. This scattering can be explained as follows: when X-rays strike matter, the electrons begin to oscillate, and each electron becomes a source of a scattered spherical wave. Consequently, the more electrons contained in the atoms populating a given plane, the greater the intensity of the radiation scattered by it. In other words, the intensity of a reflection is proportional to the electron density of a specific system of planes.
As already mentioned, any crystal represents a three-dimensional periodically repeating structure, meaning that matter within the crystal is distributed periodically along its three axes. From this it follows, first, that the electron density distribution along any axis of the crystal is a periodic function that can be expressed as a Fourier series consisting of individual components. Second, the complete X-ray diffraction pattern is a three-dimensional system of spots, any cross-section of which can be examined on the radiogram. Each spot on such a radiogram corresponds to an individual Fourier component, and the electron density distribution along the crystal axis is determined by the sum of all these components. Here, each component contributes to the sum with its own amplitude, period, and phase. Knowing the last three quantities, one can determine the electron density distribution along one of the crystal axes by simple summation. The period of a component can be found from the geometry of the radiogram, while its amplitude can be determined from the intensity of the spot, which is equal to the square of the amplitude. The most difficult task is to find the relative phase of a component, as there are no direct physical Methods for determining it.

Fig. 29. X-ray diffraction pattern of a sperm whale myoglobin crystal (after Kendrew, 1961).
To overcome this difficulty, the method of isomorphous replacement was developed. It consists in replacing an atom or a small group of atoms in a molecule with a heavy metal atom or group of atoms. Such a replacement does not alter the original crystal structure, but it significantly changes the diffraction pattern. By comparing the X-ray patterns before and after replacement, one can determine the phase relationships of the individual components, i.e., their displacement relative to each other. This method was first applied by Perutz in 1953 to study Hemoglobin and slightly later by Kendrew to study myoglobin.
The Essence of determining the phase relationships of individual components by this method was as follows. By introducing p-chloromercuribenzoate into the mother liquor used for hemoglobin crystallization, an isomorphous protein derivative was obtained in which two sulfhydryl groups per protein molecule reacted with the mercury compound. As a result, four heavy mercury atoms, which strongly scatter X-rays, were located at specific points within the crystal unit cell. By recording the diffraction spot pattern for the substituted protein and comparing it with the X-ray pattern of the unsubstituted protein, researchers obtained the diffraction pattern of a spatial lattice consisting essentially of mercury atoms positioned at the points where they were attached to the protein.
The "mercury" lattice contains only 4 mercury atoms in its unit cell, and therefore its complete X-ray structure analysis (determining the spatial locations of the mercury atoms) is relatively straightforward. Knowing the positions of the heavy groups and their weights, one can calculate their vector contribution (i.e., amplitude and phase) to the component corresponding to each diffraction maximum. On the other hand, for both the pure protein and the substituted protein, each component corresponds to vectors with determined amplitudes but unknown phases. Consequently, the investigator has three vectors at their disposal: for two of them, the amplitudes (i.e., magnitudes) are known, while for the third, both amplitude and phase (i.e., magnitude and direction) are known. By constructing a vector triangle formed by the two vectors of given length and the difference vector, the phase angles can be found geometrically.

Fig. 30. Two-dimensional Fourier PROJECTION OF THE myoglobin unit cell (after Kendrew, 1961).
The highest peaks, corresponding to the highest density of concentric lines, are due to the iron atoms of the heme group.
Knowing the period, amplitude, and phase of each component, one can determine the electron density distribution along the crystal axis and perform the so-called two-dimensional Fourier synthesis. Such a two-dimensional projection is depicted as a resulting electron density contour map and serves, so to speak, as a silhouette of the molecule on a plane—an inaccurate and highly complex silhouette (Fig. 30).
Since the thickness of the hemoglobin unit cell corresponds to the thickness of approximately 40 atoms, projection onto a plane causes the traces of all atoms to overlap, rendering them unresolvable. To determine the crystal structure, it is necessary to establish the electron density distribution along all three axes of the crystal (three-dimensional Fourier synthesis). To this end, electron density maps were first obtained for A large number of parallel planes of the unit cell. These maps were then superimposed upon one another in such a way as to yield a three-dimensional representation of the electron density contours. Based on such three-dimensional maps (Fig. 31), three-dimensional models of the myoglobin molecule at a 6 Å resolution (Kendrew) and the hemoglobin molecule at a 5.5 Å resolution (Perutz) were constructed.

Fig. 31. Three-dimensional Fourier synthesis for the myoglobin unit cell (after Kendrew, 1961).
Certain rod-like polypeptide chains are visible.
This resolution incorporates several atoms into an electron density peak and reflects the crystal structure only at THE MOLECULAR LEVEL. Fig. 32 shows a three-dimensional model of the myoglobin molecule; inside the molecule, a curved rod of high electron density is visible, representing a helical-type polypeptide chain. The rod is curved and coiled into a compact body—a globule; at the bends, the regularity of the helix is disrupted, and the protein polypeptide chain is in an amorphous state. The heme group with its iron atom is also clearly visible. A schematic diagram of this model is shown on the right; the disk represents the heme group.
However, using this model, one cannot yet say anything about the arrangement of individual amino acids within the polypeptide chain. It is only clear that this arrangement in linear regions exhibits axial Symmetry and consists of helices approximately 10 Å in diameter, which corresponds to the width of the Pauling-Corey $\alpha$-helix. The arrangement of amino acid residues was established when Kendrew et al. constructed a model at a 2 Å resolution (Fig. 33). This model demonstrated that the rod of high electron density represents a sequence of amino acid residues arranged in a helix. Certain residues and their locations were identified, as well as the locations of the side chains. Thus, the tertiary structure of myoglobin became known even before its primary structure was deciphered.

Fig. 32. Three-dimensional model of myoglobin and its schematic diagram, resolution up to 6 Å (Steiner, 1965).

Fig. 33. Model of the myoglobin molecule, resolution up to 2 A (Ramsay, 1965)
Amino acid residues with large (e.g., aromatic) radicals are clearly distinguishable. The helical arrangement of individual units in the polypeptide chain is visible in the shaded regions.
Looking at Fig. 33, all three Levels of Protein molecule organization are clearly discernible. First, the Amino Acid Sequence and their precise alternation along the polypeptide chain constitute the primary STRUCTURE OF THE protein. Furthermore, it can be seen that in the linear sections, the polypeptide chain is coiled into a helix corresponding to the Pauling-Corey a-helix. Finally, the alternating helical and amorphous regions are folded in space into a compact, symmetrical body—a globule—thus forming the tertiary structure of the protein.
What is The Significance of such a structure, and how is it related to the function of globular proteins? Unfortunately, it is not yet possible to answer this question. It is true that the oxidized and reduced forms of hemoglobin crystallize differently. This indicates a rearrangement of the Protein Structure during its function—that is, when Oxygen binds to the heme group. However, the exact nature of this rearrangement remains unknown, as only the oxidized form of hemoglobin (methemoglobin) has been studied to date. In general, to provide a comprehensive answer to this question, it is necessary to draw parallels between the structures of a series of proteins and their Functions, which in turn requires determining their tertiary structures. Currently, X-Ray Structural Analysis of several proteins—such as insulin, cytochrome c, ribonuclease, Lysozyme, and others—is underway in A number of laboratories. However, this work faces major difficulties in decoding X-ray diffraction patterns. At a 6 Å resolution, it is necessary to perform photometric measurements of 400 reflections of the myoglobin diffraction pattern; at a 2 Å resolution, about 10,000 reflections; and at a 1.4 Å resolution, more than 25,000 reflections. The number of measurements rises to hundreds of thousands when measurements of isomorphously substituted compounds are carried out in parallel. All of this has made it necessary to replace the photometric measurement of diffraction maxima with direct intensity reading using a quantum counter on an automatic diffractometer. The readings from this device are transmitted to a recording unit, and all subsequent calculations are performed using high-speed electronic computers. The automation of X-ray structural analysis gives hope that in the coming years this method will provide us with precise knowledge of the primary, secondary, and tertiary structures of a number of proteins.
Last update: 06/08/2026
Editorial and Educational Adaptation: This material has been compiled based on the primary/original source text. The project team performed an editorial review, corrected technical inaccuracies, structured sections, and adapted the content for an educational format.
What was processed:
- elimination of formatting defects (OCR errors, structural breaks, corrupted characters);
- editorial organization of content;
- standardization of terminology in accordance with academic sources;
- verification of factual statements against the original source text.
All mentions of the author, publication year, and origin of the primary text have been preserved in accordance with the source.