Biochemical Engineering Fundamentals, Part 1 - Bailey J., Ollis D. 1989
Transport phenomena in biotechnological systems
Sterilization of gases and liquids by filtration
In previous sections, we discussed the heat sterilization of liquids. However, high temperatures can lead to the degradation of certain medium components, and furthermore, thermal sterilization of gases is economically impractical. An alternative sterilization method suitable for both gases and liquids is filtration, which uses filters to remove all undesirable viable Cells and, in some cases, Viruses.
Filters are made of porous porcelain, compressed asbestos fiber, or synthetic microporous polymer membranes. The first two Materials are currently of historical interest only; today, microporous polymer membranes are almost exclusively used for sterile filtration. These filters are widely used for the sterilization of gases (in-line) or dilute liquid Suspensions entering a bioreactor.
Membrane filters offer the following advantages:
1. Porous membranes prepared from stable gels have an extremely narrow pore size distribution and, consequently, effectively retain any particles exceeding a certain size (which can be controlled by varying the pore size).
2. High porosity (often reaching 70–80%) and small thickness (about 100 µm) provide low resistance to liquid or gas flow, thereby ensuring high permeability of membrane filters to the solvent (Water). For example, a membrane with a filtration area of 10 cm2 and a pore diameter of 0.2 µm can pass 1 L of liquid in 2–3 min.
3. All membrane filter materials (including nitrocellulose, Cellulose acetate, vinyl polymers, polyamides, and fluorocarbons) withstand steam sterilization and are resistant to most aqueous suspensions and many organic substances.
4. The quality of a manufactured membrane is easily tested using a suspension of viable microorganisms of nearly uniform size. For example, porous filters with a pore diameter of 0.22 µm are tested using a suspension of the bacterium Pseudomonas aeruginosa, while Serratia marcescens can serve as an effective tool for testing membranes with a pore diameter of 0.45 µm. Viral strains can be used to monitor filters with very fine pores; the disadvantage of this method is the lack of well-established virus cultivation techniques.
The filters discussed in this section are used to remove trace amounts of particulate matter from gases or liquids to sterilize the latter (in pharmaceutical manufacturing) or to remove pathogens (in beverage production). Filtration as a method for separating solids from concentrated suspensions, such as culture broths, will be discussed in Chapter 11.
Exercises
8.1. Oxygen diffusion coefficients in protein solutions. Stroeve [53] pointed out that the equation proposed back in 1881 by J. C. Maxwell (Treatise on Electricity and Magnetism, vol. 1, 3rd ed.) for diffusion through a liquid containing spherical particles simplifies to the expression below if these particles are impermeable:
Class="center">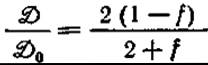
where D is the apparent diffusion coefficient in the suspension; D0 is the apparent diffusion coefficient in the pure liquid; and f is the volume fraction of the particles. He found that this equation agrees well with experimental data if f = fp + fb, where fp is the volume fraction of the protein, and fb is the volume fraction of water adsorbed On the surface of the protein molecules. Assuming that the protein molecule corresponds in size to Hemoglobin (a 65x55x55 Å spheroid), calculate D/D0 and plot D/D0 versus fp (not f) assuming that the protein molecules are surrounded by 0, 1, or 2 monolayers of Immobilized Water (fp range from 0.1 to 0.5). Compare your results with the experimental data for methemoglobin given below; discuss the comparison.
D/D0 |
0.69 |
0.43 |
0.17 |
fp |
0.1 |
0.2 |
0.4 |
8.2. Mass transfer coefficient. Determine kl for the following conditions:
liquid phase volume 10 L
turbine impeller diameter 10 cm
vessel diameter 50 cm
impeller speed 200 rpm
binary diffusion coefficient of air in medium 0.5·10-5 cm2/s
air flow rate 2 L/min
medium density 1.2 g/cm3
medium viscosity 0.1 g/(cm·s)
8.3. Oxygen transfer in the absence of agitation. Consider an unagitated aerated chemostat with a volume of 0.5 L, having 10 orifices in its bottom. What specific Cell Growth Rate will be maintained in the chemostat if the diameter of each orifice is 1 mm, the air flow rate through a single orifice is 5 mL/min, and if oxygen limits The Cell growth rate? Coalescence and breakup of air bubbles can be neglected; assume that the medium is sufficiently dilute to behave like pure water. Use the following parameter values in your calculations: μmax = 0.5 h-1; Ks = 0.1 mM; σ = 72 dyn/cm; g = 980 cm/s2; μgas = 2·10-4 g/(cm·s); D = 0.5·10-5 cm2/s; μliq = 10-2 g/(cm·s); pgas = 1.4 g/L; HL = 10 cm; YO/X = 1 g O2/g cells; x = 1.0 g cells/L.
8.4. "Variation" of kla with Temperature. The surface renewal theory predicts that the mass transfer coefficient varies proportionally to D1/2. For diffusion in liquids, According to the Stokes–Einstein equation, Dμ/T = const. Consequently, kl should be proportional to (T/μ)1/2.
a) Find data on the temperature dependence of water viscosity in any reference book and calculate The change in the ratio kl(T)/kl(T - 15°C) over the range from 15 to 60°C; plot the results.
b) The equilibrium concentration of dissolved oxygen depends on temperature (Table 8.1). Assuming that The ratio of the interfacial area to the volume, a, is independent of temperature, calculate the temperature dependence of y ≡ [klac*(T)/klac*(T = 15°С)] over the same range as in Exercise 8.4 a; plot the results.
What practical significance, in your opinion, might the constancy of the value of y shown in this exercise have? The constancy of y has been experimentally confirmed [54].
8.5. Batch Reactor; dependence of cell growth on mass transfer. A batch culture of microorganisms is grown at 35 °C. Using the sodium sulfite oxidation method, it was shown that kla'cl* = 0.1 mol/(l∙h).
The population doubling time during the exponential growth phase is 30 min, and the yield coefficient for oxygen is 0.6 g cells/g O2.
a) Calculate the specific cell growth rate, μ, in the exponential phase.
b) Using equation (8.14), calculate the dissolved oxygen concentration cl as the cell mass increases (initial value x0 = 10-6 g/ml). Plot cl versus x. At what cell mass concentration should the concentration cl become zero?
c) In a real process, it never becomes zero. Instead, at low dissolved oxygen concentrations, μ becomes a function of cl, as indicated, for example, by equation (8.15). Using equation (8.15) and the parameter values given above, calculate the dependence of cl on x. Assume KO2 is equal to 0.05 mmol/l. (It is more convenient to calculate x from given values of cl.)
d) For cl > 0.9 cl*, the process is limited by cell growth, and for cl < 0.1 cl*, The rate of the process is limited by mass transfer. Using equation (8.15) and the plot obtained in Exercise 8.5c, determine the ranges of x values corresponding to the growth-limited and mass-transfer-limited regimes.
e) The right-hand side of equation (8.15) represents dx/dt. On the same plot used for Exercise 8.5c, plot dx/dt versus x. What expression determines x at (dx/dt) max?
8.6. Effect of pressure. Oxygen transfer is enhanced by increasing its partial pressure through simply replacing air with pure oxygen. The Use of elevated pressure has also been proposed. Unfortunately, Microbial growth can be inhibited by oxygen, for example, due to the accumulation of reactive oxygen species in the cell, which can inhibit intracellular transformations requiring local reducing conditions.
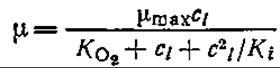
a) Assume that the dependence of the cell growth rate on the oxygen concentration can be described by the equation
or
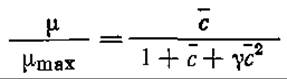
Where 
Show that the specific cell growth rate will be maximum at 
b) Based on equation (8.15), modified by incorporating the expression above (reflecting the inhibitory effect of oxygen), derive an equation that predicts the oxygen pressure pO2 that yields the maximum growth rate at any value of x. Since μmax = const, also determine the corresponding dependence of pO2 on time.
8.7. Secretion of a cellular metabolic product into the medium. a) In the microbiological synthesis of L-aspartate, the latter is formed at concentrations of 1, 2, 3, and 4 g/l at 1, 2, 3, and 4 h after THE START OF the process, respectively. If a surfactant (cetylpyridinium chloride) is added at t = 0, the L-aspartate concentration increases to 12, 22, 30, and 35 g/l, respectively. Can you explain what primary process (or processes) underlies the accumulation of L-aspartate in the medium in the absence and presence of the surfactant? (Data are taken from [55].)
b) The accumulation of Amino acids in the medium by certain E. coli strains occurs As a result of two simultaneous competing phenomena: passive transport out of the cell and Active Transport into the cell. Write the rate equation for the accumulation of an amino acid in the medium if this process is determined by these two phenomena. Describe several Methods for the experimental determination of initial amino acid accumulation rates; using 14C-labeled amino acids, these methods should allow the determination of all parameters of your proposed rate equation.
Mutations that eliminate catabolite repression and suppress active transport can lead to the accumulation of the metabolic product being limited solely by its transport (see [56]).
8.8. Mycelium immobilized on microbeads. Adsorption of Penicillium chrysogenum spores onto porous particles with a diameter of 300–500 μm was used to create an immobilized mycelial catalyst, the performance of which is compared below with that of a suspended mycelial culture. Both cultures were grown in the same bubble Column bioreactor.
Characteristic |
Cell suspension |
Immobilized cells |
xmax, g/l |
17.0 |
29.0 |
pmax, g/l |
2.0 |
5.5 |
kla∆c, mmol O2/(l⋅h⋅atm) |
50–100 |
100–350 |
Baseline parameter — power input, kW/m3 |
2.3 |
2.3 |
Energy efficiency of oxygen transfer, kg O2/kWh |
0.21 |
0.48 |
Specific energy consumption, kWh/g penicillin G |
0.12 |
0.07 |
a) Assuming (approximately) that kl is proportional to μ-1/2, estimate the ratio of the viscosities of the suspended and immobilized cultures. In your opinion, what causes the lower viscosity of the broth with a higher biomass concentration?
b) Estimate the comparative cost of the suspended culture and the immobilized culture. Which option is more economically advantageous [57]?
8.9. Scale-up methods. Table 8.5 lists various scale-up conditions (e.g., constant P/V value).
a) Analyze the positive (or negative) impact on other process variables if scale-up is performed at constant P/V, Nl, Fl/V, NiDi, or Rei.
b) It has been suggested that scale-up is best performed at constant kla and fluid shear rate (impeller tip speed), specifically at Di/Т ≈ 0.25–0.4 and NiDi = 0.5 m/s. Using the equations presented in this chapter, show how P/V, Ni, Fl/V, and Rei will change under these scale-up conditions [58].
8.10. Scale-up parameters in aeration processes. a) According to many equations, for agitated aeration, Sh = aReim1Scm2. Show that for the same bubble size, equal values of kl in two different vessels, such as a small one (I) and a large one (II), are possible only if the change in impeller speed, expressed in revolutions per minute Ni, during scale-up is described by
the following expression:
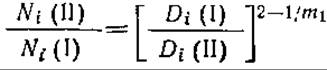
b) Show that this equation leads to the following equality, which holds at constant kl:
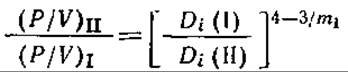
What specific Conclusion follows from the latter equation if the equation for the turbulent regime discussed in the text is taken into account?
c) If bubble size depends on mixing parameters, what limitations are imposed on the ratios Ni(II)/Ni(I), (P/V)Ii/(P/V)I?
8.11. Bubble column operation. a) Determine The values of a, H, and kl for a bubble column under the following conditions:
gas flow rate of 20 normal cubic feet (0.566 m3) per minute; liquid phase flow rate of 25 gallons (94.633 L) per minute (water); column inside diameter of 16 inches (40.64 cm); average bubble diameter D of 0.25 inches (0.64 cm). b) An alternative equation has been proposed for bubble flow (mass transfer into a liquid or a liquid-liquid system) [59]:

Compare this equation with the formula given in the text. Recalculate kl and estimate the percentage difference between the two methods of determining Sh.
8.12. Reaeration in a natural stream (riffles and pools). A flowing stream can be approximately described as an alternation of deep and shallow reaches of equal width. Let the "deep" and "shallow" reaches have depths hD, hs and lengths lD, lS, respectively.
a) Determine the ratio of oxygen Mass transfer coefficients in the deep and shallow reaches.
b) Without classifying organisms into separate species, mathematically describe The process of substrate utilization by aerobic organisms in the specified system of deep and shallow reaches, assuming that oxygen transfer limits the growth rate. Clearly state the assumptions made.
c) Find mathematical expressions (making simplifying assumptions if necessary) that determine the fraction of total microbial growth occurring in the pools and the fraction of total oxygen transfer occurring in the riffles.
8.13. Simplified description of stream reaeration (Streeter–Phelps equation). Under conditions where organic matter settling, sediment reactions, and volatile organic loss do not play a major role, stream reaeration can be described as a simple plug-flow phenomenon. The material balance equation for organic matter S in a stream flowing at velocity u can be written as follows:
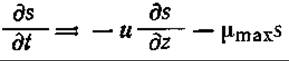
The following equation has been proposed for the oxygen material balance:

Here, on the right side of the equation, the first term represents the oxygen concentration gradient, the second represents the O2 input due to mass transfer, and the third represents the O2 consumption in microbial oxidation processes,
a) Show that 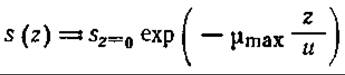 if the nutrient-oxidizing microorganisms receive oxygen in excess.
b) Show that at steady state, in the absence of Photosynthesis, algal Respiration, and settling, the oxygen concentration profile can be described by the Streeter–Phelps equation:
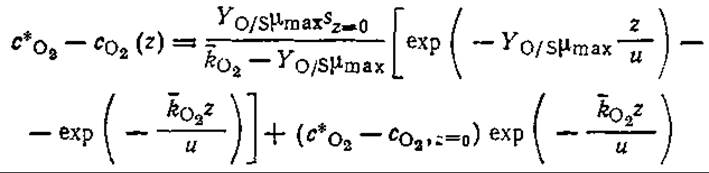
where  is the oxygen mass transfer coefficient averaged over the eddy; l is the flow depth.
c) Show that in the Streeter–Phelps model, the parameter c*O2 — cO2(z), called the oxygen deficit, has a single minimum at

What distance z corresponds to this point of maximum oxygen deficit? Derive similar expressions for the case when photosynthesis, algal respiration, and settling, occurring at constant rates, must be taken into account.
8.14. Heat transfer; bubble size. Consider the process whose stoichiometry is given in Exercise 5.13.
a) Suppose that a batch aerobic microbial process is carried out in a cylindrical tank 1.83 m in diameter, equipped with a cooling coil 39.6 m long and 2.54 cm in diameter, with the spacing between the coil turns being 3.08 cm. Assume further that all heat transfer occurs through the coils and that the sparger maintains a sufficiently high Kla value such that cell growth is not oxygen-limited. What must be the minimum impeller speed (in revolutions per minute) to provide the required heat transfer, if the average fluid velocity in the direction perpendicular to the coil tubes is 10% of the impeller tip speed, the average coolant temperature is 18 °C, and the reactor must operate at a temperature not exceeding 28 °C? Repeat the calculations for concentrations of 106, 107, 108, and 109 cells per milliliter [single-blade impeller diameter 4.5 ft (1.37 m), blade thickness 1.2 in (3.05 cm), height 6 in (15.24 cm)].
b) At a density of 109 cells/mL, the aeration rate is such that the cells absorb 10% of the incoming oxygen. Due to poor sparger design, the bubble size is too large. What impeller speed (in revolutions per minute) is required to ensure the bubbles have an adequate diameter? Would better results be achieved by a second, much smaller but high-speed blade impeller installed directly above the sparger, for example, an impeller with parameters D2 = 0.2 D1, N2 = 10 N1?
8.15. Similarity criteria. Buckingham Pi Theorem. In heat transfer processes during forced fluid flow over a pipe surface, the following parameters are important for determining the fluid-side heat transfer coefficient (h): characteristic pipe diameter D, fluid velocity u, fluid viscosity μ (in poise), density p, specific heat capacity at constant pressure Cp [in cal/(mol∙deg)], and fluid thermal conductivity kf [in cal/(s⋅cm⋅deg)]. Buckingham's Pi Theorem states that 'a functional relationship among q quantities, whose units can be expressed in terms of p fundamental dimensions, can be written as a function of q—p dimensionless groups'. In heat transfer, the fundamental dimensions are mass m, length l, time t, and temperature T.
a) Express h, D, u, μ, p, Cp, and k in terms of these dimensions, i.e., in the form malbtcTd.
b) Four dimensionless groups are typically formed from the following similarity criteria: Nu (Nu ≡ hD/kf), Re (Re ≡ pDu/μ), Pr (Pr ≡ Cpμ/kf), and the Stanton number St (St = h/uCpp). Give your thoughts. What, in your opinion, does the Stanton number represent?
8.16. Power-law fluids; starch Hydrolysis. Heating a 1% (w/v) suspension of amylopectin in water yields a pseudoplastic solution that should obey the equation т = ηуn, where n < 1.0. During the hydrolysis of this solution by α-amylase in a batch reactor, the following changes in system parameters over time were observed [60]:
η, dyn⋅sn/cm2 |
0.32 |
0.26 |
0.20 |
0.14 |
0.10 |
0.03 |
n |
0.73 |
0.75 |
0.78 |
0.83 |
0.85 |
0.98 |
a) Show that these data can be described by the equation т0 = ηу0n, where т0, у0 are constants.
b) Using appropriate plots, show that all curves of т versus у at any degree of hydrolysis intersect at a single point.
c) How will the power consumption change over time if the impeller speed is constant? Can this parameter be used for continuous on-line monitoring of the batch process?
8.17. Dependence of power consumption on impeller speed in Non-Newtonian fluids. For non-Newtonian fluids with a power-law index n < 1, the shear rate y can be assumed to be proportional to the impeller speed Ni [61].
a) Show that for a fluid between two coaxial cylindrical surfaces, the shear rate at the outer cylinder (as the rotational speed of the inner cylinder varies) changes according to the expression (dτ/dNi) ∝Nin-1.
b) Show that the Reynolds number Re = Di2Nip/η0, where ηv is the apparent viscosity (which depends on the shear rate), is proportional to Ni2-n.
c) For the above Reynolds number, the dependence of the power number (Pgc/Di5Ni3p) on the Reynolds number is identical to that for Newtonian fluids (or the corresponding curve lies slightly below the curve for a Newtonian fluid). If P0 is proportional to Rea, show that the power consumption is proportional to Ni3+a(2-n)
d) How, using the information obtained in the previous exercises, could you determine the proportionality constant between y and Ni for a non-Newtonian fluid?
8.18. Phases of microbial hydrocarbon Processing.
a) Figure 8.14 shows the Main phases of microbial hydrocarbon processing according to Mimura et al. Find mathematical expressions describing the rates of cell growth and substrate utilization in each phase of the batch process. For each 'phase', provide quantitative characteristics that determine The Nature of the primary resistance to cell growth, such as hydrocarbon solubility, Oxygen transport, cell METABOLISM, etc.
b) Give the reasons why a system consisting of cells, hydrocarbon droplets, air bubbles, and solvent assumes each of the structures mentioned by the authors. What experiments are suggested by these observations? How could you prove the proposed hypotheses or choose the most reasonable one?
8.19. Microbial processes with two (gaseous) substrates. Hamer et al. [SCP Production from Methane, p. 362 in SINGLE CELL PROTEIN II, Tannenbaum S. R., Wang D. I. C. (eds), MIT Press, Cambridge, Mass., 1975] indicated that cell growth during methane utilization in the presence of oxygen in a continuous, constantly sparged reactor can be described by a double Michaelis–Menten Equation:

Here, subscripts 1 and 2 denote parameters relating to oxygen and methane, respectively.
a) Assuming that the yield coefficients Y1 and Y2 (g cells/g substrate i; i = 1,2) are constant, write the steady-state material balance equations for biomass and substrates 1 and 2, assuming sterile feed. Take the overall mass transfer coefficient as Klia, and assume that both the liquid and gas phases are completely mixed.
b) An increase in the dilution rate eventually leads to washout. Show graphically or analytically that washout occurs at D of about 0.72 h-1 for the following parameter values: K1 = K2 = 5⋅10-4 g/L; Y1 = 1.25 g cells/g O2; Y2 = 2.0 g cells/g substrate; Klia = Kl2a = 100 h-1; cl* = 0.015 g/L; c2* = 0.007 g/L; μmax = 0.8 h-1.
Diffusion:
1. Weisz P., Diffusion and Chemical Transformation: An Interdisciplinary Excursion, Science, 179, 433 (1973).
Oxygen demand of cell cultures and oxygen solubility:
2. Finn R. K., Agitation and Aeration, in Biological Engineering Science, Blakebrough N. (ed.), vol. 1, p. 69, Academic Press, Inc., New York, 1967.
Relationship between diffusion through liquid films and Chemical Reactions:
Transport Processes in Biotechnological Systems
3. Danckwerts P. V., Gas-Liquid Reactions. — Moscow: Khimiya, 1973.
4. Astarita G., Mass Transfer with Chemical Reaction. — Leningrad: Khimiya, 1971.
5. Bird R., Stewart W., Lightfoot E., Transport Phenomena. — Moscow: Khimiya, 1974.
Culture fluids:
6. Taguchi H., The Nature of Fermentation Fluids, Adv. Biochem. Eng., 1 (1971).
Scale-up problems in microbiological processes:
7. Biotech. Bioeng., 8 (1966), Gaden E. L., Jr. (ed.) (entire volume).
Examples of mass transfer in microbiological reactors:
8. Moser A., in Proc. Int. Symp. Adv. Microb. Eng., 1, 295—580 (1973).
9. Van’t Riet K., Trends in Biotechnology, Mass Transfer in Fermentation, 1, (4), 113 (1983).
Equations for Determining oxygen transfer:
10. Calderbank P. H., Moo-Young M., The Continuous Phase Heat and Mass Transfer Properties of Dispersion, Chem. Eng. Sci., 16, 39 (1961).
11. Calderbank P. H., Mass Transfer in Fermentation Equipment, in Biochemical and Biological Engineering Science, Blakebrough N. (ed.), vol. 1, Academic Press Inc., New York, 1967.
12. Akita K., Yoshida F., Bubble Size, Interfacial Area, and Liquid-Phase Mass Transfer Coefficient in Bubble Columns, I & EC Process Des. Develop., 13, 84 (1974).
13. Bello R. A., Robinson C. W., Moo-Young M., Mass Transfer and Liquid Mixing in External Circulating Loop Contactors, Adv. Biotech., 1, 547 (1981).
14. Wang К. B., Fan L. T., Mass Transfer in Bubble Columns Packed with Motionless Mixers, Chem. Eng. Sci., 33, 945 (1978).
Oxygen demand in batch processes:
15. Darby R. Т., Goddard D. R., Studies of the Respiration of the Mycelium of the Fungus Myrothecoum verracaria, A. J. Bot., 37, 379 (1950).
Determination of kla using an oxygen electrode:
16. Weman W. C., Wilke C. R., New Method for Evaluation of Dissolved Oxygen Response for КLa Determination, Biotech. Bioeng., 15, 571 (1973).
Absorption by water films:
17. Briffaud J., Engasser M., Growth and Excretion Kinetics in a Trickle-Flow Fermentor, Biotech. Bioeng., 21, 2093 (1979).
18. Livansky К., Prokes B., Kihrt F., Benes V., Some Problems of CO2 Absorption by Algae Suspensions, Biotech. Bioeng. Symp., 4, p. 513 (1973).
Stoichiometry of methane utilization:
19. Klass D. L., Iandolo J. J., Knabel S. J., Key Process Factors in the Microbial Conversion of Methane to Protein, CEP Symp. Ser., [93], 65, 72 (1969).
Equations for determining the required orifice diameter:
20. van Krevelen D. W., Hoftijzer P. J., Studies of Gas-Bubble Formation: Calculation of Interfacial Area in Bubble Contactors, Chem. Eng. Prog., 46, 29 (1950).
21. Schügerl К., Lücke J., Bubble Column Bioreactors, in Advances in Biochemical Engineering, Ghose T. K., Fiechter A., Blakebrough N. (eds.), vol. 7, p. 1, Springer-Verlag, Berlin, 1977.
Photographic determination of a, H, Sauter D:
22. Calderbank P. H., Rennie J., Int. Symp. Distill. (Inst. Chem. Eng.), 1960.
Dependence of large bubble shape on velocity [equation (8.36)]:
23. Davies R. М., Taylor G. I., Proc. Roy. Soc., A200, 375 (1956).
Mass transfer through a free surface to a falling liquid film (see reference [5]).
Mass transfer through a free surface to a turbulent water flow:
24. Fortescue G. Е., Pearson J. R. A., On Gas Absorption into a Turbulent Liquid, Chem. Eng. Sci., 22, 1163 (1967).
25. O’Connor D. J., Dobbins W., The Mechanism of Reaeration In Natural Streams, J. Sanit. Eng. Div., Proc. ASCE, 82, SA6 (1966).
Dependence of turbine power on the impeller Re:
26. Rushton J. Н., Costich Е. W., Everett H. J., Power Characteristics of Mixing Impellers, pt. 2, Chem. Eng. Prog., 46, 467 (1950).
Power consumption in aerated and non-aerated processes:
27. Ohyama Y., Endoh К., Power Characteristics of Gas-Liquid Contacting Mixers, Chem. Eng. Japan, 19, 2 (1955).
28. Michel B. J., Miller S. A., Power Requirements of Gas-Liquid Agitated Systems, AIChE J., 8, 262 (1962).
Liquid jet mixing:
29. Blenke H., Loop Reactors, in Advances in Biochemical Engineering, Ghose T. K., Fiechter A., Blakebrough N. (eds.), vol. 13, p. 121, Springer-Verlag, Berlin, 1979.
For literature on equations with the Weber number, see [И].
Oxygen diffusion coefficients in microbial films:
30. Matson J. V., Characklis W. G., Oxygen Diffusion through Microbial Aggregates, 77th AIChE Meet., Pittsburgh, June 1973.
Effect of Ionic strength on kla:
31. Robinson C. W., Wilke C. R., Oxygen Absorption in Stirred Tanks: A Correlation for Ionic Strength, Biotech. Bioeng., 15, 755 (1973).
Surfactants and mass transfer:
32. Eckenfelder W. W., Jr., Barnhart E. L., The Effect of Organic Substances on The transfer of Oxygen from Air Bubbles into Water, AIChE J., 7, 631 (1961).
33. Benedek A., Heideger W. J., Effect of Additives on Mass Transfer in Turbine Aeration, Biotech. Bioeng., 13, 663 (1971).
34. Bull D. N., Kempe L. L, Influence of Surface Active Agents on Oxygen Absorption to the Free Interface in a Stirred Fermentor, Biotech. Bioeng., 13, 529 (1971).
35. Aida S., Toda K., The Effect of Surface Active Agents on Oxygen Absorption in Bubble Aeration I, J. Gen. Appl. Microbiol., 7, 100 (1963).
36. Mancy K. H., Okun D. A., Effect of Surface Active Agents on the Rate of Oxygen Transfer, Adv. Biol. Waste Treat., IІІ (1963); see also the works of McKeown and Okun, Timson and Dunn, and Carberry in the same source.
Rheology of microbial broths:
37. Leduy A., Marson A. A., Corpal В., A Study of the Rheological Properties of a Non-Newtonian Fermentation Broth, Biotech. Bioeng., 16, 61 (1974). (Study of A. pullulans culture.)
38. Roels J. A., van den Berg J., Voncken R. AT., The Rheology of Mycelial Broths, Biotech. Bioeng., 16, 181 (1974). (Study of Penicillium culture.)
39. Thompson N., Ollis D. F., Evolution of Power Law Parameters for Xanthan and Pullulan Batch Fermentations, Biotech. Bioeng., 22, 875 (1980).
40. Chang H. T., Ollis D. F., Generalized Power Law for Polysaccharide Solutions, Biotech. Bioeng., 24, 2309 (1982).
Study of Morphology in series-connected reactors:
41. Vrana D., Some Morphological and Physiological Properties of Candida utilis Growing «Hypertrophically» in Excess of Substrate in a Two-Stage Continuous Cultivation, Biotech. Bioeng. Symp., 4, 161 (1973).
Determination of power consumption in non-Newtonian biological media:
42. Taguchi Н., Miyamoto S., Power Requirement in Non-Newtonian Fermentation Broth, Biotech. Bioeng., 8, 43 (1966).
Cell concentration and mass transfer:
43. Brierley М. R., Steel R., Agitation-Aeration in Submerged Fermentation, pt. 2: Effect of Solid Dispersed Phase on Oxygen Absorption in a Fermentor, Appl. Microbiol., 7, 57 (1959). (A. niger.)
44. Andrews G. F., Fonia J. P., Marrota E., Stroeve P., The Effects of Cells on Oxygen Transfer Coefficients, Chem. Eng. J., 29, B39, B47 (1984).
Mixing and cell damage. See [7], as well as:
45. Midler М., Finn R. К, A Model System for Evaluating Shear in the Design of Stirred Fermentors, Biotech. Bioeng., 8, 71 (1966).
Cellulose pulp suspensions:
46. Blakebrough N., Sambamurthy K, Mass Transfer and Mixing Rates in Fermentation Vessels, Biotech. Bioeng., 8, 25 (1966).
Filtration through fibrous filters:
47. Friedlander S. К., Aerosol Filtration by Fibrous Filters, in Biochemical and Biochemical Engineering Science, Blakebrough N. (ed.), vol. 1, p. 49,. Academic Press, New York, 1967.
48. Air Filtration, Davies C. N. (ed.), Academic Press, New York, 1973.
49. Dwyer J. L, Filtration in the Food, Beverage, and Pharmaceutical Industries, p. 121, in Filtration: Principles and Practices, Part II, Marcel Dekker, New York, 1979.
Heat transfer; parameter analysis; see p. 396 et seq. in [5], as well as:
50. Brown А. I., Macro S. М., Introduction to Heat Transfer, pp. 85—95, McGraw-Hill Book Company, New York, 1958.
Economic aspects of heat transfer in microbiological processes:
51. Abbott В. Clamen A., The Relationships of Substrate. Growth Rate, and Maintenance Coefficient to Single Cell Protein Production; Biotech. Bioeng., 15, 117 (1973).
Enthalpy balance in microbiological processes:
52. Cooney С. L, Wang D. I. С., Mateles R. I., Measurement of Heat Evolution and Correlation with Oxygen Consumption during Microbial Growth, Biotech. Bioeng., 11, 269 (1968).
Exercises:
53. Stroeve P., On the Diffusion of Gases in Protein Solutions, Ind. Eng. Chem, Fundam., 14, 140 (1975).
54. Aiba S., Koizumi J., Ru J. S., Mukhopadhyay S. N., The Effect of temperature on kla in Thermophilic Cultivation of Bacillus stearothermophilus, Biotech. Bioeng., 26, 1136 (1984).
55. Fukui C., Ishida, Microbial Production of Amino Acids, Kodansha Ltd., Tokyo and John Wiley, New York, 1972.
56. Rancourt D. E., Stephenson J. T., Vickell G. A., Wood J. M., Proline Excretion by Escherichia coli K12, Biotech. Bioeng., 26, 74 (1984).
57. Gbewonyo К., Wang D. I. C., Enhancing Gas-Liquid Mass Transfer Rates in Non-Newtonian Fermentations by Confining Mycelial Growth to Microbeads in a Bubble Column, Biotech. Bioeng., 25, 2873 (1983).
58. Oldshue J., Fermentation. Mixing Scale-Up Techniques, Biotech. Bioeng., 8, 3 (1966).
59. Hughmark G. A., Holdup and Mass Transfer in Bubble Columns, Ind. Eng. Chem. Process Des. Dev., 6, 218 (1967).
60. Cruz A., Kinetics and Shear Viscosity of Enzyme Hydrolysed Starch Pastes, Ph. D. thesis, Princeton University, Princeton, N.J., 1976.
61. Metzner A. B., Feehs R. H., Ramos H. L., Otto R. E., Tuthill J. D., Agitation of Viscous Newtonian and Non-Newtonian Fluids, AIChE J., 7, 3 (1961).
Last update: 06/08/2026
Editorial and Educational Adaptation: This material has been compiled based on the primary/original source text. The project team performed an editorial review, corrected technical inaccuracies, structured sections, and adapted the content for an educational format.
What was processed:
- elimination of formatting defects (OCR errors, structural breaks, corrupted characters);
- editorial organization of content;
- standardization of terminology in accordance with academic sources;
- verification of factual statements against the original source text.
All mentions of the author, publication year, and origin of the primary text have been preserved in accordance with the source.