IMMUNOLOGY TEXTBOOK - Mercury Podillia 2013
IMMUNOLOGICAL RESEARCH METHODS
Functional Tests
Lymphocyte blastogenesis assay (lymphocyte blast transformation test). Principle of the method. Under METABOLISM/18.html">The Influence of non-specific and specific stimuli, lymphocytes transform into blasts—large pyroninophilic Cells capable of proliferation and subsequent differentiation, which leads to an increase in the number of responding cells within the lymphoid tissue. This phenomenon is known as blast transformation, which is continuously observed in lymphoid Tissues As a result of antigenic stimulation.
Certain substances are known to exert a mitogenic effect on lymphocytes (Table 12). Phytohemagglutinin (PHA)—a plant lectin derived from common bean seeds—is most frequently used in clinical laboratory practice to assess the functional status of T lymphocytes.
Class="center">Table 12. Selected Non-Specific Lymphocyte Mitogens
Mitogen |
Origin |
Target |
PHA |
Phaseolus vulgaris |
T lymphocytes |
Con A |
Canavalia ensiformis |
T lymphocytes |
Pokeweed mitogen MA (PWM) |
Phytolacca americana |
B lymphocytes in the presence of T cells |
Gram-negative bacterial lipopolysaccharide (LPS) |
E. coli, S. typhi, N. meningitidis, etc. |
B lymphocytes |
Phytohemagglutinin (PHA) induces the transformation of T lymphocytes, whereas E. coli lipopolysaccharide (LPS) induces the transformation of B lymphocytes into blasts in Cell culture.
Procedure. Pour 0.5 mL of a heparin solution containing 50 IU/mL into a sterile test tube. Collect 2 mL of venous Blood.
Phytohemagglutinin (PHA) and E. coli lipopolysaccharide (LPS) are used at a concentration of 0.1 mg/mL.
Add 2 mL of Medium 199 to each of 6 sterile vials and add penicillin and streptomycin solutions at a rate of 100 IU/mL of each antibiotic. Shake the vials and place them in a refrigerator. Prepare 2 vials for spontaneous lymphocyte blastogenesis assay (control). Add 0.05 mL of PHA solution at a concentration of 0.01 mg/mL of culture (stimulating dose of 25 mcg/mL) to 2 vials. Add another 0.05 mL of E. coli LPS solution at a concentration of 0.01 mg/mL of culture (stimulating dose of 25 mcg/mL) to 2 more vials. Add 0.2 mL of blood to all vials. Place the vials in an incubator at 37°C for 3 days. Shake the vials daily. Then, transfer the contents of each vial into centrifuge tubes and centrifuge for 5 min at 3000 rpm. Resuspend the pellet in air and prepare 2 smears for each vial. Fix the smears and stain them with azur-eosin using the Romanowsky method.
Examine the smears under an immersion objective. Calculate the percentage of lymphocyte blast transformation as follows: determine the number of medium lymphocytes and blasts relative to the total number of lymphocytes (100 cells). Express the assay result as the percentage of lymphocyte blast transformation (%).
Clinical significance. Spontaneous lymphocyte proliferation (blast transformation) is elevated in patients who have undergone multiple blood transfusions, patients with allergic and autoimmune diseases, during bacterial and viral infections, and in newborns.
A decrease in the proliferative response to PHA indicates the presence of an immunodeficiency. A low response in the blastogenesis assay may correlate with T-cell deficiency in peripheral blood or an altered CD4/CD8 ratio favoring suppressor cells. In some cases (e.g., during the recovery period following Radiation therapy or intensive Chemotherapy), a low response to T-cell mitogens may be associated with the release of large numbers of immature T cells into the peripheral blood. A low response in the assay may also be caused by impaired production of lymphokines such as IL-1 and IL-2.
Leukocyte migration inhibition assay using the direct capillary method. The motility of peripheral Blood Leukocytes, their migration toward sites of tissue destruction, chemotaxis toward auto- and heteroantigens, and redistribution among Lymphoid Organs during stress-adaptation reactions are integral Components of the general reactivity system and the capacity to maintain internal environment Homeostasis.
Lymphocytes sensitized to a specific antigen exhibit a dramatic decrease in motility in a medium containing that antigen. The leukocyte migration inhibition assay (LMIA) is based on the direct interaction of the antigen with antigen-specific receptors, as well as the action of a migration inhibitory factor released upon contact with the specific antigen. This phenomenon demonstrates organ-specific cell-mediated hypersensitivity.
Procedure. Add 0.2 mL of test heparinized blood (25 IU of heparin per 1 mL of blood) to each of 6 wells of an immunological assay plate. The first 2 wells serve as the control. Into the remaining
2 wells, add 0.05 mL of PHA solution at a concentration of 0.01 mg/mL of culture (test 1). Into the last 2 wells, add 0.05 mL of an antigen solution, such as a drug product (test 2). Calculate the concentration of the added antigen experimentally and express it in mg/mL. Fill 1/3 of the length of capillaries (with an inner diameter of 0.7 mm and a length of 12 cm) with the resulting mixtures up to a mark pre-applied at a distance of 1/3 of the length from either end. Use 2 capillaries for each control and test.
Seal the filled capillaries with wax or plasticine and place them in labeled centrifuge tubes. Secure the capillaries in the tube using a small piece of cotton or plasticine in a strictly vertical position. Centrifuge the capillaries for 5 min at 800 rpm, then place them vertically in an incubator and incubate at 37°C for 24 h.
Evaluation of results. After incubation, evaluate the results. To do this, use an ocular micrometer under a Microscope to measure the migration distance of the bulk of leukocytes from the erythrocyte pellet boundary in both the control and tests. Express the results as the migration percentage in the test relative to the control.
Normally, the migration percentage ranges from 40-70%; an increase to 90% or a decrease to 30% is considered moderate; values above 90% and below 30% are considered significant.
Clinical significance. An increase in the migration index indicates a decrease in the functional activity of lymphocytes—specifically, their ability to produce cytokines. The detection of lymphocytes sensitized to a specific antigen indicates the involvement of this antigen in The Development of specific hypersensitivity and can be used in the Diagnosis of tumors, Glomerulonephritis, and the Cytology/practical/136.html">Differential diagnosis OF myocarditis and cardiomyopathies.
The LMIA is used to assess delayed-type hypersensitivity (DTH), as it is essentially an in vitro counterpart of cellular immune reactions in DTH. The same mitogens used in the lymphocyte blastogenesis assay are employed as substances that modulate (inhibit or activate) spontaneous leukocyte migration activity. In addition, tissue and microbial Antigens, as well as standard allergens, can be used. The latter are applied in the diagnosis of sarcoidosis, tuberculosis, alveolitis, and other conditions characterized by The formation of epithelioid-cell granulomas (tissue manifestations of DTH).
Loading tests with drugs and other substances. This typically involves incubating cells for a specified time with small doses close to physiological quantities of drugs, or without them. These tests are performed with pharmacological agents, including immunomodulatory drugs (thymalin, levamisole, etc.), to determine the drug's effect on cells and predict its therapeutic efficacy.
In rosette formation assays, the following loading tests are most commonly used:
1) cell incubation at 37 °C for 0.5–2 hours;
2) cell incubation for the same duration with solutions of various agents at near-physiological concentrations, such as levamisole, theophylline, T-activin, and other immunomodulatory drugs;
3) cell incubation with various doses of the same agents.
T-lymphocyte activation is typically assessed by the following parameters:
✵ proliferation;
✵ production of cytokines: interleukins-2, -4, -5, interferon-0, and tumor necrosis factor;
✵ expression of activation markers: CD25 and HLA class II antigens;
✵ cytotoxicity.
Investigation of the functional activity of phagocytes. Isolation of the leukosuspension for the phagocytosis assay and the nitroblue tetrazolium test is performed using heparinized blood.
Materials and equipment: 10% medical gelatin solution; heparin; Medium 199 or Hanks' balanced salt solution; 0.83% ammonium chloride solution; bucket-rotor centrifuge; incubator; microscope; Goryaev chamber; siliconized test tubes.
Method description. Venous blood (2–3 ml) is collected into a tube containing heparin at a ratio of 10–20 IU of heparin per 1 ml of blood. A 10% gelatin solution is added to the blood at a proportion of 0.1 ml of gelatin per 1 ml of blood, and the mixture is placed in an incubator for 30–40 min at 37 °C. After sedimentation, the supernatant, consisting of the leukosuspension, is transferred to a separate tube, and an 0.83% ammonium chloride solution is added to lyse contaminating erythrocytes. The leukosuspension is then washed three times with Medium 199 or Hanks' solution in a centrifuge for 5–10 min at an acceleration of 100–200 g (500–1500 rpm). The leukocyte pellet is resuspended in Medium 199, and the concentration is adjusted to 5x10⁶ cells/ml. To minimize cell loss, all manipulations are performed using siliconized glassware.
Assay of the phagocytic activity of blood leukocytes.
Materials and equipment: monodisperse latex particles; methanol; May-Grunwald-Giemsa (or Romanowsky-Giemsa) stain; Glass slides; plastic plates for immunological reactions.
Method description. 0.1 ml of the leukosuspension and 0.2 ml of monodisperse latex particles at a concentration of 5x10³/ml are placed in siliconized test tubes or plates. The optimal ratio of cells to latex particles is 1:100. The mixture is stirred and placed in an incubator for 30 min at 37 °C. Following incubation, the cells are washed three times with Medium 199, and the preparation is prepared.
Smears are prepared on thoroughly washed, degreased glass slides. A drop of the leukosuspension is placed near the edge of the slide. Using a spreader slide held at a 45° angle to the surface just ahead of the drop—waiting until the drop spreads evenly along its edge—a smooth, rapid forward motion is executed without lifting the spreader until the entire drop is exhausted. A correctly made smear has a uniformly matte finish, does not reach the edges of the slide, and terminates in tapered feather edges. The prepared smears are air-dried, fixed for 10 min in absolute methyl alcohol, and stained with Romanowsky-Giemsa azure-eosin.
COMPOSITION OF THE ready-to-use stain: azure II – 3 g, Water-soluble eosin yellowish – 0.8 g, methyl alcohol – 250 ml, and glycerol – 250 ml. To stain the smears, 2 drops of the stock dye solution are added to 1 ml of distilled water.
Alternatively, the stain can be prepared immediately before staining from azure II, eosin, and distilled water at a ratio of 3:2:5. 3 ml of the dye solution is layered over each smear. Staining time is 45–50 min. After staining, the smears are examined under a microscope using an immersion system (counting at least 200 cells), and phagocytic indices are calculated.
1. Phagocytic index (PI) – the percentage of phagocytizing cells out of the Total Cell Count. The normal range is 65–95%.
2. Phagocytic number (PN) – the average number of intracellular latex particles per phagocytizing cell (calculated by dividing the total number of engulfed latex particles by the number of phagocytizing cells). It characterizes the engulfing capacity of neutrophils. The normal range is 5–10.
Clinical significance. The evaluation of phagocytosis parameters is important in diagnosing immunodeficiency states, such as recurrent purulent inflammatory processes, non-healing wounds, and susceptibility to postoperative complications. Phagocytosis metrics assist in diagnosing secondary immunodeficiencies induced by drug therapy. Because phagocytes participate in the clearance of immune complexes and phagocytic activity is closely linked to Complement components (specifically C3), IgG antibody concentration, and other opsonizing factors, phagocytosis assays play a role in diagnosing, assessing activity, and monitoring therapeutic efficacy in rheumatic diseases and other Connective Tissue disorders. The phagocytic number and phagocytic number coefficient, which reflect completed phagocytosis, are considered the most informative parameters for evaluating phagocytic activity.
The phagocytic activity of neutrophils typically increases at the onset of an inflammatory process. Its decrease leads to the chronicity of inflammation and the maintenance of autoimmune processes, as the impairment disrupts the destruction and removal of circulating immune complexes from the body.
Elevated parameters are observed in: antigenic stimulation resulting from bacterial inflammation (prodromal period, acute phase of infection) with normal phagocytic activity; leukocytosis; allergic reactions; autoimmune diseases; enhanced antibody-dependent cell-mediated cytotoxicity; and responses to a donor graft.
Decreased parameters are observed in: chronic bacterial and viral Inflammatory Diseases; congenital defects of the phagocytic system, Chediak-Higashi syndrome, Down syndrome, systemic lupus erythematosus (SLE), immune complex disease, granulomatosis, immunoglobulin or complement deficiencies; Treatment with cytostatics, immunosuppressants, or ionizing radiation exposure; secondary and Primary immunodeficiencies; neoplasms; severe Burns, trauma, and stress; protein-losing enteropathies and nephropathies; malnutrition; phagocytic dysfunction; and chronic inflammation.
NBT test – nitroblue tetrazolium reduction test. The spontaneous NBT (nitroblue tetrazolium) test evaluates the state of the oxygen-dependent bactericidal mechanism of blood phagocytes (granulocytes) in vitro. It characterizes the status and activation degree of the intracellular NADPH oxidase antibacterial system.
THE PRINCIPLE OF the method is based on the reduction of the soluble dye nitroblue tetrazolium (NBT), engulfed by the phagocyte, into insoluble diformazan under the Influence of the superoxide anion generated during the NADPH oxidase reaction, which triggers phagocytic stimulation. The yellow dye NBT is added to the phagocytes. Normally, upon its uptake, the METABOLIC ACTIVITY OF the phagocytes increases, NBT is reduced, and diformazan precipitates as coarse dark blue granules inside or On the surface of the cells, staining the phagocytes blue.
Materials and equipment: 0.2% nitroblue tetrazolium solution; 2% aqueous methyl green solution; water bath; methanol; glass microscope slides; siliconized tubes.
Method description. To perform the NBT test, 0.1 mL of 0.2% nitroblue tetrazolium is added to 0.1 mL of leukocyte suspension. The mixture is incubated in a water bath at 37°C for 25 min and at room Temperature for 15 min. Subsequently, the cells are washed three times with Medium 199, and smears are prepared. The dried smears are fixed with methanol and stained with a 2% aqueous methyl green solution for 30 s to 5 min.
Data evaluation involves counting the relative and absolute number of diformazan-positive leukocytes (for specialized studies, calculations can be made separately for neutrophils and monocytes) and determining the cytochemical score (CS) of the reaction. To determine the CS, cells are graded as follows during evaluation: diformazan-negative cells – activity degree 0; cells with single diformazan granules or with an area stained by diformazan up to 25–30% – activity degree 1; cells with Cytoplasm 30–70% filled with diformazan clumps – activity degree 2; cells with more than 70% of the cytoplasm containing diformazan granules – activity degree 3. A total of 300 leukocytes are counted in each slide. The cytochemical score is calculated using the formula:

where 0, 1, 2, and 3 represent the degree of reduced diformazan activity;
a, b, c, and d are the number of cells corresponding to each degree of activity. The levels of spontaneous (basal) and latex-stimulated NBT tests are determined as follows: 0.1 mL of heparinized blood and 0.1 mL of 0.1% aqueous NBT solution are incubated in conical tubes at 37°C for 40 min with 0.1 mL of Medium 199 for the spontaneous NBT test, or with 0.1 mL of latex suspension for the latex particle-stimulated NBT test.
Clinical significance. The spontaneous NBT test allows for the Assessment of the degree of antigenic stimulation in in vitro unactivated blood granulocytes. It characterizes the activation level of intracellular antibacterial systems. Phagocytic metabolism impairment is indicated by a reduced intensity of the blue staining. When disorders are detected, the levels of cytochrome b558 and other phagocyte Proteins are measured. NBT test values increase during the early stage of acute bacterial infections, whereas they decrease during the chronic course of an infectious process. Eradication of the pathogen from the body is accompanied by normalization of the indicator. A sharp decrease indicates decompensation of anti-infective defense and is a prognostically unfavorable sign. The normal value for the spontaneous NBT test is up to 10%.
The NBT test plays a vital role in diagnosing chronic granulomatous disease, which is characterized by defects in the NADPH oxidase complex. Patients with chronic granulomatous disease typically experience recurrent infections (Pneumonia, lymphadenitis, lung, Liver, and Skin abscesses) caused by Staphylococcus aureus, Klebsiella spp., Candida albicans, Salmonella spp., Escherichia coli, Aspergillus spp., Pseudomonas cepacia, Mycobacterium spp., and Pneumocystis carinii.
Neutrophils in patients with chronic granulomatous disease exhibit normal phagocytic function but, due to a defect in the NADPH oxidase complex, are unable to destroy microorganisms. Hereditary defects of the NADPH oxidase complex are X-linked in the majority of cases, and autosomal recessive less frequently.
Elevated values are observed in: antigenic stimulation due to bacterial inflammation (prodromal period, acute infection phase) with normal phagocytic activity; chronic granulomatous disease; leukocytosis; allergic reactions; autoimmune diseases; enhancement of antibody-dependent cellular cytotoxicity.
Decreased values are observed in: chronic bacterial and viral inflammatory diseases; chronification of acute inflammatory processes; congenital defects of the phagocytic system; Chediak-Higashi syndrome; Down syndrome; systemic lupus erythematosus (SLE); collagenoses; immune complex diseases; immunoglobulin and complement deficiencies; treatment with cytostatics, immunosuppressants, or ionizing radiation; secondary and primary immunodeficiencies; malignant neoplasms; severe burns, trauma, and stress; phagocytic insufficiency.
The induced NBT test evaluates the functional reserve of the oxygen-dependent bactericidal mechanism of phagocytes. The test is used to identify the reserve capacity of intracellular phagocyte systems. With preserved intracellular antibacterial activity, the number of formazan-positive neutrophils increases dramatically after latex stimulation. A decrease in stimulated NBT test values below 40% for neutrophils and below 87% for monocytes indicates phagocytic insufficiency. The normal range for the stimulated NBT test is 20–40%.
Determination of IgA, IgM, and IgG IMMUNOGLOBULINS by enzyme-linked immunosorbent assay (ELISA). Principle of the method: The assay is based on the detection of immunoglobulins A, M, and G in blood serum using specific antiglobulin conjugates (anti-A, anti-M, anti-G). Unbound components are washed away, and the enzyme activity within the immune complexes is determined using a substrate-chromogen mixture. The intensity of chromogen coloration is inversely proportional to The amount of Antibodies in the sample.
Kit contents: 1. Polystyrene microplate with immobilized antigen (strips 1–4 – IgA, 5–8 – IgM, 9–12 – IgG) (1 pc.); 2. Phosphate-buffered saline (PBS), 30 mL (1 vial); 3. Standard sample, 30 µL (1 pkg.); 4. Peroxidase-labeled conjugates (anti-A, anti-M, anti-G) (1 kit); 5. Citrate-phosphate buffer, 1.5 mL (1 vial); 6. Substrate solution, 1.5 mL (1 vial); 7. Stop solution, 11 mL (1 vial).
Test material. Use fresh serum free from impurities. Store samples for no more than 72 hours at +2 – (+10)°C. Long-term storage is permissible in a frozen state at minus 20°C. Repeated freezing and thawing cycles are not recommended. The Use of hemolyzed and lipemic samples is discouraged.
Reagent preparation
1. Prior to testing, bring the kit to room temperature for 30 minutes.
2. Prepare the required amount of PBS solution by diluting the concentrate 1:10 with distilled water. If salt precipitates in the concentrate, warm it at 30–40°C until the precipitate dissolves completely. The prepared solution is used for diluting sera and conjugates, as well as for washing plates. The resulting solution is stable for 2 days at room temperature or 10 days in a refrigerator (+2 – (+10)°C).
3. Preparation of standard and test samples: prior to testing, dilute the standard and sera 1:200 with PBS (5 µL in 1 mL).
4. Preparation of working conjugate solutions: anti-A-HRP – dilute 20 µL of conjugate in 5 mL of PBS; anti-M-HRP – dissolve 100 µL of conjugate in 5 mL of PBS; anti-G-HRP – dilute 50 µL of conjugate in 5 mL of PBS (HRP – horseradish peroxidase).
If the assay is performed on only a portion of the microplate, reduce the volume of the conjugate solution proportionally. Prepare the working conjugate solution immediately before use!
5. Preparation of the substrate mixture: add 1 mL of citrate-phosphate buffer and 1 mL of substrate solution to 9 mL of distilled water. If the assay is performed on only a portion of the microplate, reduce the volume of the substrate mixture proportionally. Prepare the working substrate mixture immediately before use!
Assay procedure:
1. Add 100 µL of PBS solution (blank), standard sample, and test samples to the wells in duplicate.
2. Add 100 µL of the respective conjugates to each well.
3. Incubate the strips for 60 min at room temperature with occasional shaking or on a shaker.
4. Wash the microplate 4–5 times with PBS, adding 250 µL of the solution to each well.
5. Add 100 µL of the substrate solution to each well.
6. Incubate in the dark for 15–20 minutes, depending on the intensity of color development.
7. Add 100 µL of the stop solution to each well.
8. Measure the optical density using an EIA analyzer at a wavelength of 450 nm no later than 5 minutes later.
Evaluation of the test results. Measure the optical density (OD) in all wells and perform calculations using the inverse proportionality formula:
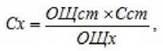
where ODst is the optical density of the standard sample, Cst is the immunoglobulin concentration in it, ODx is the optical density of the test sample, and Cx is the immunoglobulin concentration in the test sample.
Immunoglobulin content in the standard sample: IgA - 2.31 g/L, IgM - 1.29 g/L, IgG - 11.49 g/L.
The expected OD fluctuations of the standard sample should be at least 0.3 optical units (OU) for IgA, at least 0.3 OU for IgM, and at least 0.3 OU for IgG.
Normal ranges. Based on laboratory research findings, we recommend using the reference ranges provided below. Normal immunoglobulin concentrations are as follows:
IgA - 1.25 - 2.5 g/L, IgM - 0.65 - 2 g/L, IgG - 7.5 - 18 g/L.
Safety requirements: 1. The kit is intended for In vitro Diagnostics only. Mouth pipetting is strictly prohibited. 2. Personal protective equipment when working with the kits includes gauze masks and rubber gloves. Serum disinfection must be carried out in accordance with USSR Ministry of Health Order No. 408 dated December 29, 1989, "On measures to reduce the incidence of Viral Hepatitis in the country."
Transportation and storage conditions: 1. The kits are transported by all types of covered transport at temperatures ranging from +2 to +10 °C. Transportation at temperatures up to +37 °C for no more than 72 hours is permitted. 2. The kits must be stored at temperatures ranging from +2 to +10 °C. Freezing is not allowed!
The shelf life is 6 months from the date of manufacture of the kit. Upon expiration of the shelf life, the kits are subject to re-inspection for quality control.
The shelf life of the strips after opening the pouch is 1 month at a temperature of +2 - (+10) °C. Store unused strips in a tightly sealed pouch. Bring the kit to room temperature for 30 minutes before running the assay.
Quantitative determination of immunoglobulins by Mancini radial immunodiffusion. Principle of the method. The determination of IgA, IgM, and IgG by radial immunodiffusion in agarose gel according to Mancini et al. is based on placing test serum samples into wells in Agar containing antibodies against one of the immunoglobulin classes (IgA, IgM, IgG) at a known concentration. As immunoglobulins diffuse from the wells into the agar, they react with the corresponding antibodies to form precipitation rings, the size of which strictly depends on the concentration of the respective immunoglobulin class in the subject's serum.
Materials and equipment: 1. Glass plates 9x12 cm. 2. U-shaped frame 120x90x8 mm to facilitate pouring agar onto glass. 3. Water bath at 50-60 °C. 4. Pasteur pipettes with drawn-out tips. 5. Moist chamber. 6. Measuring device. 7. Calibration ruler. 8. Commercial kits for determining immunoglobulin concentrations. 9. 0.2 M veronal buffer. 10. Precipitate staining reagent. 11. Round punch with a diameter of 1.5-2.0 mm for cutting wells in the agarose gel.
Procedure description. Preparation of veronal buffer: dissolve 1.84 g of veronal and 0.34 g of sodium hydroxide in 200 mL of distilled water.
Preparation of Agarose gel: add 3.6 g of agarose from the serum immunoglobulin determination kit to 200 mL of veronal buffer preheated to 50-60 °C, then boil for 10-15 minutes in a water bath until the agar is completely melted and a clear gel is obtained. Filter the molten agar through cotton wool and pour 21 mL into preheated glass cylinders, stopper them, and place them in a water bath at 56-58 °C. Dilute an ampoule of monospecific antiserum with a working titer of 1:20-1:30 in 1 mL of veronal buffer, pour it into the corresponding cylinder, mix, and keep in the water bath for 10-15 minutes.
Wipe 9x12 cm glass plates with ether and place a boundary frame on the glass (if no frame is available, the edges can be treated with paraffin). Heat the plates prepared in this manner and place them on a strictly horizontal surface. Quickly pour the molten agar containing the monospecific antiserum from the cylinder onto the center of the plate. Using a glass rod, quickly and evenly distribute the gel over the entire surface of the glass, carefully removing any air bubbles. Leave the gel-coated plate on a horizontal surface until the agar completely solidifies.
Cut wells in the gel using a round punch along a template. The distance from the edge of the glass to the wells and between the wells must be at least 10 mm. Up to 48 wells can be placed on a single 9x12 cm glass plate. Remove the agar from the wells using a Pasteur pipette connected to a vacuum or water-jet pump. If necessary, the prepared plates can be stored in a moist chamber at a temperature of 4 °C.
Using a Pasteur pipette with a finely drawn-out tip, add the test serum into the wells until the concave meniscus disappears. Each serum sample is added to agar wells containing the respective monospecific antiserum. Undiluted and 2-, 4-, and 8-fold dilutions of standard (reference) serum with a known content of immunoglobulins of all classes are added to 4 wells of the agarose plate. An ampoule of standard serum is included in each kit of monospecific antisera. After adding the test sera, place the plates in a moist chamber, such as a desiccator with water poured at the bottom or another suitable container with a lid, and incubate for 24 hours (for IgA and IgG determination) or 48 hours (for IgM and IgD determination).
After incubation, remove the plates from the moist chamber and stain with an appropriate dye: bromophenol blue (stain composition: 0.5 g bromophenol blue, 10 mL of 4% aqueous lead acetate solution, 20 mL glacial acetic acid, distilled water up to 1 L), or amido black 10B (stain composition: 1% amido black in a 7% aqueous acetic acid solution).
Results evaluation. To evaluate the reaction results, measure the diameter of the precipitation rings formed around the wells. Then, plot the ring diameters of the standard serum on the abscissa (x-axis) of semilogarithmic paper, and the known concentration of each immunoglobulin class in g/L on the ordinate (y-axis) to construct a calibration curve, which is used to calculate the immunoglobulin content in each test serum.
Normally, serum contains 0.65-1.65 g/L of IgM; 7.50-15.45 g/L of IgG; 1.25-2.5 g/L of IgA. Tables 13 and 14 show the reference ranges for this method.
Table 13. Normal serum immunoglobulin concentrations in healthy adults
Immunoglobulin |
Concentration range |
IgG, g/L |
8-20 |
IgA, g/L |
0.9-4.5 |
IgM, g/L |
0.6-2.5 |
Table 14. Serum immunoglobulin concentrations in children under 14 years of age
Age |
IgG, g/L |
IgA, g/L |
IgM, g/L |
Neonates |
7.5-15.0 |
<0.06 |
0.11-0.35 |
1-3 months |
2.7-7.8 |
0.06-0;58 |
0.12-0.87 |
4-6 months |
1.9-8.6 |
0.1-0.96 |
0.25-1.2 |
7-12 months |
3.5-11.8 |
0.36-1.65 |
0.36-1.04 |
1-2 years |
5.2-10.8 |
0.36-1.65 |
0.72-1.6 |
3-6 years |
6.5-14.1 |
0.83-2.17 |
0.55-2.1 |
7-9 years |
7.6-13.3 |
1.08-2.0 |
0.55-1.6 |
9-13 years |
7.7-15.1 |
1.08-3.25 |
0.7-1.5 |
Clinical significance. Immunoglobulins are secretory products of terminally differentiated B cells, namely plasma cells. Serum Ig levels reflect the functional state of the humoral branch of The Immune System in response to antigenic stimulation. Elevated levels are characteristic of acute and chronic inflammatory processes, autoimmune diseases, etc. Defects associated with impaired immunoglobulin metabolism are observed in numerous pathologies. Decreased immunoglobulin levels indicate humoral immunodeficiency, impaired synthesis, enhanced Catabolism, or adsorption onto immune complexes.
Elevated IgA levels are observed in: acute and chronic bacterial, fungal, and parasitic infections, chronic liver diseases, cirrhosis, rheumatoid Arthritis, systemic lupus erythematosus (SLE), chronic Lymphocytic Leukemia, multiple myeloma, monoclonal gammopathy, Waldenström's macroglobulinemia, endothelioma, osteosarcoma, candidiasis, cystic fibrosis, and respiratory tract diseases.
Decreased IgA levels are observed in: physiological hypogammaglobulinemia in infants (at 3-5 months of age), congenital hypogammaglobulinemia or agammaglobulinemia, neoplasms of the immune system, treatment with cytostatics and immunosuppressants, post-splenectomy states, protein-losing enteropathy and nephropathy syndromes, as well as acute viral and chronic bacterial infections.
Elevated IgM levels are observed in: acute and chronic bacterial, fungal, and parasitic infections, acute viral hepatitis, cirrhosis, rheumatoid arthritis, SLE, acute and chronic lymphocytic leukemia, multiple myeloma, Waldenström's macroglobulinemia, endothelioma, osteosarcoma, candidiasis, cystic fibrosis, and respiratory tract diseases.
Decreased IgM levels are observed in: physiological hypogammaglobulinemia in infants (at 3-5 months of age), congenital hypogammaglobulinemia or agammaglobulinemia, neoplasms of the immune system, treatment with cytostatics and immunosuppressants, ionizing radiation exposure, post-splenectomy states, protein-losing enteropathy and nephropathy syndromes, chronic viral infection, and humoral immunodeficiency.
Elevated IgG levels are observed in: acute and chronic bacterial, fungal, and parasitic infections, acute and chronic liver diseases, cirrhosis, viral hepatitis, autoimmune diseases, rheumatoid arthritis, SLE, sarcoidosis, cystic fibrosis, chronic lymphocytic leukemia, multiple myeloma, infectious mononucleosis, monoclonal gammopathy, Waldenström's macroglobulinemia, convalescence from a primary bacterial infection, acute phase of a reinfection, and AIDS.
Decreased IgG levels are observed in: physiological hypogammaglobulinemia in infants (at 3-5 months of age), congenital hypogammaglobulinemia or agammaglobulinemia, neoplasms of the immune system, treatment with cytostatics and immunosuppressants, post-splenectomy states, protein-losing enteropathy and nephropathy syndromes, chronic viral infection, and hemoglobinopathies.
Determination of total serum IgE by enzyme-linked immunosorbent assay (ELISA). Assay principle. The test kit employs a double-site (sandwich) ELISA principle. The test sample is added to the wells of a microplate coated with specific anti-IgE epsilon antibodies. The antigen in the sample binds to the antibodies on the well surface. Unbound material is removed by washing. Peroxidase-labeled antibodies against a different IgE epitope are then added to the wells. After a subsequent wash step, the enzymatic activity bound to the microplate surface is developed and measured
by adding the chromogen-substrate solution and stop solution, followed by photometry at 450 nm. The intensity of the color reaction is directly proportional to the amount of antigen in the sample.
Kit contents: 1. Total IgE ELISA strips, 8x12 wells (1 pc.); 2. Blue ELISA buffer, 6 mL (1 vial); 3. Set of calibrators and controls, 0.5 mL each (calibrator concentrations: 0, 50, 200, 500, 1000 IU/mL; plus 1 control sample); 4. Wash buffer concentrate, 22 mL (1 vial); conjugate, 11 mL (1 vial); 5. Substrate solution, 11 mL (1 vial); 6. Stop solution, 11 mL (1 vial).
Important notes on reagent storage and assay procedure:
1. Do not mix or use Reagents from different lots in the same assay run.
2. Immediately close the cap of each vial or tube after use. Caution: use the original cap for each vial.
3. All kit components must be stored in a refrigerator (+2 to +10 °C). Do not freeze the kit.
4. After opening the pouch, carefully reseal the remaining wells with the adhesive plate sealer to protect them from moisture during storage.
5. Cover the microplate with adhesive tape during all incubation steps. Do not allow the microplate wells to dry out between assay steps.
6. All samples and standards should preferably be run in duplicate (in parallel).
7. Test sera must be thoroughly centrifuged. Do not use turbid, lipemic, or hemolyzed samples.
8. If the assay is not performed on the day of blood collection, the serum should be stored at -20 °C. Repeated freeze-thaw cycles are not permitted.
9. Microplate washing can be performed either manually or using automated devices. Add 250 µL of washing solution to each well during every wash cycle. A washing delay ("soaking") is not required. Upon completing manual washing, sharply invert the microplate onto absorbent paper to remove any residual buffer.
10. Measure the optical density within no more than 15 minutes after stopping the substrate reaction.
Reagent Preparation
1. All reagents, including the required number of strips, must be brought to room temperature (+20–(+25) °C) before use.
2. Prepare the washing solution: dilute the concentrate with a 10-fold volume of distilled water in a clean container. The resulting solution is stable for 5 days at room temperature or 30 days in a refrigerator (+2–(+10) °C).
Assay Procedure:
1. Place the required number of strips into the holder — samples in duplicate and 12 wells for calibrators and controls.
2. Add 50 µL of blue EIA buffer to the wells.
3. Add 50 µL of calibrator or test sample to the wells.
4. Incubate for 30 minutes at 37 °C.
5. Wash the strips 3 times with the washing solution.
6. Add 100 µL of conjugate solution to the wells.
7. Incubate for 30 minutes at 37 °C.
8. Wash the strips 5 times with the washing solution.
9. Add 100 µL of substrate solution to the wells.
10. Incubate for 15 minutes at 20-25 °C.
11. Add 100 µL of stop solution to the wells.
12. Determine the optical density in the wells using a photometer at a wavelength of 450 nm. Set the photometer blank against the zero calibrator.
Reference ranges: Based on studies conducted by laboratories, we recommend using the reference values provided below (Table 15). However, in accordance with GLP (Good Laboratory Practice) guidelines, each laboratory should establish its own reference parameters specific to the population being tested.
Table 15. Serum total IgE reference values by age
Sex, Age |
Units, IU/mL |
Alternative units, pg/mL |
||
Lower limit |
Upper limit |
Lower limit |
Upper limit |
|
< 6 months |
12.0 |
25.8 |
||
6-12 months |
30.0 |
64.5 |
||
1-3 years |
45.0 |
96.8 |
||
4-6 years |
70.0 |
150.5 |
||
7-9 years |
90.0 |
193.5 |
||
10-15 years |
120.0 |
258.0 |
||
>15 years |
15.0 |
130.0 |
32.3 |
279.5 |
Conversion to alternative units: 1 IU/mL = 2.15 pg/mL
Example of a calibration curve (X-axis - conc. IU/mL; Y-axis - OD) (Fig. 5).
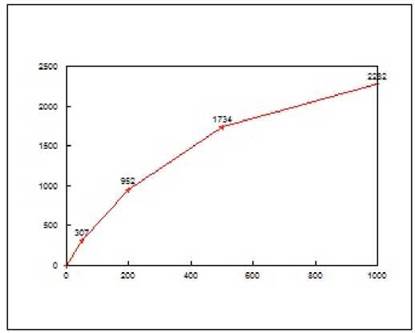
Fig. 5. Calibration curve for the measurement of serum total IgE levels.
Note: X-axis – concentration of MO/ml; Y-axis – OD.
Expected control sample range: 97 - 125 IU/ml.
Safety requirements: see above.
Transportation conditions: see above.
Manufacturer's guarantees: see above.
Clinical significance. The primary Biological Role of IgE is its ability to bind to The surface of human mast cells and basophils. IgE is involved in type I (immediate) hypersensitivity reactions and protective anti-helminth Immunity, which is mediated by cross-linking between IgE and helminth antigens. The latter penetrates the mucosal membrane and attaches to mast cells, triggering their degranulation. Inflammatory mediators increase capillary and mucosal permeability, causing IgE and leukocytes to exit the bloodstream. Eosinophils attach to the IgE-coated helminths, release the contents of their granules, and thereby destroy the parasites. Indications for total IgE testing: atopic diseases, allergic rhinitis, atopic Bronchial Asthma, atopic dermatitis, allergic gastroenteropathy, anaphylactic disorders, systemic anaphylaxis, urticaria - angioedema, allergic bronchopulmonary aspergillosis, helminthiasis, hyper-IgE syndrome (Job's syndrome), selective IgE deficiency, thymic aplasia (DiGeorge syndrome), IgE myeloma, graft-versus-host disease, etc.
Determination of circulating immune complexes (CIC) levels in blood serum. Autosensitization processes are accompanied by the accumulation of circulating immune complexes (CIC); therefore, assessing their concentration is an essential step in evaluating immune status.
Materials and equipment: 1. Blood serum (test sample). 2. Borate buffer. 3. Polyethylene glycol (MW 6000). 4. Test tubes. 5. High-speed centrifuge type T-24. 6. Spectrophotometer.
Method description. Preparation of 0.1 M borate buffer: mix 3.410 g of boric acid and 4.275 g of sodium tetraborate, transfer to a volumetric flask, and bring to 1 L with distilled water, pH 8.4.
Mix 200 µl of blood serum with 5 ml of 0.1 M borate buffer. Add 4 ml of this mixture to 4 ml of a 7% polyethylene glycol solution prepared in 0.1 M borate buffer. Incubate the sample for 18–20 hours at +4 °C. Following incubation, centrifuge the mixture at 2000 rpm for 10 minutes. Discard the supernatant, wash the pellet twice with a 7% polyethylene glycol solution in 0.1 M borate buffer, and dissolve it in 5 ml of 0.1 N sodium hydroxide solution.
Evaluation of results. The level of circulating immune complexes is determined using a spectrophotometer at a wavelength of 280 nm and expressed in optical density units.
Since many laboratories are currently equipped with strip photometers, this assay can be performed using a micromethod. For this purpose, dilute the test serum 3-fold with borate buffer. Perform the serum dilution as follows: add 0.05 ml of blood serum and 0.1 ml of buffer to a well of an immunological assay microplate. In parallel wells of a second microplate, add 0.25 ml of buffer to the first well and 0.25 ml of polyethylene glycol solution to the second. Then, add 0.05 ml of the diluted serum from the first microplate to both wells of the second microplate. Incubate the plate for 1 hour at room temperature. Measure the extinction using a vertical photometer with a 450 nm light filter. Calculate the difference between the absorbance values of the serum sample with polyethylene glycol and the serum with buffer, and multiply by 100, which yields the CIC value expressed in optical density units.
The normal range of CIC content in serum is 30–90 IU/ml.
Clinical significance. CIC are complexes consisting of an antigen, antibodies, and associated complement components C3, C4, and C1q. Normally, immune complexes formed in the bloodstream are phagocytosed and degraded by both phagocytes and the liver. However, when they increase in size (due to antigen excess and the presence of IgM or the C1q complement component in their Structure), the complexes may deposit in the perivascular space and the renal cortex, triggering complement activation and inflammatory processes. Pathological reactions to immune complexes can be caused by an elevated rate of their formation over elimination, a deficiency of one or more complement components, or functional defects in the phagocytic system. Determining the level of immune complexes in blood serum is crucial in diagnosing acute inflammatory processes and type III hypersensitivity reactions (where CIC levels are elevated), as well as in evaluating treatment efficacy. Elevated blood CIC levels are characteristic of:
- acute bacterial, fungal, parasitic, and viral infections;
- autoimmune diseases, collagenoses, rheumatism, glomerulonephritis, allergic alveolitis, vasculitis, Arthus phenomenon;
- immune complex diseases, serum sickness;
- type III allergic reactions.
Determination of complement hemolytic activity. A standardized METHOD FOR DETERMINING complement hemolytic activity based on 50% hemolysis.
Principle of the method. The activity of The Complement System refers to the hemolytic capacity of human blood serum to lyse animal erythrocytes. Complement present in the test serum induces lysis of sensitized sheep erythrocytes in the presence of rabbit serum immunized with sheep red Blood Cells (hemolytic serum).
Complement activity is expressed in hemolytic units. One 50% hemolytic unit of complement (CH50) is defined as the amount that causes 50% hemolysis of 0.5 ml of a standard suspension of sensitized sheep erythrocytes at 37 °C for 45 minutes.
Initially, complement hemolytic activity was determined by the minimum amount of serum capable of inducing 100% lysis of a specific number of sheep erythrocytes. However, studying the lytic activity of complement as a function of its concentration revealed a sigmoidal correlation curve, with complete hemolysis occurring across a wide plateau at the upper end of the curve. Therefore, complement hemolytic activity is expressed in CH50 units—a measure of the total functional activity of the early (C1, C4, C2) and terminal (C3–C9) components of the classical complement pathway.
The normal range for 1CH50 is 50–70 CH50/ml.
Reagents: 1. Hemolytic serum (hemolysins). Standardized commercial batches are supplied in ampoules with the hemolytic titer indicated on the label. Such sera have a long shelf life when stored at 2–8 °C. 2. Sheep erythrocytes. 3. Veronal-medinal buffer. Buffer composition (in grams): 85 NaCl, 5.75 veronal, 3.75 medinal, 0.22 CaCl2·2H2O, 1 MgCl2·6H2O, pH 7.3–7.8 (dissolve 5.75 g of veronal in 500 ml of hot distilled water, cool the mixture to +20 °C, add the remaining components, and bring to a final volume of 2 L with distilled water. Store the buffer at 3–5 °C).
Procedure
Preparatory stage:
1. Preparation of the buffer: on the day of the procedure, add 1 part of the buffer solution to 4 parts of distilled water. The diluted buffer solution is stable for 12 hours.
2. Processing of the patient's test serum: 2–3 ml of venous blood taken from the patient is left at room temperature for 2 hours, then centrifuged for 10–15 min at 1500 rpm. The serum is carefully separated and the assay is performed on the same day.
Preparation of the hemolytic system. The hemolytic system is a mixture of equal volumes of hemolytic serum diluted to a triple titer and a 3% suspension of sheep red blood cells relative to the packed cell volume (100 ml of 3% suspension and 100 ml of diluted hemolytic serum: 0.1 ml of hemolytic serum and 99.9 ml of isotonic sodium chloride solution).
Preparation of the 3% sheep red blood cell suspension: defibrinated sheep blood is washed 3 times with 5–10-fold volumes of isotonic sodium chloride solution, which should be colorless after the third wash of the erythrocyte suspension. A 3% (v/v) suspension of sheep red blood cells in saline is prepared from the packed red blood cell pellet.
Standardization of the sheep red blood cell suspension. The sheep red blood cell suspension is standardized by photocolorimetry. A green light filter is used for photocolorimetry. 1 ml of the 3% washed sheep red blood cell suspension is added to a test tube containing 9 ml of distilled water; the resulting lysed blood is poured into a 10-ml cuvette, while a solution (a mixture of 1 ml of isotonic solution and 9 ml of distilled water) is poured into two other cuvettes (of the same volume).
The cuvette with the blank solution is placed in the left cuvette holder, and the cuvette with the lysed blood is placed in the right one. A specific sheep red blood cell concentration corresponds to a specific optical density value on the scale. If the 3% sheep red blood cell suspension is prepared correctly, the optical density scale of the erythrocyte lysate reads 0.4.
If the optical density value is less than 0.4, the appropriate amount of erythrocytes determined from the graph should be added to the prepared sheep red blood cell suspension. If the optical density value is higher than 0.4, the appropriate amount of isotonic sodium chloride solution should be added to the prepared sheep red blood cell suspension (Fig. 6).
After preparing the 3% sheep red blood cell suspension, the hemolytic serum is prepared.
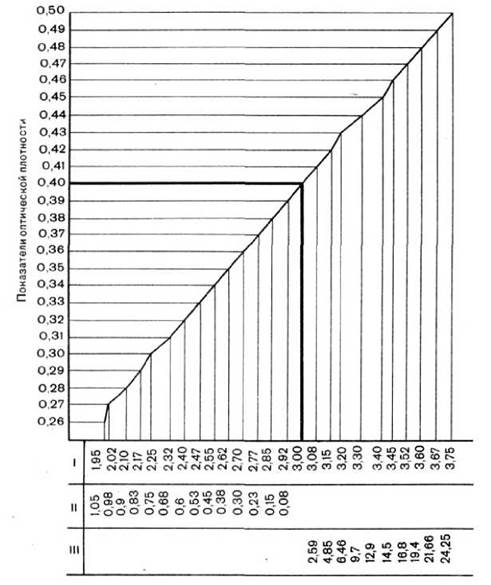
Fig. 6. Standardization curve of the sheep red blood cell suspension based on photocolorimeter data [30].
Note: Cuvette 10 ml. Green light filter. I - sheep red blood cell suspension (%), II - sheep red blood cells (ml) to be added to 100 ml of suspension to obtain a 3% suspension, III - isotonic sodium chloride solution (ml) to be added to 100 ml of suspension to obtain a 3% suspension.
Dilution of the hemolytic serum. Before the assay, the ampoule is opened, and the lyophilized preparation inside is diluted with sterile isotonic sodium chloride solution According to the instructions. The hemolytic serum is taken at a dilution 3 times exceeding its initial concentration. Thus, if the titer of the hemolytic serum is 1:1200, a 1:400 dilution is prepared. Based on the volume of the hemolytic system required to perform the reaction, the necessary amount of hemolytic serum is measured out.
Afterwards, the ampoule is sealed, and the remainder of the hemolytic serum is stored for the next assay in a refrigerator at 4–8 °C. Only after preparing the 3% sheep red blood cell suspension and diluting the hemolytic serum according to its titer can one proceed to prepare the hemolytic system.
Sensitization of sheep red blood cells. An equal volume of diluted hemolytic serum containing 4 hemolytic units (hemolytic serum dilution 1:400) is added to 1 volume of the sheep red blood cell suspension. Mixing the hemolytic serum (0.1 ml and 99.9 ml of isotonic sodium chloride solution) with the sheep red blood cells is performed rapidly, with the hemolytic serum added to the erythrocyte suspension rather than vice versa. The mixture is incubated at 37 °C in a thermostat for 30 min to sensitize the erythrocytes. During incubation, the mixture is shaken several times. Sensitized erythrocytes must be used on the same day and are stored at 4 °C until use. Sensitized sheep red blood cells are referred to as the hemolytic system, which is used for complement titration in test tubes.
Complement titration. The test serum, diluted 1:10 with buffer solution, is dispensed into 2 test tubes: 0.1 and 0.25 ml. The dispensed serum (1:10) is brought to a volume of 1.5 ml with veronal-medinal buffer. Then, 1.5 ml of the standardized hemolytic system is added to each test tube.
Simultaneously with the test tubes, a control for the absence of hemolysis of sensitized erythrocytes is set up: 1.5 ml of the hemolytic system and 1.5 ml of veronal-medinal buffer. The test tubes are shaken and placed in a thermostat at 37 °C for 45 min. After incubation, they are cooled at 2–4 °C for 18–19 hours. The next day, photocolorimetry of the supernatant from each test tube is performed (against an isotonic sodium chloride solution or distilled water in the control cuvette). To account for the degree of hemolysis, the scale of standard dilutions of lysed erythrocytes according to A. P. Konnikov must be used, which is prepared for each batch of erythrocytes and hemolytic serum (Table 16).
Table 16. Scale of standard dilutions of lysed erythrocytes according to A. P. Konnikov
Erythrocyte dilution |
Tube No. |
|||||
1 |
2 |
3 |
4 |
5 |
6 |
|
Hemolytic system diluted 1:1, ml |
0.2 |
0.3 |
0.4 |
0.5 |
0.6 |
0.7 |
Distilled water, ml |
0.8 |
0.7 |
0.6 |
0.5 |
0.4 |
0.3 |
Hemolysis, % |
20 |
30 |
40 |
50 |
60 |
70 |
To calculate the 50% hemolysis unit, a calibration curve is constructed. The optical density of test tube No. 4 from Konnikov's scale, which corresponds to 50% hemolysis, serves as the control. The optical density value measured by photocolorimetry for both the control and the test material is plotted on the ordinate axis, and a horizontal line parallel to the abscissa axis is drawn to intersect with the perpendiculars erected on the abscissa axis at points corresponding to 0.1 and 0.25 serum dilutions.
Example: test tube No. 4 from Konnikov's scale, representing 50% hemolysis, corresponds to the photoelectrocolorimeter readings. Assay results: photocolorimetry of the first tube containing 0.1 ml of serum shows 0.07; the second tube containing 0.25 ml shows 0.12. These two points are connected, and the connecting line is extended to intersect with the 50% hemolysis line. A perpendicular is dropped from the intersection point to the abscissa line, where the serum dilution readings are marked (e.g., 0.25).
Calculations are performed using the formula: 0.25 ml (1:10)
CH50 = 1 ml:x, where X = 1/0.25 = 100/25 = 4 CH50
Due to the fact that 0.25 ml is the test serum diluted 1:10, the result must be multiplied by 10, i.e., 1 ml of the test serum will contain 40 CH50. Sera of healthy Donors typically contain 20–40 hemolytic units of complement. The complement level in women is lower than in men by about 10%.
Clinical significance. In clinical practice, disorders are encountered with both decreased and increased serum complement activity (Table 17).
Table 17. Diseases characterized by altered complement levels
Decreased |
Increased |
SLE with renal involvement |
Obstructive jaundice |
Acute glomerulonephritis |
Hashimoto's thyroiditis |
Serum sickness |
Acute rheumatic fever |
Immune complex diseases |
Rheumatoid arthritis |
Liver cirrhosis |
Polyarteritis nodosa |
Combined immunodeficiencies |
Dermatomyositis |
Infective endocarditis |
Acute myocardial infarction |
Recurrent angioedema |
Typhoid fever |
Paroxysmal cold hemoglobinuria |
Type 1 diabetes |
Myasthenia gravis |
|
Viral hepatitis with articular involvement |
|
Mixed cryoglobulinemia |
|
Lymphoma |
|
Total complement levels are elevated in: obstructive jaundice, Hashimoto's thyroiditis, acute rheumatic fever, polyarteritis nodosa, dermatomyositis, acute myocardial infarction, ulcerative colitis, typhoid fever, type 1 Diabetes Mellitus, Reiter's syndrome, and gout.
Total complement levels are decreased in: SLE with renal involvement, acute glomerulonephritis, serum sickness, immune complex diseases, liver cirrhosis, combined immunodeficiencies, infective endocarditis with glomerulonephritis, recurrent angioedema, paroxysmal cold hemoglobinuria, myasthenia gravis, viral hepatitis with articular involvement, mixed cryoglobulinemia, and lymphoma.
In addition to total hemolytic complement activity, the concentration of individual complement components (most commonly C3 and C4) is determined using radial immunodiffusion according to Mancini. Determining C3 and C4 makes it possible to identify the predominant pathway of complement activation. C4 is consumed only upon activation via the classical pathway. C3 participates in both the classical and alternative activation pathways, although its levels drop more significantly during alternative pathway activation.
Last update: 13/08/2026
Editorial and Educational Adaptation: This material has been compiled based on the primary/original source text. The project team performed an editorial review, corrected technical inaccuracies, structured sections, and adapted the content for an educational format.
What was processed:
- elimination of formatting defects (OCR errors, structural breaks, corrupted characters);
- editorial organization of content;
- standardization of terminology in accordance with academic sources;
- verification of factual statements against the original source text.
All mentions of the author, publication year, and origin of the primary text have been preserved in accordance with the source.