Human Anatomy and Physiology - N. I. Fedyukovich 2003
Cardiovascular System
Physiology of the Cardiovascular and Lymphatic Systems
Physiological properties of The cardiac Muscle. The Main characteristics of the cardiac muscle include automaticity, excitability, conductivity, contractility, and refractoriness.
Cardiac automaticity is the ability of the myocardium to contract rhythmically under METABOLISM/18.html">The Influence of impulses generated within the organ itself.
Cardiac Striated Muscle tissue consists of typical contractile muscle Cells—cardiomyocytes—and atypical cardiac myocytes (pacemakers) that form the cardiac conduction system. This system ensures the automaticity of heart contractions and coordinates the contractile function of the atrial and ventricular myocardium. The first, the sinoatrial node of the conduction system, is the primary center of cardiac automaticity—the first-order pacemaker. From this node, excitation spreads to the working myocardial Cells of the atria and, via specialized intracardiac conduction pathways, reaches the second node—the atrioventricular (AV) node, which is also capable of generating impulses. This node acts as the second-order pacemaker. Under normal conditions, excitation can only pass through the atrioventricular node in one direction. Retrograde conduction of impulses is impossible.
The third level that ensures the rhythmic activity of The Heart is located in the bundle of His and Purkinje fibers.
The centers of automaticity located in the ventricular conduction system are called third-order pacemakers. Under normal conditions, The rate of myocardial activity of the entire heart is determined by the sinoatrial node. It dominates all downstream structures of the conduction system, imposing its own rhythm.
Anatomical integrity of the conduction system is a prerequisite for proper heart function. If excitation does not arise in the first-order pacemaker or its transmission is blocked, the second-order pacemaker takes over The Role of the pacemaker. If the transmission of excitation to the ventricles is impossible, they begin to contract at the rhythm of the third-order pacemakers. In the event of a complete heart block, the atria and ventricles contract each at their own rhythm, while damage to the pacemakers leads to complete cardiac arrest.
Excitability of the cardiac muscle is The ability to enter a state of excitation under the influence of electrical, chemical, thermal, and other stimuli. This phenomenon is based on a negative electrical potential in the initially excited area. As in any excitable tissue, the membrane of working cardiac cells is polarized. It is positively charged on the outside and negatively charged on the inside. This state results from different concentrations of Na+ and К+ on both sides of the membrane, as well as different membrane permeability to these ions. At rest, Na+ ions do not penetrate the cardiomyocyte membrane, while К+ ions penetrate only partially. Due to diffusion, К+ ions leaving The Cell increase the positive charge on its surface. The inner side of the membrane then becomes negative. Under the influence of a stimulus of any nature, Na+ enters the cell. At this moment, a negative electrical charge arises on the membrane surface, and potential reversal develops. The Action Potential amplitude for cardiac muscle fibers is about 100 mV or more. The resulting potential depolarizes the membranes of neighboring cells, generating their own action potentials, which propagates the excitation through the myocardial cells.
The action potential of a working myocardial cell is many times longer than that of a Skeletal Muscle. During The Development of the action potential, the cell does not respond to subsequent stimuli. This feature is crucial for the function of the heart as an organ, as the myocardium can respond with only one action potential and one contraction to repeated stimulation. All of this creates the conditions for the rhythmic contraction of the organ.
Thus, excitation propagates throughout the entire organ. This process is identical in the working myocardium and in the pacemakers. The ability to excite the heart with an electric current has found Structure/182.html">Practical Application in medicine. Under the influence of electrical impulses from pacemakers, the heart begins to excite and contract at a set rhythm. When applying electrical stimuli, regardless of their magnitude and strength, the beating heart will not respond if the stimulus is applied during systole, which corresponds to the absolute refractory period. During diastole, however, the heart responds with a new, premature contraction—an extrasystole, followed by a prolonged pause known as the compensatory pause.
Conductivity of the cardiac muscle means that waves of excitation travel through its fibers at different velocities. Excitation propagates through the atrial muscle fibers at a speed of 0.8–1.0 m/s, through the ventricular muscle fibers at 0.8–0.9 m/s, and through the specialized cardiac tissue at 2.0–4.2 m/s. In skeletal muscle fibers, excitation propagates at a speed of 4.7–5.0 m/s.
Contractility of the cardiac muscle has its own characteristics due to the organ's structure. The atrial Muscles contract first, followed by the papillary muscles and the subendocardial layer of the ventricular muscles. Subsequently, the contraction spreads to the inner layer of the ventricles, thereby ensuring the movement of Blood from the ventricular cavities into the aorta and the pulmonary trunk.
Periodic Changes in the contractile force of the heart muscle are mediated by two self-regulatory mechanisms: heterometric and homeometric.
The heterometric mechanism is based on changes in the initial length of myocardial fibers, which occur with alterations in venous return: the more the heart is stretched during diastole, the stronger it contracts during systole (the Frank–Starling law). This law is explained as follows. A cardiac fiber consists of two parts: contractile and elastic. During excitation, the former contracts, while the latter stretches depending on the load.
The homeometric mechanism is based on the direct action of BIOLOGICALLY ACTIVE SUBSTANCES (such as adrenaline) on the metabolism of muscle fibers and their energy production. Adrenaline and noradrenaline increase the influx of Ca+ into the cell during the Development of the action potential, thereby causing stronger cardiac contractions.
Refractoriness of the cardiac muscle is characterized by a sharp decrease in tissue excitability during its activity. A distinction is made between the absolute and relative refractory periods. During the absolute refractory period, the heart will not respond to electrical stimuli with excitation or contraction. The refractory period lasts as long as systole. During the relative refractory period, the excitability of the cardiac muscle gradually returns to its initial level. In this period, the cardiac muscle can respond to a suprathreshold stimulus with a contraction. The relative refractory period occurs during the diastole of the atria and ventricles. After the relative refractory phase, a period of supernormal excitability occurs, which coincides with diastolic relaxation and is characterized by the heart muscle responding with a burst of excitation even to weak impulses.
The cardiac cycle. At rest, the heart of a healthy person contracts rhythmically at a rate of 60–70 beats per minute.
The period that includes one contraction and the subsequent relaxation constitutes the cardiac cycle. A heart rate above 90 beats per minute is called tachycardia, and below 60 is bradycardia. At a heart rate of 70 beats per minute, the complete cardiac cycle lasts 0.8–0.86 s.
Contraction of the cardiac muscle is called systole, and relaxation is diastole. The cardiac cycle has three phases: atrial systole, ventricular systole, and the general pause. The beginning of each cycle is considered to be atrial systole, which lasts 0.1–0.16 s. During systole, pressure increases in the atria, leading to the ejection of blood into the ventricles. At this moment, the ventricles are relaxed, the cusps of the atrioventricular Valves hang down, and blood flows freely from the atria into the ventricles.
After atrial systole ends, ventricular systole begins, lasting 0.3 s. During ventricular systole, the atria are already relaxed. Like the atria, both ventricles—right and left—contract simultaneously.
Ventricular systole begins with the contraction of their fibers, resulting from the Propagation of Excitation through the myocardium. This period is short. At this moment, the pressure in the ventricular cavities does not increase yet. It begins to rise sharply when all fibers are excited, reaching 70–90 mmHg in the left ventricle and 15–20 mmHg in the right. As a result of the increased intraventricular pressure, the atrioventricular valves close rapidly. At this moment, the semilunar valves are also still closed, and the ventricular cavity remains sealed; the volume of blood in it is constant. Excitation of the myocardial muscle fibers leads to an increase in blood pressure within the ventricles and a rise in their tension. The appearance of the apex beat in the fifth left intercostal space is due to the fact that, as myocardial tension increases, the left ventricle assumes a rounded shape and strikes the inner surface of the chest wall.
When the blood pressure in the ventricles exceeds the pressure in the aorta and pulmonary artery, the semilunar valves open, their cusps are pressed against the inner walls, and the ejection period (0.25 s) begins. At the beginning of the ejection period, blood pressure in the ventricular cavities continues to increase, reaching approximately 130 mmHg in the left and 25 mmHg in the right. As a result, blood rapidly flows into the aorta and pulmonary trunk, and the volume of the ventricles quickly decreases. This is the rapid ejection phase. After the semilunar valves open, the ejection of blood from the heart cavity slows down, the contraction of the ventricular myocardium weakens, and the slow ejection phase begins. As the pressure drops, the semilunar valves close, preventing the backflow of blood from the aorta and pulmonary artery, and the ventricular myocardium begins to relax. This is followed by another short period during which the aortic valves are still closed and the atrioventricular valves have not yet opened. When the pressure in the ventricles becomes slightly lower than in the atria, the atrioventricular valves open, and the ventricles fill with blood to be ejected again in the next cycle, marking the onset of diastole of the entire heart. Diastole continues until the next atrial systole. This phase is called the general pause (0.4 s). Then, the cardiac cycle repeats.
ELECTRICAL PHENOMENA IN the heart. The Electrocardiogram. The appearance of electrical potentials in the cardiac muscle is associated with the movement of ions across The cell membrane. Sodium and potassium cations play the primary role in this process. It is known that the concentration of potassium inside the cell is significantly higher than in the extracellular fluid, whereas the concentration of intracellular sodium is much lower than that of extracellular sodium. At rest, the outer surface of the myocardial cell has a positive charge due to the predominance of sodium cations, while the inner surface of the cell membrane has a negative charge due to the predominance of anions (Cl-, HCO-3, etc.) inside the cell. Under these conditions, the cell is polarized. Under the influence of an external electrical impulse, the cell membrane becomes permeable to sodium cations, which move into the cell, carrying their positive charge. The outer surface of this cell region acquires a negative charge due to the predominance of anions there. This process is called depolarization and is associated with the action potential (Fig. 99). Soon, the entire outer surface of the cell acquires a negative charge again, and the inner surface becomes positive. Thus, reverse polarization occurs. If the efflux of potassium from the cell exceeds the influx of sodium into the cell, the outer surface of the membrane gradually regains a positive charge, and the inner surface becomes negative. This process is called repolarization. The aforementioned processes occur during systole. If the entire outer surface regains a positive charge and the inner surface becomes negative, this corresponds to diastole. During diastole, gradual reverse movements of potassium and sodium ions occur, which have little effect on the cell charge, as sodium ions leave the cell and potassium ions enter it simultaneously. These processes balance each other.
Class="center">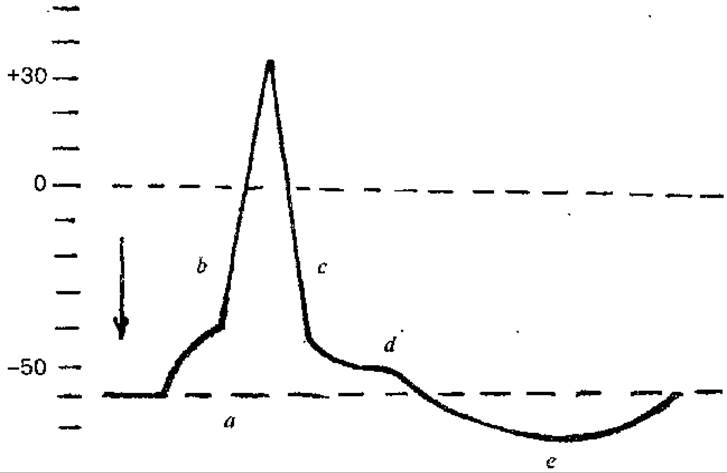
Fig. 99. Schematic of the action potential:
a — local fluctuations of the Membrane Potential; b — ascending phase of the action potential peak (depolarization phase); c — descending phase of the action potential peak (repolarization phase); d — negative afterpotential; e — positive afterpotential. The arrow indicates the moment of stimulation
The aforementioned processes relate to the excitation of a single myocardial muscle fiber. Triggered by depolarization, the impulse excites adjacent areas of the myocardium, gradually spreading across the entire myocardium in a chain-reaction manner. Cardiac excitation originates in the sinus node. From the sinus node, the excitation process spreads to the atria via atrial conduction pathways. From the atria, it travels to the atrioventricular node, where the impulse is delayed due to slower conduction in this region. Bypassing the atrioventricular junction, the excitation propagates to the bundle of His and then to its branches—the right and left bundle branches. The latter form the Purkinje fiber network, which anastomose extensively with one another.
An electrocardiogram (ECG) is a recording of the total electrical potential generated during the excitation of multiple myocardial cells, and the diagnostic method is called electrocardiography.
To record a human ECG, three standard bipolar leads are used, which refer to the placement of electrodes on the body surface. Lead I is placed on the right and left arms, Lead II on the right arm and left leg, and Lead III on the left arm and left leg. In addition to standard leads, chest leads from other points on the chest wall over the heart area, as well as unipolar leads, are also utilized.
A typical human ECG consists of five positive and negative deflections—waves—corresponding to the cardiac cycle. They are designated by the Latin letters P, Q, R, S, and T, while chest (precordial) leads are designated as V (V1, V2 V3, V4, V5, V6). Three waves (P, R, T) are upward-directed (positive waves), and two (Q, S) are downward-directed (negative waves). The P wave reflects the period of atrial excitation, with a duration of 0.08—0.1 s. The P-Q segment corresponds to the conduction of excitation through the atrioventricular node to the ventricles. It lasts 0.12—0.20 s. The Q wave reflects the depolarization of the interventricular septum. The R wave is the tallest wave on the ECG, representing the depolarization of the cardiac apex, as well as the posterior and lateral walls of the ventricles. The S wave reflects the spread of excitation to the Base of the ventricles, and the T wave represents The process of rapid ventricular repolarization. The QRS complex coincides with atrial repolarization. Its duration is 0.06—0.1 s. The QRST complex is caused by the onset and spread of excitation in the ventricular myocardium, which is why it is called the ventricular complex. The total duration of QRST is approximately 0.36 s. The imaginary line connecting the two ECG points with the greatest potential difference is called the electrical axis of the heart.
In the Diagnosis of heart diseases, electrocardiography allows for a detailed study of changes in cardiac rhythm, The Emergence of ectopic foci of excitation during extrasystoles, conduction disturbances along the cardiac conduction system, ischemia, and myocardial infarction.
Basic processes of hemodynamics. Blood pressure. Pulse. The movement of blood through The Cardiovascular system is determined by hemodynamic processes, which reflect the physical phenomena of fluid motion in closed vessels. Hemodynamics is determined by two factors: the pressure exerted on the fluid and the resistance encountered due to friction against the vessel walls and turbulent flow.
The force that generates pressure in The Vascular System is the heart. In an adult, each cardiac contraction ejects 60—70 ml of blood into the vascular system (stroke volume) or 4—5 l/min (Cardiac Output). The driving force of blood flow is the pressure gradient arising between the beginning and the end of a vessel. Blood flow through the vascular system is laminar (blood moving in separate layers parallel to the vessel axis). In this process, the layer adjacent to the vessel wall remains virtually stationary, the second layer slides over it, the third over the second, and so on. Formed elements of blood make up the central axial flow, while plasma flows closer to the walls. It is well known that the smaller the vessel diameter, the closer the central layers of blood are to the walls, resulting in greater deceleration. This means that blood flow velocity is lower in small vessels than in large ones. Thus, in the aorta it is 50 cm/s, in Arteries — 30, in capillaries — 0.5—1.0, in Veins — 5—14, and in the vena cava — 20 cm/s.
In addition to laminar flow, turbulent flow with characteristic blood swirling also occurs in the vascular system. Its particles move not only parallel to the vessel axis but also perpendicular to it. The primary kinetic energy required for blood flow is provided by the heart during systole. One portion of this energy is used to propel the blood, while another is converted into potential energy, which is required to distend the walls of the aorta and large and medium-sized vessels during systole. During diastole, the elastic recoil energy of the aortic and vessel walls is converted back into kinetic energy, facilitating blood flow through the vessels.
Blood Vessels are also capable of actively responding to changes in blood pressure. When pressure rises, the smooth Muscles of the vessel walls contract, reducing the vessel diameter. Thus, thanks to The properties of the aorta and large vessels, the pulsatile blood flow is smoothed out and becomes relatively continuous. Under normal conditions, blood outflow from the heart matches its inflow. This means that the volume of blood flowing per unit of time through the entire arterial and venous systems of both the SYSTEMIC AND PULMONARY circulations is equal.
Blood flow velocity varies across the vascular bed and depends on the total cross-sectional area of vessels of a given caliber in that part of the body. The aorta has the smallest cross-sectional area, and the blood flow velocity within it is the highest — 50—70 cm/s. Capillaries possess the largest total cross-sectional area, which is 800 times greater than that of the aorta. Accordingly, the velocity of BLOOD FLOW IN them is about 0.05 cm/s. In arteries, it is 20—40 cm/s, and in arterioles — 0.5 cm/s.
The level of arterial pressure is determined by three main factors: the pumping force of the heart, peripheral vascular resistance, and the volume and viscosity of blood. However, the primary factor is Cardiac Activity. With each systole and diastole, blood pressure in the arteries fluctuates. Its rise during systole is defined as systolic (maximum) pressure. The drop in pressure during diastole corresponds to diastolic (minimum) pressure. Its value depends mainly on peripheral resistance to blood flow and heart rate. The difference between systolic and diastolic pressure is called pulse pressure.
An increase in blood pressure above normal is called arterial Hypertension, while a decrease is called arterial hypotension.
Peripheral resistance is the second factor determining blood pressure, and it depends on the diameter of small arteries and arterioles. A change in the lumen of these vessels leads to a corresponding increase in systolic and diastolic pressure, as well as impairment of local Circulation.
The volume and viscosity of blood represent the third factor determining arterial pressure. Significant blood loss leads to a drop in blood pressure, whereas the transfusion of large volumes of blood increases arterial pressure.
The level of arterial pressure also depends on age. In children, blood pressure is lower than in adults because their vessel walls are more elastic.
Normally, the systolic (maximum) pressure in a healthy individual is 110—120 mmHg, and the diastolic (minimum) pressure is 70—80 mmHg.
The level of blood pressure serves as an important indicator of cardiovascular system function.
Blood pressure is determined in two ways: the direct (invasive) method, which is used in animal experiments, and the indirect (non-invasive) method, using a Riva-Rocci sphygmomanometer and auscultating vascular sounds in the artery below the cuff (the Korotkoff method).
The pulse refers to the periodic oscillations of the vessel wall associated with the dynamics of blood filling and pressure changes within them during a single cardiac cycle. At the moment of blood ejection from the heart, pressure in the aorta rises, and this pressure wave propagates along the arteries to the capillaries, where the pulse wave fades. Corresponding to these pulsatile pressure changes, the movement of blood through the arteries also becomes pulsatile: blood flow accelerates during systole and decelerates during diastole. The amplitude of the pulse wave dampens as it travels from the center to the periphery. The propagation velocity of the pulse wave in the human aorta is 5.5—8.0 m/s, and in large arteries, it is 6.0—9.5 m/s.
The pulse can be determined by direct Palpation of a pulsating artery through the Skin (temporal, radial, dorsalis pedis artery, etc.). In clinical practice, when examining the pulse, attention is paid to the following characteristics: rate, rhythm, tension, volume, and the size and shape of the pulse wave. Normally, the pulse rate in an adult is 70—80 beats per minute. A decrease in pulse rate is called bradycardia, and an increase is called tachycardia. Pulse rate depends on sex, age, physical exertion, body Temperature, etc. Pulse rhythm is determined by cardiac activity and can be regular or irregular. Pulse tension is characterized by the force required to compress the artery until the pulse completely disappears. Volume refers to the degree of change in arterial volume, determined by the strength of the pulse beat. For a more detailed Study of the pulse, a sphygmograph is used. The curve obtained by recording pulse oscillations is called a sphygmogram. On a sphygmogram of the aorta and large arteries, an initial sharp rise of the curve, known as the anacrotic limb, is distinguished. This rise is associated with the opening of the semilunar valves, when blood is forcefully ejected into the aorta, distending its walls. The descent of the pulse curve is called the catacrotic limb. It occurs at the end of ventricular systole, when the pressure within it begins to fall. The pulsatile nature of blood flow is of great importance for The regulation of circulation as a whole.
Last update: 08/08/2026
Editorial and Educational Adaptation: This material has been compiled based on the primary/original source text. The project team performed an editorial review, corrected technical inaccuracies, structured sections, and adapted the content for an educational format.
What was processed:
- elimination of formatting defects (OCR errors, structural breaks, corrupted characters);
- editorial organization of content;
- standardization of terminology in accordance with academic sources;
- verification of factual statements against the original source text.
All mentions of the author, publication year, and origin of the primary text have been preserved in accordance with the source.