Review of Medical Physiology - William F. Ganong 2002
Blood Circulation
Pumping Function of the Heart
Cardiac Output
Measurement Methods
In animal experiments, cardiac output can be measured by placing an electromagnetic flow probe around the ascending aorta. In humans, cardiac output can be determined using the direct Fick method and dilution techniques, In addition to a combination of Doppler Ultrasonography and echocardiography.
Class="center">Table 29-2. Heart Murmurs
Valve |
Disorder |
Timing of Murmur |
Aortic or pulmonary |
AV valve stenosis |
Systolic |
Regurgitation |
Diastolic |
|
Mitral or tricuspid |
AV valve stenosis |
Diastolic |
Regurgitation |
Systolic |
According to the Fick principle, The amount of a substance taken up by an organ (or the whole body) per unit of time is equal to the Blood flow multiplied by the arteriovenous concentration difference (A-V difference). Naturally, this principle applies only when arterial blood is the sole source of the absorbed substance. It is also useful for determining cardiac output by dividing the volume of O2 consumed by the body per unit time by the pulmonary A-V oxygen difference. Because systemic arterial Blood has a uniform O2 content throughout the body, arterial O2 content can be measured in blood drawn from any accessible artery. Mixed venous blood from the pulmonary artery is obtained via cardiac catheterization. Previously, blood from the right atrium was used for this purpose; however, inadequate blood mixing can introduce errors in this case, making the sample unrepresentative of the entire body. Below is an example of cardiac output calculation using average values:
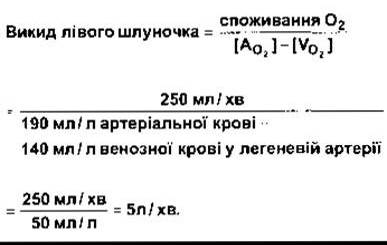
Today, inserting a long catheter through a forearm vein into The Heart under fluoroscopic guidance has become a routine Procedure. This technique was pioneered by Forssmann, who catheterized his own heart. However, after attempting to obtain permission to test the method for diagnostic purposes in other humans, he was dismissed from his job. It is now established that the procedure is safe. Catheters can be advanced not only into the right atrium but also through the atrium and right ventricle into the smaller Branches of the pulmonary artery, as well as retrogradely from peripheral Arteries into the heart, coronary vessels, and other arteries. The dilution method involves injecting a known quantity of a substance—such as a dye or, more commonly, a radioactive isotope—into an antecubital vein, followed by measuring the concentration of the substance in a series of arterial blood samples. Cardiac output equals the amount of indicator injected divided by the average concentration in arterial blood during its first passage through the heart (Fig. 29-4). Obviously, the indicator must be a substance that remains in the bloodstream throughout the test without causing adverse hemodynamic effects. In practice, a plot of the logarithm of indicator concentration in serial arterial blood samples versus time is constructed. The concentration rises, falls, and then rises again due to indicator recirculation. The initial downslope, which is linear on a semilogarithmic plot, is extrapolated to the abscissa to determine the mean transit time of the indicator through the Circulation. Cardiac output for this period is calculated (see Fig. 29-4), and from it, the cardiac output per minute is derived.
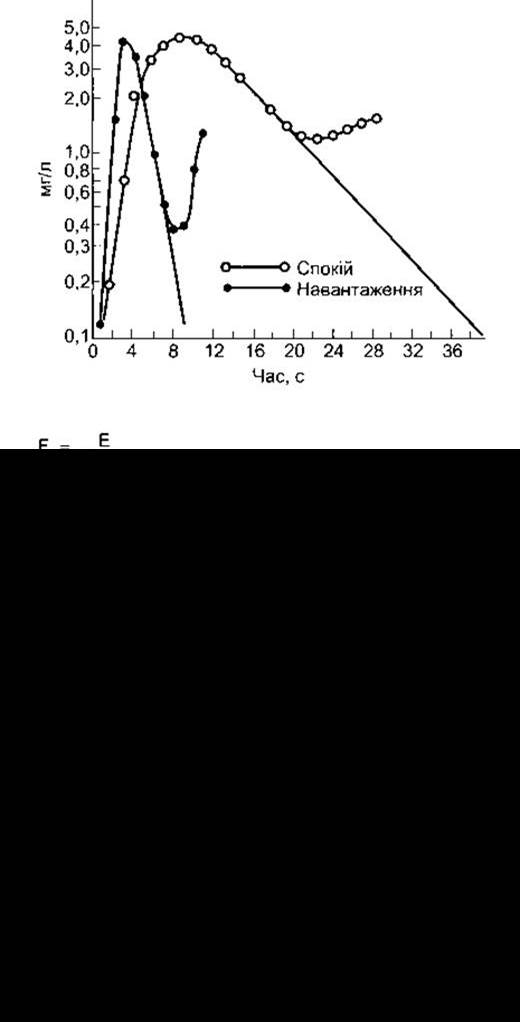
Fig. 29-4. Determination of cardiac output by the indicator (dye) dilution method.
A widely used dilution technique is thermodilution, in which a chilled isotonic solution serves as the indicator. This solution is injected into the right atrium through one lumen of a dual-lumen catheter. Simultaneously, blood Temperature Changes in the pulmonary artery are recorded by a thermistor located on the second, longer tip of the catheter. The temperature change is inversely proportional to the volume of blood flowing through the pulmonary artery—that is, the degree of dilution of the cold isotonic solution by the blood. This method offers two major advantages: first, the isotonic solution is completely harmless; second, the cold dissipates in the Tissues, eliminating recirculation problems and allowing measurements to be repeated.
Cardiac output can also be measured using a combination of Doppler ultrasonography and echocardiography (see above).
Cardiac Output Under Various Conditions
The volume of blood ejected by each ventricle per contraction is called the stroke volume. In a resting subject of average body weight, the stroke volume is approximately 70 mL (70 mL from the left ventricle and 70 mL from the right). The volume of blood pumped by the heart per unit of time is termed cardiac output. At rest in the supine position, it is approximately 5.0 L/min (70 mL × 72 beats/min). There is a direct relationship between cardiac output and body surface area. Cardiac output per square meter of body surface area (the cardiac index) is approximately 3.2 L. The effects of various factors on cardiac output are summarized in Table 29-3.
Factors Controlling Cardiac Output
Variations in cardiac output can be driven by changes in heart rate or stroke volume (Fig. 29-5). Heart rate is controlled primarily by The Nervous system. Sympathetic stimulation increases heart rate, whereas parasympathetic stimulation decreases it (see Chapter 28). Stroke volume is also partly regulated by neural influences. Sympathetic stimulation causes Muscle fibers to contract with greater force at any given length. Parasympathetic stimulation produces the opposite effect. When the force of contraction increases without an increase in fiber length, a larger fraction of blood is ejected from the ventricles; consequently, the ejection fraction increases and the end-systolic volume decreases. The Effect of catecholamines released by sympathetic nerve fibers on heart rate is termed a chronotropic effect, and their effect on myocardial contractility is called an inotropic effect. Factors that increase myocardial contractility are characterized as positive inotropes, while those that decrease it are negative inotropes.
Table 29-3. Effect of Various Factors on Cardiac Output
Condition or Factor1 |
|
No change |
Moderate changes in ambient temperature |
Increase |
Anxiety and excitement (50–100%) Eating (30%) Exercise (up to 700%) High ambient temperature Epinephrine |
Decrease |
Transition from lying to sitting or standing (20–30%) Tachyarrhythmias Heart disease |
1 Approximate percentage changes are shown in parentheses.
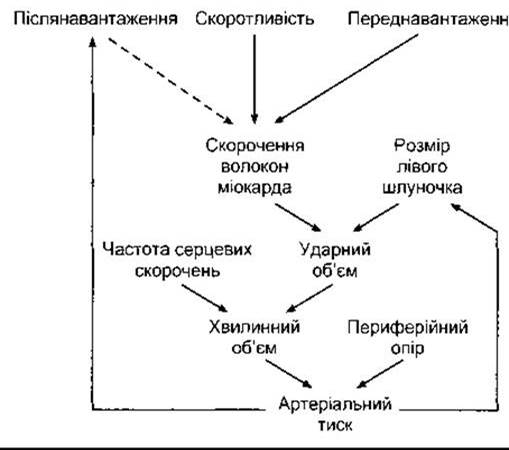
Fig. 29-5. Interplay of factors regulating cardiac output and blood pressure. Solid lines indicate an increase; dashed lines indicate a decrease.
The force of cardiac Muscle contraction depends on preload and afterload. METABOLISM/18.html">The Influence of these factors is illustrated in Fig. 29-6, where a muscle strip is stretched by a load (preload) resting on a surface. The initial phase of contraction is isovolumetric; the elastic and contractile elements stretch, and tension increases until it is sufficient to lift the load.
The tension at which the load is lifted represents the afterload. The muscle then contracts isotonically without further increase in tension. In vivo, preload is the degree of myocardial stretch prior to contraction, and afterload is the resistance that must be overcome during blood ejection.
Length-Tension Relationship in Cardiac Muscle
The relationship between the length and tension of cardiac muscle fibers (see Fig. 3-16) is similar to that observed in Skeletal Muscle (see Fig. 3-10). As the muscle contracts, tension increases to a maximum, but decreases if the muscle is excessively stretched. Starling drew attention to this phenomenon when he discovered that the energy of contraction is directly proportional to the initial length of the muscle fiber. This principle is known as Starling's law or the Frank-Starling law.
In the heart, muscle fiber length (i.e., preload) is directly proportional to end-diastolic volume. The relationship between ventricular stroke volume and end-diastolic volume is represented by the Frank-Starling curve.
REGULATION OF CARDIAC output through changes in the length of cardiac muscle fibers is sometimes called heterometric regulation, whereas regulation resulting from changes in contractility independent of fiber length is termed homometric regulation.
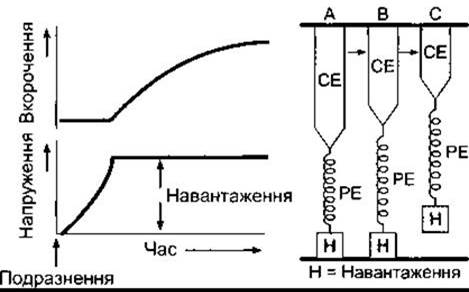
Fig. 29-6. Model of muscle contraction against an afterload: A: rest; B: partial contraction of the contractile element of the muscle (CE) with stretching of the elastic element (PE) without shortening; C: complete contraction with shortening (reproduced with permission from Sonnenblick EH in: The Myocardial Cell: Structure, Function and Modification. Briller SA, Conn HL [editors]. Univ Pennsylvania Press, 1966).
Cardiopulmonary preparation
The consequences of changes in peripheral resistance can be demonstrated using a cardiopulmonary preparation. Cannulas are inserted into the aorta and vena cava of an anesthetized animal, usually a dog, such that blood flows from the aorta through a system of tubing and a reservoir into the right atrium, and then through the animal's heart and Lungs back into the aorta. Other Tissues of the animal's body are deprived of blood supply, leaving the heart functionally denervated, with the heart rate remaining virtually unchanged. By altering the caliber of the outflow tubing, one can increase the resistance (peripheral resistance) that the heart must overcome to pump blood. When peripheral resistance rises, the heart ejects less blood than it receives over the course of several beats. Blood accumulates in the ventricles, and the size of the heart increases. The stretched heart contracts with greater force, thereby returning cardiac output to its initial level.
The cardiopulmonary preparation also allows one to observe the effects of changes in venous return. When the reservoir supplying blood to the right atrium is elevated, venous pressure and venous return increase. The muscle fibers are stretched, which leads to an increase in cardiac output.
Factors affecting end-diastolic volume
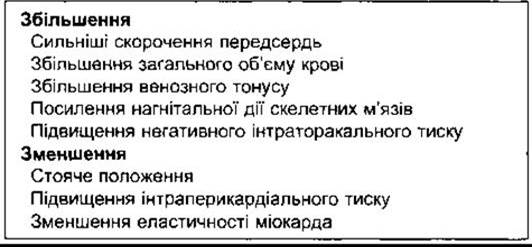
Changes in systole and diastole affect cardiac function in different ways. When systolic contraction is weakened, cardiac output decreases. Changes in diastole also affect stroke volume, but through a different mechanism. The factors that normally regulate end-diastolic volume are listed in Table 29-4. An increase in intrapericardial pressure limits the degree of ventricular filling. A decrease in myocardial compliance resulting from myocardial infarction, infiltrative processes, and other disorders has a similar effect. Atrial contraction AIDS in ventricular filling. Other factors influence the amount of blood returning to The Heart and thus affect ventricular filling indirectly via diastole. An increase in circulating blood volume enhances venous return. Venoconstriction decreases venous capacitance, reduces venous blood pooling, and increases venous return. An increase in the normal negative intrathoracic pressure increases the pressure gradient driving blood into the heart, whereas a decrease reduces venous return. In the standing position, the amount of blood returning to the heart is diminished, whereas muscle activity enhances venous return through the pumping action of skeletal Muscles.
Fig. 29-7 illustrates the effects of systolic and diastolic dysfunction on the left ventricular pressure-volume relationship.
Table 29-4. Factors that normally increase or decrease the length of ventricular muscle fibers
Myocardial contractility
Myocardial contractility has a profound effect on stroke volume. Stimulation of the cardiac sympathetic nerves shifts the length-tension curve upward and to the left (Fig. 29-8). The positive inotropic effect of norepinephrine released by nerve endings is augmented by circulating norepinephrine. Epinephrine produces a similar effect. Stimulation of the vagus nerves exerts a negative inotropic effect on the atrial muscle and a minor negative inotropic effect on the ventricular muscle.
Changes in heart rate and rhythm also affect myocardial contractility (the force-frequency relationship, see Fig. 29-8). In the case of ventricular extrasystoles, each subsequent contraction in the myocardium is stronger than the preceding normal one. Postextrasystolic potentiation is independent of ventricular filling, as it occurs in isolated cardiac muscle and is caused by an increase in intracellular Ca2+ concentration. A sustained increase in contractility can be induced by delivering paired electrical stimuli to the heart such that the second stimulus arrives immediately after the refractory period produced by the first impulse. It has also been established that myocardial contractility increases with rising heart rate, although this effect is relatively minor. Catecholamines exert an inotropic effect by acting on cardiac β1-adrenoceptors and Gs Proteins, leading to the activation of Adenylyl Cyclase and an increase in intracellular cAMP concentration. Xanthines, such as caffeine and theophylline, inhibit cAMP breakdown and produce a positive inotropic effect. Glucagon, which enhances cAMP formation, is recommended for the Treatment of certain heart conditions. The positive inotropic effect of digitalis and related substances (see Fig. 29-8) is due to their ability to inhibit myocardial Na+-K+-ATPase. Inhibition of this enzyme leads to an increase in intracellular Na+ concentration, which in turn results in an elevated intracellular Ca2+ concentration. The key role of Ca2+ in skeletal and cardiac muscle contraction is described in Chapter 3. Hypercapnia, Hypoxia, acidosis, and drugs such as quinidine, procainamide, and barbiturates depress myocardial contractility. Myocardial contractility is also diminished in Heart Failure (intrinsic depression). The Mechanism of this depression is not yet fully understood.
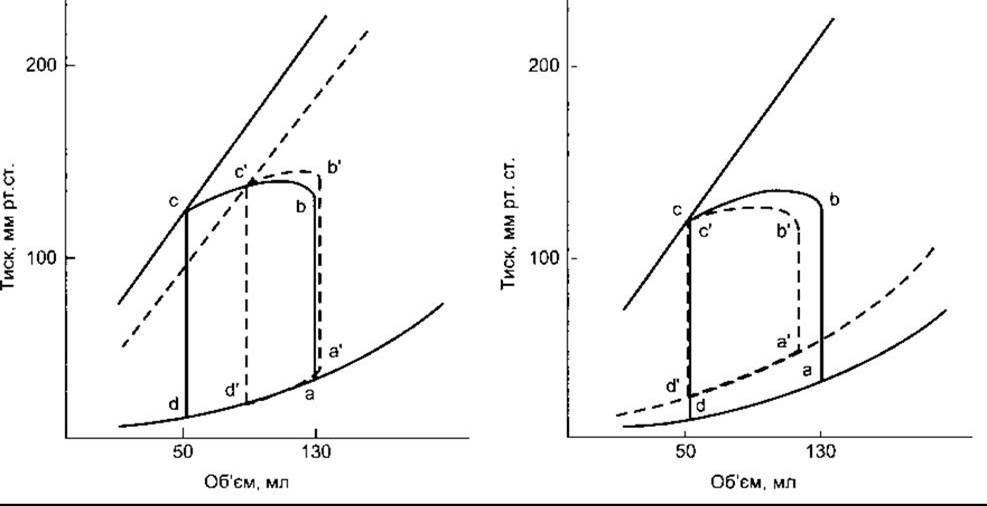
Fig. 29-7. Effects of systolic and diastolic dysfunction on the left ventricular pressure-volume loop. Left: systolic dysfunction shifts the isometric pressure-volume curve (see Fig. 29-2) to the right, reducing stroke volume from b-c to b'-c'. Right: diastolic dysfunction causes an increase in end-diastolic volume and shifts the diastolic pressure-volume curve upward and to the left. This results in a decrease in stroke volume from b-c to b'-c' (reproduced with permission from McPhee SJ et al [editors]: Pathophysiology of Disease, 3rd ed. McGraw-Hill, 2000).
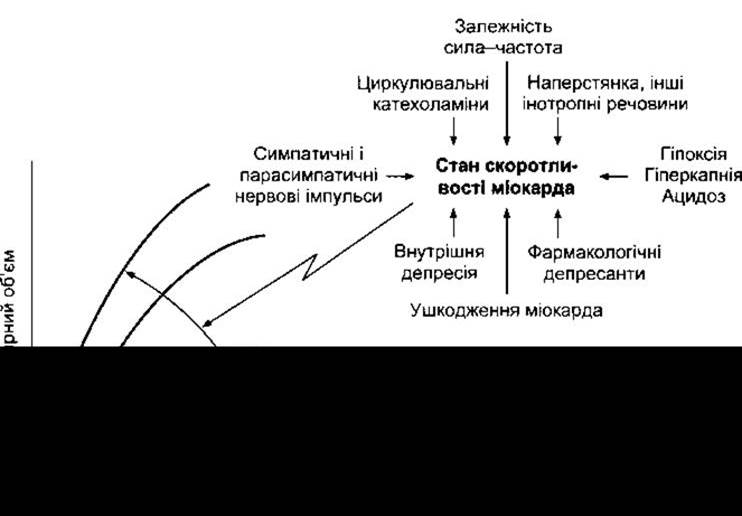
Fig. 29-8. Effect of myocardial contractility on the Frank-Starling curve. The curve shifts downward and to the right with decreasing contractility. The main factors affecting contractility are listed on the right. Dashed lines indicate the portions of the ventricular function curve that correspond to the exceeding of maximum myocardial contractility, i.e., the descending limbs of the Frank-Starling curve; EDV - end-diastolic volume (reproduced with permission from Braunwald E, Ross J, Sonnenblick EH: Mechanisms of contraction of the normal and failing heart. N Engl J Med 1967;277:794).
Integrative regulation of cardiac output
In intact animals and humans, the mechanisms described above participate in the integrative regulation and maintenance of cardiac output. During skeletal muscle exercise, sympathetic nerve activity is enhanced, resulting in increased myocardial contractility and heart rate. The increase in heart rate is especially pronounced in healthy individuals, who exhibit only a minor increase in stroke volume (Table 29-5). However, in heart transplant recipients, cardiac output during exercise can increase in the absence of cardiac innervation via the Frank-Starling mechanism (Fig. 29-9). Circulating catecholamines also contribute to this response. The increase in cardiac output in such patients is less rapid and the maximal effect is weaker than in healthy individuals, but it remains substantial. When venous return increases while sympathetic tone remains unchanged, venous pressure rises, diastolic inflow increases, ventricular end-diastolic pressure rises, and the heart muscle contracts with greater force. During exercise, venous return is enhanced by the skeletal muscle pump and increased Respiration (see Chapter 33). Furthermore, exercise-induced vasodilation reduces peripheral resistance and consequently afterload. Ultimately, both in healthy and transplanted hearts, a rapid and marked increase in cardiac output is observed. Normally, the heart is never stretched to the point of reaching the "descending limb" of the Frank-Starling curve (see Fig. 29-8), i.e., a state where further stretching leads to a decrease rather than an increase in stroke volume. Should this occur, a vicious cycle ensues in which further increases in ventricular filling result in decreased cardiac output, which in turn leads to even greater ventricular filling.
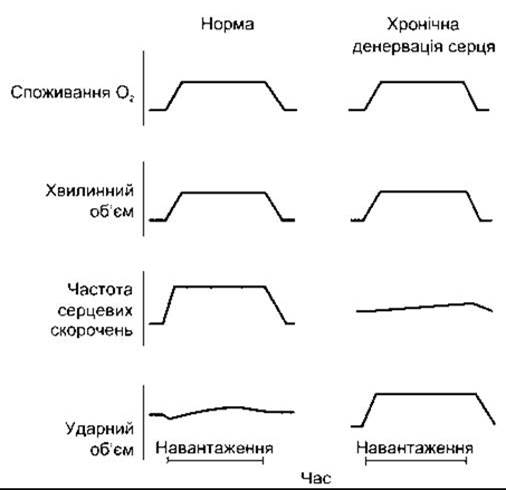
Fig. 29-9. Changes in cardiac function during moderate supine exercise in healthy individuals and patients with a transplanted and thus denervated heart (reproduced with permission from Kent KM, Cooper T: The denervated heart. N Engl J Med 1974;291:1071)
One of the differences between untrained individuals and athletes is that athletes have a lower resting heart rate, a larger ventricular end-systolic volume, and a greater resting stroke volume. Therefore, unlike untrained individuals, athletes can achieve an increase in cardiac output through an increase in stroke volume without an elevation in heart rate.
Myocardial oxygen consumption
Basal myocardial O2 consumption, which can be determined by arresting the heart while maintaining coronary perfusion, is approximately 2 mL/100 g/min. This value exceeds the corresponding resting rate for skeletal muscle. O2 consumption of the beating heart is about 9 mL/100 g/min at rest. This value increases during physical exertion and under certain medical conditions. The O2 tension in cardiac venous blood is low, and little additional oxygen can be extracted from the blood in the coronary vessels. Therefore, supporting an elevated rate of O2 consumption requires an increase in coronary blood flow. The regulation of coronary blood flow is described in Chapter 32.
Table 29-5. Changes in cardiac function during Physical Exercise. Note that stroke volume reaches a maximum, but then slightly decreases at very high heart rates (due to diastole shortening)1
Workload, kgm/min |
O2 consumption, mL/min |
Heart rate, beats/min |
Cardiac output, L/min |
Stroke volume, mL |
A-V O2 difference, mL/dL |
Rest |
267 |
64 |
6,4 |
100 |
4,3 |
288 |
910 |
104 |
13,1 |
126 |
7,0 |
540 |
1430 |
122 |
15,2 |
125 |
9,4 |
900 |
2143 |
161 |
17,8 |
110 |
12,3 |
1260 |
3007 |
173 |
20,9 |
120 |
14,5 |
1 Reproduced with permission from Asmussen E, Nielsen M: The cardiac output in rest and work determined by the acetylene and the dye injection methods. Acta Physiol Scand 1952;27:217
Myocardial O2 consumption depends primarily on intramyocardial tension, myocardial contractility, and heart rate. Ventricular stroke work correlates directly with O2 consumption. Work is equal to the product of stroke volume and mean arterial pressure in the pulmonary trunk (for the right ventricle) or the aorta (for the left ventricle). Because aortic pressure is approximately seven times higher than pulmonary arterial pressure, the work performed by the left ventricle is about seven times greater than that of the right ventricle. Theoretically, a 25% increase in stroke volume without A change in arterial pressure should result in the same increase in O2 consumption as a 25% increase in arterial pressure without a change in stroke volume. However, for reasons that remain unclear, pressure work causes a greater increase in O2 consumption than volume work. In other words, an increase in afterload leads to a greater rise in myocardial O2 consumption than an increase in preload. This explains why angina pectoris resulting from inadequate myocardial O2 supply develops more frequently in aortic stenosis than in aortic regurgitation. In aortic stenosis, intraventricular pressure must increase to force blood through the narrowed aortic valve orifice, whereas in aortic regurgitation, blood regurgitation leads to an increased stroke volume without significant resistance changes.
It should be noted that the increase in O2 consumption caused by an increase in stroke volume when muscle fibers are stretched is an example of the Law of Laplace. According to this law, which is described in detail in Chapter 30, the tension developed in the vessel wall is directly proportional to the vessel radius, and the radius of the relaxed heart increases. Myocardial O2 consumption per unit of time increases during sympathetic nervous system stimulation due to an increase in heart rate as well as the velocity and force of contraction. However, this is counteracted by a decrease in end-systolic volume and, consequently, a reduction in cardiac radius.
Last update: 10/08/2026
Editorial and Educational Adaptation: This material has been compiled based on the primary/original source text. The project team performed an editorial review, corrected technical inaccuracies, structured sections, and adapted the content for an educational format.
What was processed:
- elimination of formatting defects (OCR errors, structural breaks, corrupted characters);
- editorial organization of content;
- standardization of terminology in accordance with academic sources;
- verification of factual statements against the original source text.
All mentions of the author, publication year, and origin of the primary text have been preserved in accordance with the source.