Review of Medical Physiology - William F. Ganong 2002
Circulation
Pumping Function of the Heart
Mechanical Events of the Cardiac Cycle
Changes During Late Diastole
At the end of diastole, the mitral and tricuspid Valves between the atria and ventricles open, while the aortic and pulmonary valves close. Blood enters The Heart throughout diastole, filling both the atria and ventricles. The filling rate decreases as the ventricles stretch, and the cusps of the atrioventricular (AV) valves close due to the blood flow (Fig. 29-1), especially when the heart rate is low. Ventricular pressure remains low.
Atrial Systole
Atrial contraction pumps some additional blood into the ventricles, although approximately 70% of ventricular filling occurs passively during systole. The contraction of the atrial Muscles surrounding the orifices of the superior and inferior venae cavae and the Pulmonary Veins causes these orifices to narrow. Momentum keeps blood moving toward the veins, but some blood regurgitation into the veins occurs during atrial systole.
Ventricular Systole
At the onset of ventricular systole, the mitral and tricuspid (AV) valves close. Initially, the ventricular muscles shorten relatively little. However, intraventricular pressure rises sharply as the myocardium presses against the blood inside the ventricle (Fig. 29-2). This period of isovolumetric (isovolumic, isometric) ventricular contraction lasts approximately 0.05 s, until the pressure in the left and right ventricles exceeds the pressure in the aorta (80 mm Hg; 10.6 kPa) and the pulmonary trunk (10 mm Hg), causing the aortic and pulmonary valves to open. During the phase of isometric contraction, the AV valves bulge into the atria, causing a slight but abrupt pressure rise there (Fig. 29-3).
Class="center">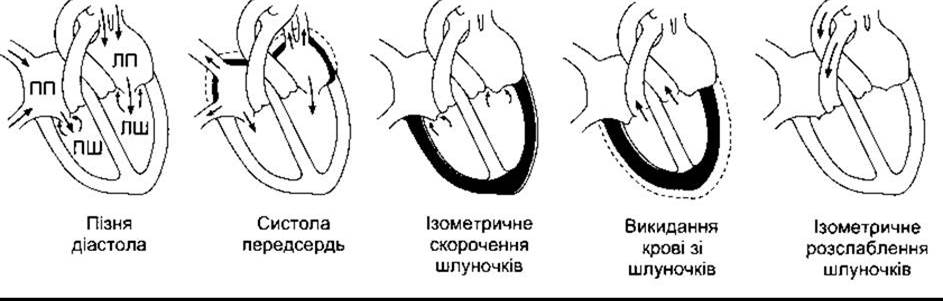
Fig. 29-1. Movement of blood through The Heart and great vessels during the cardiac cycle. Heart chambers contracting during each phase are shown in color; RA, LA - right and left atrium, respectively; RV, LV - right and left ventricle.

Fig. 29-2. Pressure-volume loop of the left ventricle. During diastole, the ventricle fills and pressure rises from d to a. Pressure then rises sharply from a to b during isometric contraction and from b to c during the ejection phase. At c, the aortic valve closes, and pressure falls during isometric relaxation from c back to d (reproduced with permission from McPhee SJ et al [editors]. Pathophysiology of Disease, 3rd ed. McGraw-Hill, 2000).
With the opening of the aortic and pulmonary valves, the blood ejection phase begins. Ejection is initially rapid and later slows down. Intraventricular pressure reaches a maximum and then decreases slightly before ventricular systole ends. Peak left ventricular pressure is approximately 120 mm Hg, while right ventricular pressure is 25 mm Hg or less. At the end of systole, aortic pressure exceeds ventricular pressure, but blood continues to move briefly by inertia. As the ventricular muscles contract, they pull the AV valves downward, causing atrial pressure to drop. The stroke volume ejected by each ventricle at rest is 70-90 mL. The end-diastolic ventricular volume is approximately 130 mL. Consequently, about 50 mL of blood remains in each ventricle at the end of systole (end-systolic ventricular volume). The ejection fraction, defined as the percentage of end-diastolic volume ejected with each beat, is approximately 65%. The ejection fraction is a crucial indicator of ventricular performance. It can be determined by using radiolabeled red Blood Cells and assessing the cardiac blood pool at the end of diastole and end of systole (equilibrium radionuclide angiography), after which the ejection fraction can be calculated.
Early Diastole
After the ventricular muscles have fully contracted, ventricular pressure begins to fall more rapidly. This period is called protodiastole and lasts about 0.04 s. Protodiastole ends when the forward flow of ejected blood by inertia ceases and the aortic and pulmonary valves close, causing a transient vibration of the blood and blood vessel walls. Following valve closure, pressure continues to drop rapidly during the period of isovolumetric ventricular relaxation. Isovolumetric relaxation ends when ventricular pressure falls below atrial pressure, opening the AV valves and allowing ventricular filling to begin. Filling is initially rapid and slows as the next heartbeat approaches. Atrial pressure continues to rise after ventricular systole until the AV valves open, after which it drops and then slowly rises again until the next atrial systole.
The heart is separated from other thoracic Organs by the pericardium. The myocardium itself is covered by the fibrous epicardium. The pericardial sac normally contains 5-30 mL of clear fluid, which acts as a lubricant and allows the heart to contract with minimal friction.
Timing
Although the events occurring on both sides of the heart are similar, they exhibit some asynchrony. Right atrial systole precedes left atrial systole, and right ventricular contraction begins later than left ventricular contraction (see Chapter 28). However, because pulmonary pressure is lower than aortic pressure, ejection from the right ventricle starts sooner than from the left. During expiration, the pulmonary and aortic valves close simultaneously. During inspiration, however, the aortic valve closes slightly sooner. The delayed closure of the pulmonary valve is due to lower pulmonary vascular resistance. Cardiac Output measured over a given period is generally equal in both ventricles, although temporary differences in output may occur during the respiratory cycle in healthy individuals.
Duration of Systole and Diastole
A unique property of cardiac Muscle is its ability to contract and repolarize more rapidly as the heart rate increases (see Chapter 3). Consequently, the duration of systole decreases from 0.3 s at a heart rate of 65 bpm to 0.16 s at 200 bpm (Table 29-1). Systolic shortening is achieved primarily by reducing the duration of systolic ejection, although the duration of systole is more constant than that of diastole; as the heart rate increases, diastole shortens much more than systole. For example, at a heart rate of 65 bpm, diastole lasts 0.62 s, whereas at 200 bpm it is only 0.14 s. This fact is of great physiological and clinical importance. Diastole is the period when the heart muscle rests and when coronary vessels supply blood to the subendocardial Regions of the left ventricle (see Chapter 32). Furthermore, ventricular filling occurs predominantly during diastole. At heart rates up to 180 bpm, ventricular filling remains adequate because venous return is sufficient, and cardiac output increases with heart rate. However, at very high heart rates, ventricular filling can be impaired to such an extent that cardiac output drops and symptoms of Heart Failure develop.
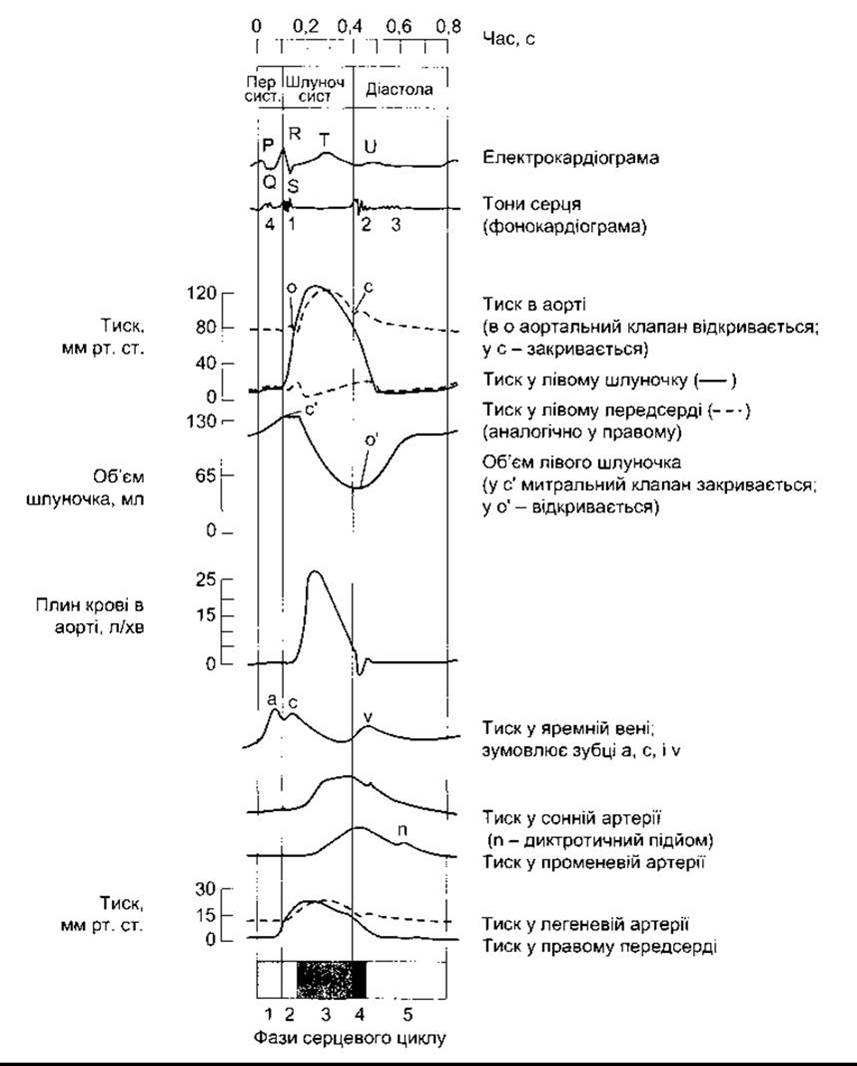
Fig. 29-3. Events of the cardiac cycle at a heart rate of 75 beats/min. Phases of the cardiac cycle are indicated by numbers at the bottom: 1 - atrial systole; 2 - isovolumetric ventricular contraction; 3 - ejection phase; 4 - isovolumetric ventricular relaxation; 5 - ventricular filling. Note that at the end of systole, aortic pressure significantly exceeds left ventricular pressure, yet blood continues to flow out of the ventricles by inertia for a short period. Relationships in the right ventricle and pulmonary artery are similar. At. syst. - atrial systole; Vent. syst. - ventricular systole.
Because cardiac muscle has a prolonged Action Potential and a long refractory period, it can contract in response to a subsequent stimulus only toward the end of the previous contraction (see Fig. 3-14). Consequently, cardiac muscle does not exhibit tetanic contractions like Skeletal Muscle. The theoretical maximum heart rate is about 400 bpm. In adults, however, the AV node conducts no more than 230 impulses per minute because of its long refractory period. A ventricular rate exceeding 230 is observed only in paroxysmal tachycardia (see Chapter 28).
Table 29-1. Changes in action potential duration and other parameters with changing heart rate1
Parameter |
HR 200/min |
HR 75/min |
Skeletal muscle |
Cardiac cycle duration |
0.80 |
0.30 |
|
Systole duration |
0.27 |
0.16 |
|
Action potential duration |
0.25 |
0.15 |
0.005 |
Absolute refractory period duration |
0.20 |
0.13 |
0.004 |
Relative refractory period duration |
0.05 |
0.02 |
0.003 |
Diastole duration |
0.53 |
0.14 |
1 All values are given in seconds.
It is difficult to accurately measure the duration of isovolumetric ventricular contraction in clinical practice. However, it is quite easy to determine the duration of the total electromechanical systole (QS2), the pre-ejection period (PEP), and left ventricular ejection time (LVET) using simultaneous ECG, phonocardiogram, and carotid pulse recordings. The total electromechanical systole QS2 is the period from the onset of the QRS complex to the closure of the aortic valve, indicated by the beginning of the second heart sound. LVET is the period from the onset of carotid pressure rise to the dicrotic notch (see below). PEP is the difference between QS2 and LVET, representing the time corresponding to the electrical and mechanical events preceding systolic ejection. The normal PEP/LVET ratio is approximately 0.35. This index increases without altering QS2 in left ventricular dysfunction caused by various heart diseases.
The Arterial Pulse
Blood entering the aorta during systole not only drives Blood flow through the vessels but also generates a pressure wave that propagates along the Arteries. This pressure wave stretches the arterial walls as it travels, and this distension is palpable as the pulse. The velocity of the pulse wave is independent of blood flow velocity, significantly exceeds it, and is approximately 4 m/s in the aorta, 8 m/s in large arteries, and 16 m/s in small arteries of young adults. Consequently, the pulse is felt in the radial artery at the wrist 0.1 s after the peak of systolic ejection into the aorta (see Fig. 29-3). With Aging, arteries become stiffer, and the pulse wave travels faster.
Pulse strength is determined by pulse pressure and depends little on mean pressure. The pulse is weak (thready) in Shock and strong when stroke volume increases, such as during physical exertion or following histamine administration. When pulse pressure is high, pulse waves can be pronounced enough to be perceived by the individual (palpitations). In aortic regurgitation, the pulse is particularly forceful, and the power of systolic ejection may be sufficient to cause HEAD-bobbing with each heartbeat. The pulse in aortic insufficiency is referred to as a collapsing pulse, Corrigan's pulse, or a Water-hammer pulse. A water-hammer was a nineteenth-century novelty toy consisting of a sealed Glass tube partially evacuated of air and half-filled with water; when held in the hand and inverted, it produces a sharp, heavy thud.
The dicrotic notch is a minor deflection on the descending limb of the pulse curve caused by the closure of the aortic valve (see Fig. 29-3). It is detectable on pulse tracings, though not palpable at the wrist. A dicrotic notch is also visible on the pulmonary artery pressure curve, where it results from the closure of the pulmonary valve.
Atrial Pressure Changes and the Jugular Venous Pulse
Atrial pressure rises during atrial systole and continues to increase during isovolumetric ventricular contraction as the AV valves bulge into the atria. After the AV valves are pulled downward by contracting ventricular myocardium, atrial pressure drops rapidly, and then rises again due to venous inflow into the atria until the AV valves open at the onset of diastole. The relaxation and return of the AV valves also contribute to the pressure rise by reducing atrial capacity. Changes in atrial pressure are transmitted to the large veins, producing three characteristic waves on the jugular venous pressure tracing (see Fig. 29-3). The *a* wave is caused by atrial systole. As noted above, during atrial contraction, some blood flows backward into the large veins despite the narrowing of their orifices. Furthermore, venous return momentarily ceases, raising venous pressure and contributing to this wave. The *c* wave arises from the rise in atrial pressure caused by the bulging of the tricuspid valve into the atrium during isovolumetric ventricular contraction. The *v* wave reflects the buildup of atrial pressure just before the tricuspid valve opens during diastole. The jugular pulse waves are superimposed on respiratory fluctuations in venous pressure: venous pressure drops during inspiration due to increased negative intrathoracic pressure and rises during expiration.
Examination of jugular venous pulsations in the recumbent position can provide valuable clinical information. For instance, in tricuspid regurgitation, a prominent *c* wave appears with every ventricular systole. In complete heart block, where atria and ventricles beat at different rates, *a* waves are observed that are dissociated from the radial pulse, along with a giant *a* wave (cannon wave) occurring whenever the ventricles contract against a closed tricuspid valve. Jugular pulse analysis can also differentiate atrial premature beats from ventricular ones, as premature atrial contractions produce an *a* wave, whereas ventricular ones do not.
Heart Sounds
Normally, two main acoustic manifestations of Cardiac Activity can be auscultated with a stethoscope during each cardiac cycle. The first sound (S1) is a low-pitched, slightly prolonged "lub" caused by vibrations from the sudden closure of the mitral and tricuspid valves at the beginning of ventricular systole (see Fig. 29-3). The second sound (S2) is shorter and higher-pitched ("dup"), resulting from vibrations generated by the closure of the aortic and pulmonary valves immediately after systole ends. A soft, low-pitched third heart sound (S3) is audible during early diastole (occupying roughly its first third) in many young individuals. It coincides with the period of rapid ventricular filling and is caused by vibrations from the sudden inflow of blood. A fourth heart sound (S4) is occasionally heard just before the first sound in cases of elevated atrial pressure or reduced ventricular compliance, such as ventricular hypertrophy. It is associated with atrial contraction filling the stiffened ventricle and is rarely audible in healthy adults.
The first sound has a duration of 0.15 s and a frequency of 25–45 Hz. It is soft at low heart rates because the ventricles are well-filled and the AV valves drift closed smoothly before systole. The second sound lasts 0.12 s with a frequency of 50 Hz. It becomes loud and sharp with elevated diastolic pressure in the aorta or pulmonary artery, which accelerates the closure of the respective valves at the end of systole.
The time interval between the closure of the aortic and pulmonary valves during inspiration is sufficient to cause splitting of the second sound (physiological splitting of S2). This splitting can also occur As a result of various pathological conditions. The third sound lasts for 0.1 s.
Murmurs
Murmurs are abnormal heart sounds heard over various regions of The Cardiovascular system. As described in Chapter 30, blood flow is laminar and silent until a critical velocity is reached. If velocity exceeds this critical threshold (or in the presence of an obstruction), flow becomes turbulent. Laminar flow is silent, whereas turbulence generates murmurs. Blood flow accelerates in narrowed arteries or deformed heart valves.
Examples of murmurs originating outside the heart include a bruit over a large, highly vascular goiter; a carotid bruit caused by atherosclerotic narrowing and distortion of the lumen; and murmurs associated with an aneurysm of a large artery, an arteriovenous fistula, or a patent ductus arteriosus.
The principal, though not exclusive, cause of cardiac murmurs is heart valve disease. When an atrioventricular orifice is narrowed (stenosis), blood flow through it accelerates and becomes turbulent. If valve leaflets fail to close completely (valvular incompetence or regurgitation), blood flows backward through the narrowed gap, accelerating flow velocity. Whether a murmur caused by stenosis or incompetence of a specific valve (Table 29-2) occurs in systole or diastole can be determined based on the mechanical events of the cardiac cycle. Valvular murmurs are best heard when the stethoscope is placed over the corresponding valve area. For instance, murmurs of pulmonary and aortic valve lesions are typically heard best at the Base of the heart, whereas mitral murmurs are best auscultated at the cardiac apex. To identify the specific valve lesion responsible for a murmur, one must consider its timing, duration, pitch, configuration, and radiation. One of the loudest murmurs occurs during diastolic backflow through an incompetent aortic valve. Most murmurs can only be heard with a stethoscope, but this high-pitched, musical diastolic murmur is sometimes audible without a stethoscope at a distance from the patient.
In patients with congenital ventricular septal defects, left-to-right shunting generates a systolic murmur. Soft murmurs may also be auscultated in patients with atrial septal defects, though they are not always present.
Soft systolic murmurs are frequently heard in individuals with structurally normal hearts. They also occur in patients with anemia, caused by decreased blood viscosity and increased flow velocity (see Chapter 30).
Echocardiography
Wall motion and several other features of cardiac function can be evaluated using echocardiography, a non-invasive technique that requires no injections or catheterization. During echocardiography, a transducer emits 2.25 MHz ultrasound pulses and detects their reflections from various cardiac structures. Reflections occur whenever acoustic impedance changes. Echo signals are displayed on an oscilloscope as a function of time, providing a record of ventricular wall, septal, and valvular motion throughout the cardiac cycle. Combined with Doppler Ultrasonography, echocardiography enables the measurement of blood flow velocity and volume across cardiac valves. It is of paramount clinical importance, particularly in patients with valvular heart disease.
Last update: 10/08/2026
Editorial and Educational Adaptation: This material has been compiled based on the primary/original source text. The project team performed an editorial review, corrected technical inaccuracies, structured sections, and adapted the content for an educational format.
What was processed:
- elimination of formatting defects (OCR errors, structural breaks, corrupted characters);
- editorial organization of content;
- standardization of terminology in accordance with academic sources;
- verification of factual statements against the original source text.
All mentions of the author, publication year, and origin of the primary text have been preserved in accordance with the source.