Biochemistry - Chemical Reactions in Living Cells, Volume 3 - D. Metzler 1980
Light in Biology
Absorption of Light by Matter
Electronic Spectra
Ultraviolet (UV) and visible region spectroscopy is widely utilized in biochemistry. On the electromagnetic spectrum scale, visible light spans from ~12,000 cm-1 (800 nm) to 25,000 cm-1 (400 nm). The ultraviolet region follows; the maximum frequency still used in standard spectrophotometers is ~55,000 cm-1 (180 nm). The energy values corresponding to visible and ultraviolet light range from ~140 to ~660 kJ mol-1. Notably, the latter value exceeds the energy of any bond, with the exception of the strongest double and triple bonds (Table 3–6). This explains the ability of UV radiation to initiate photochemical reactions. Even red light, with its relatively low energy, is utilized by plants in Photosynthesis and carries sufficient energy per 1 Einstein to drive ATP generation, NADP+ reduction, and A number of other photochemical processes. Although the energy of light absorbed during electronic transitions is quite large, the molecular geometry in the excited and ground states generally differs very little. In general, the amplitude of vibrations increases and the Molecular dimensions expand slightly in one or more directions. The value of Spectrophotometric Methods for biochemical research is partly due to the high sensitivity of molecular electronic energy levels to their immediate environment. The precision and high sensitivity of spectrophotometers significantly expand the capabilities of electronic spectroscopy. Related techniques—such as Circular Dichroism and fluorescence—are also applied universally. The presence of strongly absorbing chromophores in Proteins, Nucleic Acids, Coenzymes, and many other biochemical compounds further enhances the popularity of all these methods.
a. Shape of absorption bands
Electronic absorption bands are generally quite broad: their width, measured at half-maximum, is 3000–4000 cm-1. This is primarily because electronic excitation is accompanied by the transition of the molecule to higher vibrational and rotational sublevels. The heterogeneity of the molecular environment in solution also contributes to band broadening. To a certain approximation, the shape of absorption bands is governed by the Franck-Condon principle.
Since the frequency of light absorbed during electronic transitions is ~1015–1016 s-1, absorption takes place within 10-15–10-16 s (the time equivalent to the passage of a single light wave). During this period, the nuclei manage to shift only very slightly, since their vibrational frequency is much lower than the specified value. The Franck-Condon principle states that no significant changes occur in the positions of a molecule's atomic nuclei during an electronic transition. Let us examine Fig. 13-5, which depicts Two Types of potential energy curves for molecules in the excited state [5]. In the first case, the molecular geometry in the ground and excited states is nearly identical. It is important to remember that at room Temperature, the majority of molecules reside at the lowest energy levels, at least for most vibrational states 
Class="center">
FIG. 13-5. Typical potential energy curves for two types of banded spectra. A. Equilibrium internuclear distances re in the ground and excited states are approximately equal. B. r'e (excited state) > re (ground state). ([5], p. 179).
Thus, in the case of Fig. 13-5A, the most probable transitions originate from the lowest vibrational sublevels of the ground electronic state. The most probable internuclear distance of a diatomic molecule in the ground state is equal to the equilibrium value re (Fig. 13-2). Since this distance is the same for all vibrational sublevels of the excited electronic state, the transition can occur to any of these states, but a transition to the first vibrational sublevel of the excited state is the most probable. As a result, we obtain an absorption spectrum that features, alongside an intense sharp line corresponding to the "0–0 transition," weaker lines corresponding to the 0–1, 0–2, 0–3, etc., transitions (Fig. 13-5A).
The second type of spectrum is illustrated in Fig. 13-5B. In this case, the internuclear distance increases during the transition of the molecule to the excited state—re turns out to be larger than in the ground state. According to the Franck-Condon principle, the most probable transitions will be to those vibrational sublevels of the excited state for which the internuclear distance is, for the greater part of the time, approximately equal to the re value in the ground state. It is clear from Fig. 13-5B why the 0–0 transition in the absorption spectrum in this case corresponds to a less intense line than transitions to higher levels.
Actually observed absorption spectra, particularly those of polyatomic molecules, are of a much more complex nature. One of the complicating factors is that some molecules in the ground state reside on higher vibrational sublevels corresponding to low-energy modes of vibration. Consequently, weaker lines appear in the spectrum, located also on the low-energy side of the 0–0 transition. Since polyatomic molecules possess several normal modes of vibration, additional bands appear between those depicted in Fig. 13-5. All these bands are broadened due to molecular rotation and their interaction with the solvent.
An example of a compound with this type of spectrum is toluene (methylbenzene). The vapor spectrum of toluene contains A large number of sharp lines—some of which are visible
even in a low-resolution spectrum (Fig. 13-6). Several series of consecutive lines can be identified [22]. One of them begins with an intense line characterized by a wave number of 37.48 kK, which corresponds to the 0–0 transition; the spacing between adjacent lines, equal to ~930 cm-1, corresponds to vibrations leading to symmetrical expansion and compression ("breathing") of the ring—these vibrations can be detected by recording the infrared spectrum of the compound. Other series, starting with the line corresponding to the 0–0 transition, correspond to vibrations with frequencies (in the excited electronic state) of 460, 520, and 1190 cm-1. Weaker bands in the spectrum presented in Fig. 13-6 are "hidden" in the regions between the maxima.

FIG. 13-6. Toluene vapor spectrum corresponding to the transition to the first electronically excited state, recorded at low resolution on a Cary 1501 spectrophotometer.
When recording the absorption spectrum of toluene in solution, the sharp lines broaden, but the vibrational Structure does not completely disappear. As seen from Fig. 13-7, the spectra of phenylalanine and its derivatives [22] closely resemble that of toluene (the 0–0 transition corresponds to a frequency of 37,310 cm-1); the vibrational STRUCTURE OF THE phenylalanine spectrum is clearly manifested in the spectra of many proteins (see, for example, Fig. 13-14). The absorption spectrum of Tyrosine has a similar appearance (Fig. 13-7), but in this case, the line corresponding to the 0–0 transition is shifted toward lower energies (~35,300 cm-1 in Water). Line series with intervals of 1200 and 800 cm-1 are clearly visible [23].
To describe the shape of an individual electronic band, a Gaussian curve (normal distribution) is frequently used as an envelope for its vibrational components. In some cases, such as for the blue copper protein from Pseudomonas (Fig. 13-8), representing the bands as Gaussian curves proves entirely adequate and allows the spectrum to be resolved into components corresponding to specific electronic transitions. Each transition is characterized by THE POSITION OF its maximum, its height (molar extinction), and its width (measured at half-maximum in cm-1). However, absorption spectra of Organic compounds are generally asymmetrical—they are skewed toward higher energies1). An asymmetrical function, such as a log-normal distribution [24, 25], is better suited for describing these bands. In addition to the peak position, height, and width, a fourth parameter is introduced as a measure of peak Asymmetry. Computer-aided fitting of log-normal curves makes it possible to precisely determine the peak positions, widths, and amplitudes. Note that this method of peak localization typically leads to a slight shift of the 0–0 transition line toward higher energies. Peak widths may vary, but most commonly range from 3000 to 4000 cm-1.
1) Absorption spectra are presented as Functions of wavelength. Although Gaussian curves sometimes fit these spectra quite well, expressing band widths in nanometers is undesirable. The quantity proportional to energy is the wave number. If spectral bands are plotted as a function of wave number rather than wavelength, their widths in the visible and ultraviolet regions will be approximately equal.

FIG. 13-7. Absorption spectra of N-acyl derivatives of ethyl esters of Tryptophan (I), tyrosine (II), phenylalanine (III), and cystine dimethyl ester (IV) in methanol at 25 °C, corresponding to transitions of these compounds to the first electronically excited state. The spectra of tyrosine, phenylalanine, and cystine derivatives are multiplied by factors of 2, 20, and 4, respectively [41].
Another valuable approach to the quantitative analysis of spectra is based on describing each vibrational band with its own Gaussian curve [26, 27].
b. Classification of transitions
The intense absorption band in the 600 nm region of THE SPECTRUM OF the copper-containing protein, whose solution has a blue color (Fig. 13-8), is attributed to a d–d transition of an electron belonging to the metal ion [28]. The high intensity of the band may be due to a bond between the metal ion and the sulfur atom of a Methionine residue within the protein [29]. Electronic transitions in most organic molecules belong to a different type. Transitions with frequencies <55,000 cm-1 are classified either as n–π* or π–π* transitions. In the former case, an electron transitions from a bonding π orbital to an antibonding π* orbital. In Ethylene, such a transition is observed at a frequency of 61,540 cm-1 (162.5 nm); the maximum molar extinction value εmax is ∼15,000 M-1 cm-1. n–π* transitions are caused by the promotion of a lone-pair electron of an oxygen or nitrogen atom to an antibonding π* orbital and are very weak. For example, the n–π* transition for acetone in H2O  = 37,740 cm-1, λmax = 265 nm) is characterized by an εmax value of ~240; the band width is ~6400 cm-1. A characteristic feature of the n–π* transition is a strong shift of the absorption band toward lower energies when transferring the compound from water to a less polar solvent. Thus, the absorption maximum of acetone in methanol corresponds to
  cm-1, and in hexane to 35,970 cm-1 (278 nm). Such a solvent-induced shift is considered a "hallmark" of the n–π* transition, often assuming that bands corresponding to n–π* transitions shift in the opposite direction upon changing the solvent nature. However, this is not true for many polar chromophores present in biochemical compounds. Thus, the n–π* bands of tyrosine also shift to lower energies when this compound is transferred from water to hexane. Admittedly, the magnitude of the shift is much smaller than that for the n–π* band of acetone.
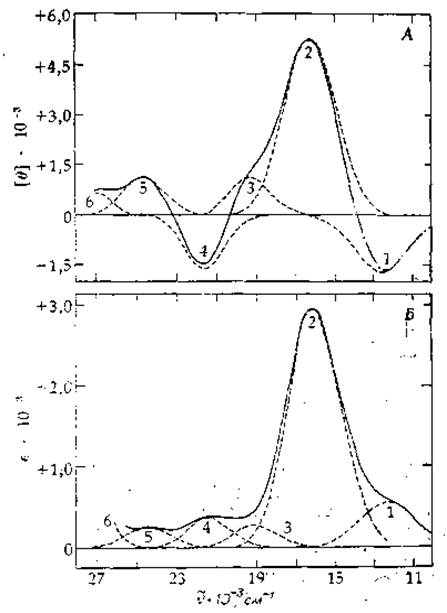
FIG. 13-8. Resolution of the visible CD (A) and absorption (B) spectra of the Pseudomonas blue protein into several overlapping Gaussian curves corresponding to individual spectral bands (dashed lines). Numbers 1 through 6 designate bands that occupy identical positions and have identical widths in both spectra. Solid lines represent the sum of the Gaussian curves. Each such envelope matches the experimentally recorded spectra within experimental error. The dash-dotted portion of the envelope on the CD spectrum above 700 nm is drawn according to the shape of band I in the absorption spectrum [28].
A molecule can undergo transitions not only to the first but also to higher energy levels. Thus, in benzene and its derivatives, three π–π* transitions are readily detected (Fig. 13-9). The first is represented by a weak band with ε = 102–103. The second band corresponds to a higher frequency (1.35 ± 0.10 times the frequency of the first band) and is characterized by εmax up to 104. The third band corresponds to even higher energy, with εmax reaching 5 × 10⁴. The energy levels corresponding to these transitions are designated, according to the widely used Platt notation system, as 1Lb, 1La, and 1Ba. Other authors describe these levels based on molecular orbital Symmetry. For instance, the ground state is denoted as 1A1g, and the three excited states as 1B2u, 1B1u, and 1E1u. The superscript 1 indicates that the excited state in question is singlet, meaning that the electrons remain paired in the excited state (absorption of visible and ultraviolet light almost always promotes a molecule to a singlet excited state). For more complex cyclic systems, the number of possible transitions increases. Attempts are frequently made to correlate these transitions with those in benzene.
Intensities corresponding to electronic transitions vary widely. The area of the absorption band (A) on a plot of ε versus wave number  is directly proportional to a dimensionless quantity called the oscillator strength f:


FIG. 13-9. Spectrum of N-acetyltyrosine ethyl ester in an aqueous phosphate buffer, pH 6.8. Note the three n—π* transitions of increasing intensity. The third n—π* transition of the aromatic ring corresponds to vmax≃52,000 cm-1, with the molar extinction coefficient reaching a value of ~40,000. The Absorption in the high-energy region of the spectrum is also contributed to by the n—π* and n—π* transitions of the amide group in this compound.
In this equation, mе and e are the mass and charge of the electron, respectively, c is the speed of light, N is Avogadro's number, A is the band area on the plot of ε versus  in cm-1; F represents a dimensionless correction factor associated with the refractive index of the medium, which is very close to unity for aqueous solutions. If the absorption band is approximated as a triangle with a height εmax and a base equal to the band width W (measured at half-maximum), then for a typical absorption band with εmax = 104 and W = 3,000 cm-1, we obtain f = 0.13.
According to absorption theory, the oscillator strength is related to the transition probability and approaches unity only for the strongest electronic transitions. Such a high oscillator strength is rarely observed. For instance, it is ~10-4 for Cu2+, and ~2·10-3 for the absorption band of toluene shown in Fig. 13-6. The low intensity of the absorption bands in benzene derivatives is due to the fact that these transitions are forbidden in ideally symmetrical molecules. The 1Lb transition in benzene becomes only weakly allowed as a result of coupling with asymmetric ring vibrations. In the benzene spectrum, the 0—0 transition line is absent; only the subsequent lines corresponding to additional energy absorption from asymmetric vibrations equal to 520 cm-1 are allowed. Due to the asymmetry of the toluene and phenylalanine rings caused by the presence of substituent groups, the 0—0 transition becomes allowed, and the oscillator strength assumes a higher value than that of benzene. The 1La transition in benzene derivatives is also partially forbidden by Selection rules, and only for the third band does the oscillator strength approach unity.
b. Polarization of Transitions
The transition probability is directly related to the transition dipole moment (or simply the transition moment)—a vector quantity that depends on the dipole moment of the molecule in its ground and excited states. For aromatic cyclic systems, the dipole moment vectors of n—π* transitions lie in the plane of the ring. However, their direction and magnitude vary for different n—π* transitions.
The transition dipole moment has the dimension of length (usually expressed in angstroms); it can be viewed as a measure of charge displacement during the transition. Light is absorbed most efficiently when the direction of its polarization (i.e., the direction of the electric field vector) and the direction of the transition moment coincide. This is easy to verify by measuring Light absorption in crystals. Like the infrared absorption spectra of oriented peptide chains (Fig. 13-3), the electronic spectra of crystals exhibit pronounced dichroism.
Unlike n—π* transitions, n—π* transitions in heterocyclic compounds and carbonyl-containing rings are frequently polarized in a direction perpendicular to the ring plane.
c. Relationship of the Absorption Band Maximum and Intensity to Compound Structure
Although quantum mechanical calculations make it possible to predict the number of absorption bands and roughly indicate their positions, they do not provide the necessary accuracy for interpreting spectra. Therefore, electronic spectroscopy makes widespread use of empirical rules and spectral atlases to facilitate comparative analysis [30, 31]. The following guidelines will help the reader navigate this field. The position of an absorption band undergoes a bathochromic shift (toward longer wavelengths and lower energies) as the number of conjugated double bonds increases. For example, the absorption maximum of butadiene corresponds to 46,100 cm-1 (217 nm), and that of ethylene to 61,500 cm-1. As the number of double bonds increases further, the bathochromic shift becomes progressively smaller (though it remains nearly constant when measured in wavelengths rather than wave numbers). For lycopene (Fig. 12-14), which contains 11 conjugated double bonds, the absorption band is located at 21,300 cm-1 and exhibits a distinct vibrational structure (Fig. 13-10). The spectra of certain cyclic molecules, such as Porphyrins and chlorophylls, can be correlated with the spectra of linear polyenes. Note (Fig. 10-2) that the a- and ß-bands of porphyrin are Components of the vibrational structure of the same electronic transition, whereas the intense Soret band arises from a different transition.
The absorption bands of substituted benzene rings are almost always shifted toward lower energies relative to the absorption band of the parent hydrocarbon. The stronger the electron-withdrawing or electron-donating ability of the substituent groups, the greater the bathochromic shift. The magnitude of the shift correlates with the Hammett constant σ. Thus, the first absorption band of tyrosine in water is shifted by 2,600 cm-1 to the red compared to the benzene band, whereas for the dissociated tyrosine anion the shift is 4,700 cm-1—to a very rough approximation, the shift is indeed proportional to σp (Table 3-9). An especially large shift is observed when Functional groups of opposite character (e.g., electron-donating and electron-withdrawing) are present in the same ring. The Effect of substituent pairs in the ortho and meta positions is roughly the same (unlike METABOLISM/18.html">The Influence of these substituents on reactivity). When substituent groups are in the para position, the spectral shifts turn out somewhat differently. In the presence of more than two substituent groups, the character of the spectrum is determined primarily by the two groups exerting the strongest influence. Useful empirical rules can be found in [32] and [33].

FIG. 13-10. Absorption spectrum of lycopene. Note its vibrational structure in the region of ∼1200–1500 cm-1.
The solid line corresponds to all-trans-lycopene, and the dashed line to the same sample after standing for 45 min in the dark. Note the appearance of a maximum at ~360 nm, caused by The formation of isomers containing cis double bonds.
d. Spectra of Nucleic Acids and Proteins
Most proteins feature an intense absorption band with a maximum at 280 nm (35,700 cm-1), which is due to the presence of the aromatic Amino Acids tryptophan, tyrosine, and phenylalanine [34]. The band shape is determined with a high degree of accuracy by the absorption band shapes of these aromatic amino acids, taking into account their relative content in the protein. The absorption spectra of simple amide derivatives of phenylalanine, tyrosine, and tryptophan in this region are shown in Figs. 13-7 and 13-9. The low-energy band of tryptophan corresponds to two overlapping 1La and 1Lb transitions [26]. The band corresponding to the 1Lb transition has a well-defined vibrational structure, whereas the 1La band is more diffuse. The maximum of the 0—0 bands for both transitions in tryptophan derivatives dissolved in hydrocarbon Solvents is ∼289.5 nm (34,540 cm-1). However, in proteins, the 1La band can be shifted by 3–10 nm (by ∼1100 cm-1) toward lower energies. This shift is apparently the result of hydrogen bonding with other protein groups. The largest shift is observed when the NH group of the indole ring forms a Hydrogen bond with a COO- group, a Histidine ring nitrogen atom, or an amide carbonyl group [35]. In an aqueous environment, the 1Lb absorption band of tryptophan shifts toward higher energies, while the 1La band shifts toward lower energies relative to the corresponding bands in a hydrocarbon solvent. As can be seen from Fig. 13-7, THE CONTRIBUTION OF tryptophan residues to Protein Light Absorption far exceeds that of an equivalent number of tyrosine or phenylalanine residues. Thus, tryptophan absorption is dominant for most proteins.

FIG. 13-11. Near-UV absorption spectra of cytidine (A) and uridine (B). I — monoprotonated form of cytidine (pKa = 4.2); II — neutral forms (pH~7); III — monoanionic form of uridine (pKa = 9.2).
In addition to the three aforementioned aromatic amino acids, Disulfide Bonds also absorb in the near-ultraviolet region (Fig. 13-7). Since the characteristics of this process depend on the dihedral angles formed by the disulfide bridges, determining the exact contribution of this chromophore to the band with λmax = 280 nm is quite difficult.
It should be borne in mind that tyrosine, tryptophan, and phenylalanine also possess absorption bands in the high-energy portion of the protein UV spectrum. An even greater contribution to protein absorption in this region comes from amide groups; this contribution becomes significant at values greater than 45,000 cm-1. A weak n—π* transition with vmax = 47,500 cm-1 (λmax = 210 nm) is observed here, overlapping with a strong n—π* transition characterized by λmax ≃ 52,600 cm-1 (λmax = 190 nm). The absorption bands of histidine are also located in this region.
As in the case of Polypeptides, the absorption spectra properties of polynucleotides reflect the SPECTRAL PROPERTIES OF their components. Figures 13-11 and 13-12 present the absorption spectra of purine and pyrimidine ribonucleosides. The number of individual electronic transitions is not precisely known, and their nature is far from obvious, despite numerous attempts to decipher these spectra and correlate them with one another [36]. The same can be said of flavins, whose absorption spectra contain at least four intense transition bands (Fig. 8-16) [37].
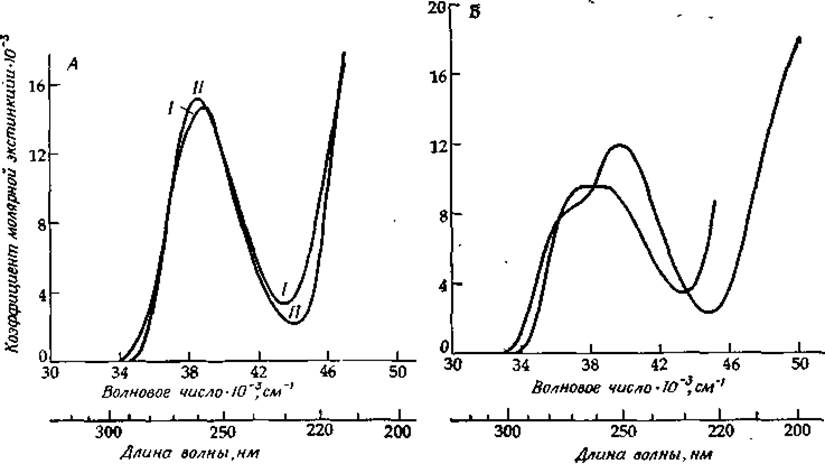
FIG. 13-12. UV absorption spectra of adenosine (A) and guanosine (B). I — monoprotonated form of adenosine (pKa = 3.5); II — neutral forms; III — monoanion of guanosine (pKa = 9.2).
While the maximum of the low-energy absorption band in proteins corresponds to λ ≃ 280 nm, for polynucleotides λmax = 260 nm (38,500 cm-1). When studying the Optical Properties of nucleic acids, the hypochromic effect is a particularly important characteristic. Whereas the absorption of a denatured polynucleotide is approximately equal to the sum of the absorptions of its individual components, formation of a double-stranded structure with base stacking leads to a 34% decrease in absorption at 260 nm. This phenomenon forms The basis of the optical method for studying polynucleotide melting (Fig. 2-28). The physical Nature of the hypochromic effect lies in the interaction between closely stacked Base Pairs (stacking interaction) [38].
e. Difference spectroscopy
It is often necessary to study Changes in the light absorption of proteins or NUCLEIC ACIDS AS a function of such factors as pH, temperature, ionic environment, and the presence or absence of other interacting molecules. Because the resulting spectral shifts are typically small, it is common practice to measure the difference between two spectra: the “unperturbed” spectrum and the spectrum recorded in the presence of a “perturbing agent.” The latter can be a reagent added to the solution (e.g., glycerol, D2O, etc.), as well as pH or temperature. The difference spectrum shown in Fig. 13-13.5 arises from the binding of the catalytic subunit of aspartate transcarbamylase (ch. 4, sec. D, 8) to the inhibitor succinate and the substrate carbamoyl phosphate [39]. This spectrum is characterized by two peaks and a broad minimum in the absorption region of aromatic amino acids. When properly interpreted—an absolute prerequisite—such difference spectra can provide valuable insight into microenvironmental changes surrounding the aromatic amino acid residues within a given protein [40].
Difference spectra are typically recorded by passing two light beams through two meticulously matched cuvettes: one beam through the reference cuvettes, and the other through the sample cuvette. However, the spectrum presented in Fig. 13-13.5 was obtained by independently recording two spectra (with data output onto punch cards) and subsequently subtracting one from the other using a computer. The same data can also be represented differently: a log-normal curve is fitted to each absorption band (sec. B, 4, a), and the difference between the smoothed curve and closely spaced experimental points is then plotted [41], as shown in Fig. 13-13.5. The two graphs obtained in this manner reveal the Fine Structure of the spectrum. This is essentially an alternative way of generating a difference spectrum. The advantage of this method is that computer-assisted curve fitting provides insight into the shape of the absorption band itself. As is readily apparent, the binding of succinate and carbamoyl phosphate induces a slight shift (20 cm-1) in the absorption band along with very minor broadening. The primary effect is a better resolution of the vibrational structure of the 0—0 band at 34,600 cm-1, which is due to the absorption of two tryptophan residues present in the enzyme subunit. The exact cause of this change, however, remains not fully understood, highlighting the inherent limitations of difference spectroscopy.
Last update: 06/08/2026
Editorial and Educational Adaptation: This material has been compiled based on the primary/original source text. The project team performed an editorial review, corrected technical inaccuracies, structured sections, and adapted the content for an educational format.
What was processed:
- elimination of formatting defects (OCR errors, structural breaks, corrupted characters);
- editorial organization of content;
- standardization of terminology in accordance with academic sources;
- verification of factual statements against the original source text.
All mentions of the author, publication year, and origin of the primary text have been preserved in accordance with the source.