Biochemistry - Chemical Reactions in Living Cells, Volume 3 - D. Metzler 1980
Light in Biology
Light Absorption by Matter
Circular Dichroism and Optical Rotary Dispersion
The circular dichroism of a sample arises from the difference between the molar extinction coefficients for right- and left-circularly polarized light [Equation (13-7)]; it is observed exclusively in chiral molecules:
Class="center">
The value of ∆ε can be measured directly using a dichrograph. The circular dichroism (CD) spectrum often resembles the absorption spectrum of a given sample because the peak positions coincide in both cases. However, CD can be either positive or negative, and it may be positive for one transition and negative for another (Fig. 13-8). Plots representing ∆ε as a function of wavelength or wavenumber are finding increasingly widespread application. Molar ellipticity is frequently used in the literature:


FIG. 13-13. A. Absorption spectrum of the catalytic subunit of aspartate transcarbamylase (crosses) with fitted log-normal curves (solid lines). B. Difference between the absorption spectrum of the enzyme in the presence of 0.09 M succinate and 4.3 mM carbamoyl phosphate and spectrum A (cf. the difference absorption spectrum of the intact aspartate transcarbamylase given in reference [39]). C. Curve I: the "fine Structure" revealed after subtracting spectrum A from the smoothed curve obtained by summing two log-normal curves. Curve II: the same spectrum for the enzyme + succinate + carbamoyl phosphate. The enzyme was provided by J. Nagel and G. Schachman, and the spectrum was recorded by Y.-I. Yang.
The rotational strength of a band in a CD spectrum is determined by the expression

Integration is performed over the entire absorption band corresponding to the given transition.
Circular dichroism is closely related to optical rotatory dispersion, which is the variation of optical rotation with wavelength. Optical rotation results from the difference in refractive indices (nL - nR) for left- and right-circularly polarized light. Rotation α is measured in degrees or radians. Typically, all data are presented as specific rotation, i.e., rotation relative to a hypothetical solution containing 1 g ∙ mL-1 of the substance in a 1-dm polarimeter Cell. Knowing the rotation, the concentration c' (in g∙mL-1), and The Cell path length l' (in dm), the specific rotation can be calculated using the formula

Molecular rotation is given by expression (13-11):

Here M is the molecular weight, while c and l are measured in mol∙L-1 and cm, respectively. To account for a small correction for the polarizability of the field acting on the molecules, the factor 3/(n2 + 2) is introduced. Rotation in radians per centimeter of optical path can be expressed directly in terms of the wavelength and the refractive indices nL and nR:

Unlike circular dichroism, optical rotatory dispersion (ORD) extends into the spectral region far from the absorption bands of the sample. As an absorption band is approached, the optical rotation increases in either the positive or the negative direction. Then, within the absorption band itself, it drops sharply to zero and subsequently takes on the opposite sign (the Cotton effect). Although the presence of optical rotation in regions where the substance does not absorb is a distinct advantage of the ORD method, ORD spectra are somewhat more difficult to interpret. In principle, the data obtained using these Methods are interdependent, and in both cases we acquire the same type of chemical information. Because recording CD and ORD spectra is straightforward, and owing to their sensitivity to conformational changes and variations in the medium's composition, both methods are widely used in biochemistry.
As an example, let us examine the CD spectrum of a copper-containing protein (Fig. 13-8). The CD in the region of the d—d absorption bands of copper is partly due to the Asymmetry of the copper ion environment within the Protein Structure. The same cause underlies the circular dichroism of aromatic Amino Acids in Proteins, which is frequently observed. For Tyrosine, the sign of the CD can be either positive or negative, but it remains constant throughout the entire absorption band. As a result, CD bands are similar in shape to absorption bands [19, 46]. Phenylalanine behaves in a more complex manner. Vibrational bands following the 0–0 band at intervals of 930 cm-1 have the same sign, and their intensities relate to the intensity of the 0–0 band in the same way as in the absorption spectrum. However, vibrations whose wavenumbers equal the wavenumber of the 0–0 band plus 180 and 520 cm-1 sometimes give rise to CD bands of opposite sign, with different intensity ratios [22, 46]. Thus, the CD spectrum may prove to be more complex and harder to interpret than the absorption spectrum of the same chromophore.
It is not uncommon for the binding of a symmetric chromophore to a protein or nucleic acid molecule to induce CD in that chromophore. For instance, enzyme-bound Pyridoxal phosphate or pyridoxamine phosphate (Fig. 8-8) exhibits a positive CD band, whereas the band of the quinonoid intermediate with Vmax = 20,400 cm-1 (490 nm) is characterized by a negative CD. This remarkable phenomenon suggests that the CD spectrum of a chromophore contains specific information about its microenvironment, although no simple interpretation has yet been found.
The dichroism of n—π* transitions in carbonyl compounds is easier to interpret. In this case, a set of rules known as the octant rules allows one to predict the sign and magnitude of the CD for simple molecules [47]. A theoretical approach to analyzing the CD and absorption spectra of proteins in the high-energy UV region has also been developed. Within regular β-structures, α-helices, and crystalline domains, electronic transitions of adjacent amide groups can couple, resulting in the delocalization of excitation. Such delocalization (exciton formation) leads to splitting (Davydov splitting) into two transitions with different energies and polarization directions [7, 44]. For example, the amide absorption band with Vmax = 52,600 cm-1 splits into two components in the α-Helix, with Vmax = 48,500 and 52,600 cm-1. In addition, the low-energy n—π* and π—π* transitions are very close in energy, which can lead to The formation of a state representing a mixture of these two states, imparting rotational strength to the π—π* band of opposite sign to that in the n—π* band (see ref. [44]). Both the sign and the intensity of the CD bands depend on the conformation of the compound, making it possible to clearly distinguish between α-helices, β-structures, and random coils. In aqueous solutions, measurements are carried out at wavelengths extending down to the vacuum ultraviolet, i.e., up to wavenumbers of ~60,000 cm-1 [48].
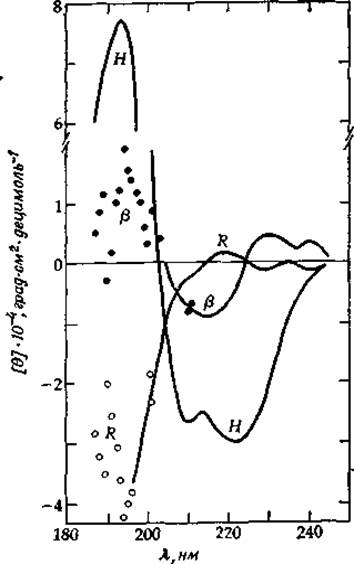
FIG. 13-14. Spectra for the helix (H), β-structure, and disordered coil (R) calculated from the CD spectra of five proteins. In regions where a smooth curve could not be drawn, data points are shown. [Chen Y.-H. et al., Biochemistry, 13, 3353 (1974).]
Despite all theoretical advances in predicting the shape of CD spectra, empirical comparisons of spectra from different compounds often prove more valuable. For instance, Fig. 13-14 shows the CD spectra of helices, β-structures, and disordered peptide chains calculated from measured spectra combined with structural analyses determined by X-ray crystallography [49]. Note the deep minimum at 222 nm in the CD spectrum of the α-helix, which is significantly less pronounced in the case of the β-structure. For the disordered structure, CD is almost entirely absent at this wavelength. The depth of this minimum is frequently used to estimate the helix content of a protein.
Some progress has recently been made in predicting the optical rotation of molecules based on quantitative polarizability data for individual atoms [50].
Last update: 06/08/2026
Editorial and Educational Adaptation: This material has been compiled based on the primary/original source text. The project team performed an editorial review, corrected technical inaccuracies, structured sections, and adapted the content for an educational format.
What was processed:
- elimination of formatting defects (OCR errors, structural breaks, corrupted characters);
- editorial organization of content;
- standardization of terminology in accordance with academic sources;
- verification of factual statements against the original source text.
All mentions of the author, publication year, and origin of the primary text have been preserved in accordance with the source.