Biochemistry - The Chemical Reactions of Living Cells, Volume 3 - D. Metzler 1980
Light in Biology
Light Absorption by Matter
Infrared Spectra
Absorption in the near-infrared region is determined by the transition of a molecule from one vibrational level to another. A typical frequency is that corresponding to the maximum of the "amide A" absorption band at 3300 cm-1 (wavelength 3.0 µm), which corresponds to approximately 1014 s-1. The analysis of infrared spectra usually begins by considering the stretching vibrations of a diatomic molecule. Let us imagine that the two nuclei of a molecule are connected by a spring. The vibrational energy of such a molecule can be treated as the energy of a harmonic oscillator. According to the quantum-mechanical approach, the oscillator energy takes on only discrete values, and the corresponding energy levels are spaced equally from one another by an amount equal to hv, where v is the frequency of the light quantum whose absorption raises the energy to the value corresponding to the next energy level. In the ground (unexcited) state, the molecule already possesses a "zero-point vibrational energy" equal to half the energy required for the transition to the next level.
The harmonic oscillator serves as a convenient model for describing The behavior of molecules residing solely in lower vibrational levels; in states with higher energy, substantial deviations from the model are observed. At lower energy levels, The change in the distance between atomic centers during vibrations is ±10%, whereas with increasing energy, this distance increases and the motion becomes anharmonic. The energy states of molecules are often depicted as Morse curves, which represent the dependence of energy on the internuclear distance (Fig. 13-2). When this distance becomes too small, the energy rises sharply. As the bond stretches, a point is reached where a further slight increase in energy leads to bond rupture and the dissociation of the diatomic molecule into atoms (or a more complex molecule into fragments). Vibrational energy levels are depicted as horizontal lines drawn at the corresponding heights on the Morse graph (Fig. 13-2).
Since each vibrational energy level corresponds to a multitude of rotational sublevels, infrared spectra appear as sets of absorption bands, which is caused by the simultaneous change in the vibrational and rotational energy of molecules. Thus, instead of discrete lines corresponding to transitions between vibrational levels, series of sharp, closely spaced lines are observed. An example of this is the absorption band corresponding to the stretching vibration of the H—Cl bond in gaseous HCl with a maximum at 2886 cm-1 (3.46 µm): in reality, it represents a set of nearly equidistant lines located on both sides of the specified fundamental frequency in the range from ~2600 to ~3100 cm-1. The distance between adjacent lines is ~21 cm-1, which corresponds to a rotational frequency residing in the microwave region of the electromagnetic spectrum (Herzberg [8], p. 55). When recording a spectrum with low resolution, a single broad band is observed1).
The interpretation of infrared spectra of diatomic molecules presents no special difficulty, but the absorption bands of more complex compounds can no longer be assigned to the vibrations of specific chemical bonds. In this case, one speaks of the fundamental (normal) vibrations of a molecule. Fundamental vibrations are those in which THE POSITION OF the center of mass of the molecule remains unchanged. For a molecule consisting of n atoms, the number of such vibrations is 3n—6. Although the vibration of a single bond often predominates here, the synchronized motion of many atoms is also possible. When describing the fundamental vibrations of a molecule, terms such as stretching, bending (in-plane or out-of-plane), torsion, and deformation are used. All 3n—6 bands in the infrared spectrum are observed quite rarely. This is explained partly by the fact that certain vibrations are not accompanied by A change in dipole moment (e.g., the symmetric stretch of the linear CO2 molecule). Other bands simply turn out to be too weak to be clearly recorded.
The frequency of vibrations involving many atoms of a molecule simultaneously—the so-called skeletal vibrations—typically lies in the region of 700—1400 cm-1 (14—7 µm). Meanwhile, the frequencies of vibrations determined mainly by specific functional groups usually amount to 1000—5000 cm-1 (10—2 µm). For instance, the stretching vibrations of C—H, N—H, and O—H bonds have characteristic frequencies equal, as a rule, to ~2900, 3300, and 3600 cm-1, respectively. Let us note several important facts. The energy (and frequency) of vibrations increases with a greater difference in the electronegativity of the two atoms forming the bond. The larger the mass of the atoms, the lower the frequency (e.g., the frequency of C—O vibrations in a primary alcohol is ~1053 cm-1). The vibration frequency of a double bond is higher than that of a single bond (thus, for the C=O bond, it is ~1700 cm-1; these stretching vibrations correspond to one of the most intense absorption bands in the infrared spectrum). Hydrogen bonding exerts a strong and highly characteristic effect: the frequency of the O—H bond vibration, which is ~3600 cm-1, decreases to 3500 cm-1 upon Hydrogen bond formation.
1) This is only one of the reasons for the broadening of absorption bands in the infrared region in solution; another is caused by interaction with the solvent, As a result of which the absorbing molecules reside in a non-equivalent environment.
Class="center">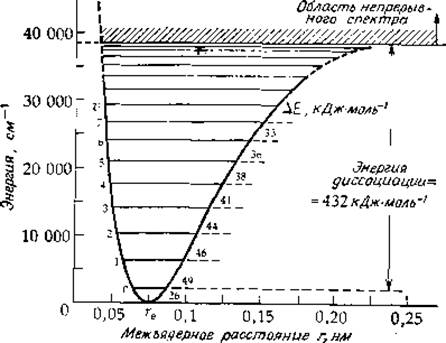
FIG. 13-2. Dependence of the potential energy of a hydrogen molecule on the internuclear distance; the vibrational Energy Levels of the molecule are indicated. ∆Е is the energy difference between adjacent energy levels; a are vibrational quantum numbers ([5], p. 135.)
According to the harmonic oscillator theory, only transitions from a given vibrational energy level to the adjacent higher level are allowed; however, for anharmonic oscillators, weak transitions to higher vibrational levels are possible. As a result, "overtones" arise whose frequency is approximately a multiple of the fundamental frequency. In addition, bands whose frequencies are equal to the sum or difference of the frequencies of individual infrared bands may be observed. These bands are very weak, but the fact that they lie in the relatively high-energy region of the near-infrared (4000—12 500 cm-1) makes it possible to detect them even more easily than the fundamental bands, which are located very close to one another in the infrared region.
a. Vibrational frequencies of amide groups
Since amide groups are present in Proteins as well as in purine and pyrimidine bases, their infrared absorption bands have attracted considerable attention. Among the multitude of absorption bands of this group (described in the book by Fraser and MacRae [11]), three bands are of particular interest.
The amide I band at ~1680 cm-1 corresponds to normal vibrations within the plane of the amide group and primarily to the stretching vibrations of the C=O bond. The amide II band at ~1500 cm-1 is also caused by in-plane vibrations, including the bending of the N—H bond, whereas the higher-frequency amide A band, equal to ~3450 cm-1, is due to the stretching vibrations of the N—H bond. The participation of the N—H group in hydrogen bond formation shifts the amide A band to ~3300 cm-1. The infrared spectrum of a protein [12], containing the amide A, amide I, and amide II bands, is shown in Fig. 13-3. Pay attention to the complex shape of the bands. The shape of the amide I band strongly depends on the conformation of the peptide chain. According to an empirical rule, the frequency of the amide group absorption band in a-helices is 20 cm-1 higher than the frequency of the corresponding bands in ß-structures. However, a more rigorous analysis of normal vibrations of peptide chains led to different Conclusions [11, 13—15].

FIG. 13-3. Infrared dichroism of Insulin fibrils. Solid line: electric field vector parallel to the fibril axis; dashed line: electric field vector perpendicular to the fibril axis. [Burke M. J., Rougvie M. A., Biochemistry, 11, 2437 (1972)].
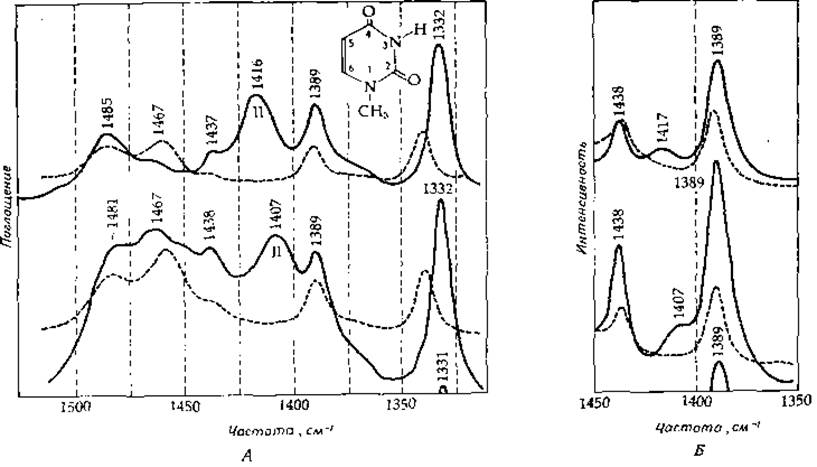
FIG. 13-4. Infrared (A) and Raman (B) spectra of 1-methyluracil in H2O (solid line) and D2O (dashed line). Spectra of regular 1-methyluracil (top) and its specifically labeled derivative containing 18O at position 4 (bottom) are shown [16].
One of the most widespread Methods FOR STUDYING oriented peptide chains is infrared dichroism. In this technique, protein absorption spectra are recorded for two mutually perpendicular directions of polarization of the incident light. In one case, the electric field vector is parallel to the peptide chains, and in the other, it is perpendicular to them. Such a pair of spectra for oriented insulin fibrils is shown in Fig. 13-3. It is believed that the insulin molecules in this case are in a ß-conformation and arranged transversely across the fibril axis (cross-ß-Structure). Thus, when the electric field vector is parallel to the fibril axis, it is perpendicular to the peptide chains. Since the amide I band is determined primarily by carbonyl group vibrations, which in a ß-structure are perpendicular to the peptide chains, the intensity of this band is greater when the electric field vector is also perpendicular to the peptide chains than when this vector is parallel to them (perpendicular to the fibril axis; Fig. 13-3). The same holds true for the amide A band, which is governed mainly by N—H bond stretching. The dichroism of the amide II band is of the opposite character, since here the determining role is played by the bending of the N—H bond, which occurs within the plane of the peptide group but in a longitudinal direction.
Infrared Spectroscopy has also found application in analyzing the absorption bands of pyrimidine amide groups [16]. Fig. 13-4, A shows THE SPECTRUM OF 1-methyluracil in H2O and D2O. Note that in D2O the amide II band is completely absent. This illustrates yet another application of infrared spectroscopy, which has proven particularly useful in studying proteins. The disappearance of the amide II band upon transferring a protein into D2O makes it possible to monitor the exchange of protons involved in hydrogen bonding within structured regions of proteins [10]. Fig. 13-4 also shows the infrared spectrum of 1-methyluracil containing 18O at the 4-position. Note the 7 cm-1 shift of the amide II band, indicating that the vibrations associated with the bending of the N—H bond are coupled to a significant extent with the stretching vibrations of C=O and C=C bonds.
b. Raman spectra
Raman spectroscopy is based on The Study of light scattering spectra. When a photon collides with a molecule, elastic scattering may occur, in which the photon loses no energy but changes its direction of motion. Such scattering is known as Rayleigh scattering and underlies the METHOD FOR DETERMINING the molecular weights of compounds. Collisions can also be inelastic; they are characterized by a change in the energy of both the molecule and the photon. Since these changes are of a quantum nature and are determined by the vibrational and rotational levels of the molecule, Analysis of the scattered light spectrum (Raman spectrum) yields almost the same information as a conventional infrared spectrum. However, one must keep in mind that the Selection rules in these two cases differ. Certain transitions are allowed in infrared spectroscopy, whereas others are allowed in Raman spectroscopy. Therefore, it makes sense to record both spectra of the sample under investigation. Until recently, Raman spectroscopy found very limited application due to the low intensity of scattered light. Nevertheless, The Use of lasers for excitation has substantially enhanced the value of this method [16—20]. As an example, Fig. 13-4, B displays the Raman spectrum of 1-methyluracil. Note that the intensity of the amide II band (relative to the amide I band) is significantly lower in the Raman spectrum than in the infrared absorption spectrum. Of particular interest is Resonance Raman spectroscopy [19—21], which employs a laser beam with a wavelength corresponding to that of an electronic transition. Light scattering in this case is often substantially enhanced at frequencies that differ from the laser frequency by the frequency of Raman scattering occurring in chromophore groups or in groups of a molecule adjacent to the chromophore. Despite certain experimental difficulties, this method makes it possible to study the Structural Features of a specific site within a macromolecule.
Last update: 06/08/2026
Editorial and Educational Adaptation: This material has been compiled based on the primary/original source text. The project team performed an editorial review, corrected technical inaccuracies, structured sections, and adapted the content for an educational format.
What was processed:
- elimination of formatting defects (OCR errors, structural breaks, corrupted characters);
- editorial organization of content;
- standardization of terminology in accordance with academic sources;
- verification of factual statements against the original source text.
All mentions of the author, publication year, and origin of the primary text have been preserved in accordance with the source.