Review of Medical Physiology - William F. Ganong 2002
Urine Formation and Excretion
Renal Function and Micturition
Tubular Function
The total amount of any substance passing through the glomerular filters equals the product of the Glomerular Filtration rate and the plasma concentration of that substance (CIN × Px). Tubular Cells can add substances to the filtrate (tubular secretion), completely or partially remove a given substance from the filtrate (tubular reabsorption), or perform both processes. The amount of a substance excreted per unit of time (Cx × V) equals the sum of the filtered amount and the net amount of the substance transported across the tubular walls (this value can also be negative). This quantity is frequently designated as Tx (Fig. 38-7). The clearance of a substance equals the GFR if neither secretion nor reabsorption occurs in the tubules; it exceeds the GFR if tubular secretion is present; and it is less than the GFR if tubular reabsorption takes place.
Class="center">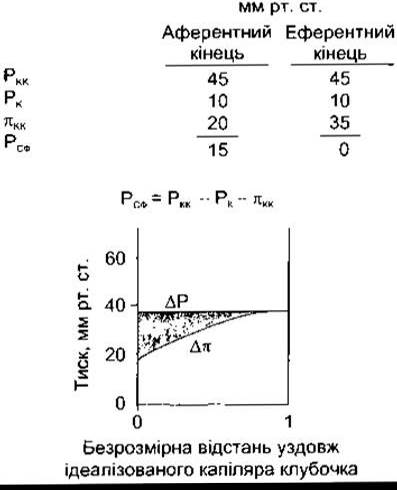
Fig. 38-6. Hydrostatic (PGC) and osmotic (πGC) pressures in the glomerular capillaries of rats. PB – pressure in Bowman's capsule; PSF – mean filtration pressure. The value of πB is normally negligible. Therefore, Δp = πGC. ΔP = PGC - PB (reproduced with permission from Mercer PF, Maddox DA, Brenner BM: Current Concepts of sodium chloride and Water transport by the mammalian nephron. J West Med 1974; 120:33).
Table 38-4. Factors influencing the glomerular filtration rate

Most modern insights into glomerular filtration and tubular function have been gained through micropuncture techniques. Micropipettes are inserted into the tubules of a living Kidney, and The chemical composition of the aspirated tubular fluid is determined using microchemical Methods. Furthermore, these pipettes allow for in vivo perfusion of the tubules. Alternatively, culturable tubular Cell cultures and isolated tubular segments can be investigated in vitro.
Mechanisms of Tubular Reabsorption and Secretion
Small Proteins and certain Peptide Hormones are readily reabsorbed in the proximal tubules via endocytosis. Other substances are secreted or reabsorbed in the tubules through passive intercellular diffusion and Facilitated Diffusion along chemical and electrical gradients, or via Active Transport against these gradients (see Chapter 1). Movement is mediated by Ion Channels, exchangers, cotransporters, and pumps. Many of these have been cloned, although their regulatory influences are still under investigation. Mutations in individual genes encoding each of these proteins lead to specific syndromes, such as Dent disease, Bartter syndrome, and Liddle syndrome, alongside numerous other mutations. An interesting example comprises the polycystin-1 (PKD-1) and polycystin-2 (PKD-2) proteins. PKD-1 is likely a Ca2+ receptor that activates a non-specific ion channel coupled with PKD-2. The exact function of this ion channel remains unknown; however, both proteins exhibit abnormal structures in Polycystic Kidney Disease (a condition in which the renal parenchyma is progressively replaced by multiple fluid-filled cysts, eventually leading to end-stage renal disease). It is crucial to note that pumps and Other components of the luminal membrane differ from analogous constituents of the basolateral membrane. This very feature enables The transport of dissolved solutes across the epithelium.
Similar to any transport systems in the body, renal active transport systems possess a transport maximum ($T_m$), representing the maximum rate at which they can transport specific substances. Consequently, a proportional relationship between The rate of substance transport and its concentration in solution is maintained as long as the concentration does not exceed the $T_m$ value for that solution. At higher concentrations, the transport mechanism becomes completely saturated, and no further increase in transport rate is observed. Nevertheless, for certain systems, $T_m$ values are high and thus difficult to saturate completely.
It should also be noted that the tubular epithelium, similar to the epithelium of the Small Intestine and Gallbladder, is a highly permeable epithelium where water and certain electrolytes can pass through tight junctions between cells (Fig. 38-8). The exact proportion of total Water and Electrolyte transport accounted for by the paracellular pathway remains controversial because it is experimentally difficult to determine. Current research indicates that it constitutes a highly significant factor. One piece of evidence supporting this is that a mutation in the Gene encoding paracellin-1—a protein located in tight junction regions involved in Mg2+ reabsorption—results in a loss of gene function and substantial urinary losses of Mg2+ and Ca2+.
The impact of tubular reabsorption and secretion on major physiologically important substances is summarized in Table 38-5.
Sodium Reabsorption
The reabsorption of Na+ and Cl- plays a vital role in the body's water and electrolyte balance. In addition, Na+ transport is coupled with the Transmembrane Movement of H+ ions, other electrolytes, glucose, Amino Acids, organic acids, phosphates, and others. The main cotransport and exchange systems in various PARTS OF THE nephron are presented in Table 38-6. In the proximal tubules, the thick ascending limb of the Loop of Henle, the distal tubules, and the collecting ducts, Na+ moves via cotransport or exchange between the tubular fluid and tubular epithelial cells down concentration and electrical gradients, and is actively pumped from these cells into the interstitial space. Consequently, Na+ is actively transported from all segments of the renal tubules except the thin limb of the loop of Henle, passing into the interstitial space via the action of the Na+-K+-ATPase enzyme. The MECHANISM OF ACTION of this ion pump is examined in detail in Chapter I. It extrudes three Na+ ions in exchange for two K+ ions entering The Cell.

Fig. 38-7. Tubular function. For an explanation of symbols, see the textbook text.

Fig. 38-8. Mechanism of Na+ reabsorption in the proximal tubule. Solid lines indicate active transport, dashed lines indicate cotransport or diffusion. Note that Na+ moves from the tubular lumen into the cells via cotransport, and that Na+ and H2O cross into the tubular lumen at tight junction sites. Cell membrane bioelectric potentials are indicated by plus and minus signs.
Tubular cells are tightly joined at their luminal borders, but intercellular spaces exist along their outer edges. A large amount of Na+ is extruded via active transport into these extensions of the interstitial space, known as lateral intercellular spaces (see Fig. 38-8).
The fluid formed As a result of tubular reabsorption is moderately hypertonic, and water passively moves down the osmotic gradient generated following solute absorption into the tubular epithelial cells. It is now established that the apical membranes of proximal tubular cells contain water channels that facilitate fluid movement (see below). From the cells, water moves into the lateral intercellular spaces. The rate at which water and dissolved solutes move from the lateral intercellular spaces and other compartments of the interstitium into the capillary lumen is determined by Starling's forces, which describe fluid movement across any Capillary Wall—namely, hydrostatic and osmotic pressure gradients in the interstitial fluid and capillaries (see Chapter 30). Na+ and H2O can also re-enter the tubular lumen through tight junctions, particularly when the lateral intercellular spaces are widened.
Glucose Reabsorption
Glucose, amino acids, and HCO3- are reabsorbed alongside Na+ in the early segments of the proximal tubules (Fig. 38-9). In other tubular segments, Na+ is reabsorbed in tandem with Cl-. Glucose serves as a classic example of a substance cleared from the urine via secondary active transport. It is filtered at a rate of approximately 100 mg/min (80 mg/dL plasma × 125 mL/min). Virtually all glucose is reabsorbed, with no more than a few milligrams excreted in the urine daily. The amount of reabsorbed glucose is proportional to the filtered load and, therefore, equals the product of the plasma glucose concentration (PG) and the GFR, provided this product does not exceed the transport maximum ($Tm_G$). However, when $Tm_G$ is exceeded, urinary glucose excretion increases (Fig. 38-10). The $Tm_G$ value is approximately 375 mg/min in men and 300 mg/min in women.
Table 38-5. Renal transport of various plasma constituents in a healthy adult consuming a normal diet
Substance |
Per 24 hours |
Reabsorption, % |
||||
Filtration |
Reabsorption |
Secretion |
Excretion |
|||
Na+, mEq |
26 000 |
25 850 |
150 |
99.4 |
P, H, D, C |
|
K+, mEq |
600 |
5602 |
502 |
90 |
93.3 |
P, H, D, C |
Cl-, mEq |
18 000 |
17 850 |
150 |
99.2 |
P, H, D, C |
|
HCO3-, mEq |
4 900 |
4 900 |
0 |
100 |
P, D |
|
Urea, mmol |
870 |
4603 |
410 |
53 |
P, H, D, C |
|
Creatinine, mmol |
12 |
14 |
14 |
12 |
||
Uric acid, mmol |
50 |
49 |
4 |
5 |
98 |
P |
Glucose, mmol |
800 |
800 |
0 |
100 |
P |
|
Total solutes, mOsm |
54 000 |
53 400 |
100 |
700 |
98.9 |
P, H, D, C |
Water, mL |
180 000 |
179 000 |
1 000 |
99.4 |
P, H, D, C |
|
1 P – proximal tubules; H – loops of Henle; D – distal tubules; C – collecting ducts.
2 K+ is both reabsorbed and secreted.
3 Urea moves both into and out of the nephron.
4 Creatinine secretion in humans is variable, and it may also undergo reabsorption.
Table 38-6. Transport proteins mediating the movement of Na+ and Cl- across the apical membranes of renal tubular cells1
Segment |
Apical transport protein |
Function |
Proximal tubule |
Na+/glucose cotransporter Na+/Pi cotransporter Na+/amino acid cotransporter Na+/lactate cotransporter Na+/H+ exchanger Cl-/OH- exchanger |
Uptake of Na+, glucose, Pi, amino acids, lactate, Cl- Extrusion of H+ |
Thick ascending limb |
Na+, 2Cl-, K+ cotransporter Na+/H+ exchanger K+ channels |
Uptake of Na+, Cl-, K+ Extrusion of K+ and H+ |
NaCl cotransporter |
Uptake of Na+ and Cl- |
|
Collecting duct |
Na+ channel (ENaC) |
Uptake of Na+ |
1 Uptake corresponds to the movement of substances from the tubular lumen into the cell; CT stands for cotransporter; Pi stands for inorganic phosphate (reproduced with permission from Schnermann JB, Sayegh EI: Kidney Physiology. Lippincott-Raven, 1998).
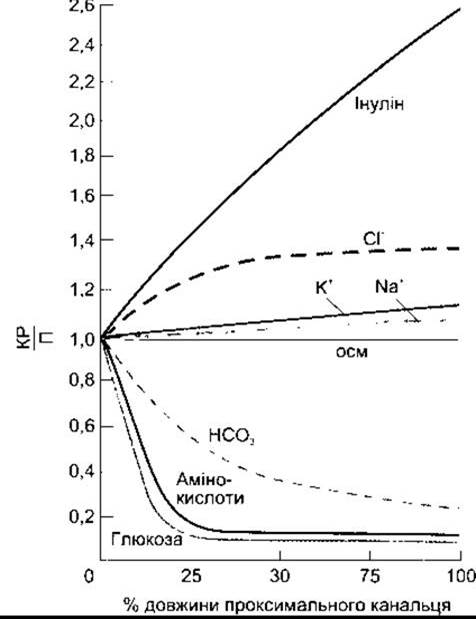
Fig. 38-9. Reabsorption of various substances in the proximal tubule; TF/P represents The ratio of the concentration of a substance in the tubular fluid to its concentration in Blood Plasma (courtesy of FC Rector Jr).
The renal threshold for glucose is the plasma glucose concentration at which glucose first appears in the urine in amounts greater than normal trace levels. Logically, one would expect the renal threshold for glucose to be approximately 300 mg/dL—that is, 375 mg/min (TmG) divided by 125 mL/min (GFR). However, the actual renal threshold for glucose is about 200 mg/dL in arterial plasma, which corresponds to roughly 180 mg/dL in venous blood. Figure 38-10 illustrates why the actual renal threshold for glucose is lower than the theoretically calculated value. An ideal titration curve would be obtained if TmG were identical in all nephrons and glucose were completely cleared from every tubule (provided the filtered load is less than TmG). In reality, however, the human titration curve exhibits rounding and deviates significantly from the ideal. This deviation is known as splay. The magnitude of splay is inversely proportional to the affinity with which the transport mechanism binds its substrate.
Mechanism of Glucose Transport
The reabsorption of glucose in the kidney closely resembles the same process in the intestine (see Chapter 25). Glucose and Na+ bind to a common carrier protein, SGLT 2, located in the luminal membrane of the tubule (Fig. 38-11); glucose enters The Cell as Na+ moves down its Electrical and Chemical gradients. Subsequently, Na+ is extruded from the cells into the lateral intercellular spaces, while glucose is transported into the interstitial fluid via GLUT 2. Experiments in rats have shown that SGLT 1 and GLUT 1 also play some role in glucose transport. Thus, glucose transport in both the kidney and the intestine serves as a prime example of secondary active transport.
It is noteworthy that the d-isomer of glucose specifically binds to the shared carrier, resulting in a transport rate for d-glucose that is several times higher than that for l-glucose. The plant glycoside phlorhizin inhibits glucose transport in both the kidney and the intestine by competing with glucose for binding to the carrier.

Fig. 38-10. Top: Relationship between plasma concentration P and The excretion of glucose and inulin. Bottom: Relationship between plasma glucose concentration PG and glucose reabsorption RG.
Additional Examples of Secondary Active Transport
A vast array of other substances are transported via secondary active transport. The energy required for this process is ultimately provided by The active transport of Na+ out of renal tubular cells. Such substances include Certain amino acids, lactate, phosphate (Pi), H+, and Cl-.
The reabsorption of Amino Acids and glucose is most intense in the early segment of the proximal convoluted tubule. The reabsorption process here is similar to that in the intestine (see Chapter 25). The primary carriers in the luminal membrane mediate Na+-coupled transport, whereas the basolateral membrane carriers do not participate in Na+ transport. Na+ ions are extruded from the cells by the enzyme Na+-K+-ATPase, whereas amino acids enter the interstitial fluid via passive or facilitated diffusion.
In the thick ascending limb of the loop of Henle, a small amount of Cl- is reabsorbed alongside Na+ and K+ (see below). Furthermore, two members of the ClC chloride channel family have been identified in the kidney. This protein family features 12 transmembrane domains and is also expressed in Skeletal Muscle and other Tissues. Mutations in the gene encoding one of these renal channels lead to calcium-containing kidney stones and hypercalciuria (Dent's disease), although the precise link between Ca2+ and Cl- transport remains to be fully elucidated.
Transport of PAH
The transport of PAH clearly illustrates the operation of active transport systems that secrete substances into the tubular fluid. The relationship between the filtration rate of PAH and its plasma concentration is linear; however, the rate of PAH secretion increases proportionally with PPAH only until PPAH reaches the maximal secretory capacity (TmPAH) (Fig. 38-12). At low values of PPAH, the clearance of PAH ($C_{PAH}$) is high; however, when PPAH exceeds TmPAH, $C_{PAH}$ drops sharply. Under these conditions, $C_{PAH}$ essentially approaches the inulin clearance ($C_{IN}$) (Fig. 38-13), because the secretory component becomes a progressively smaller fraction of total excretion. Conversely, when the plasma glucose concentration PG is below the renal threshold, glucose clearance is virtually zero, but as PG rises above the threshold, $C_{G}$ gradually approaches $C_{IN}$.

Fig. 38-11. Glucose reabsorption. In the early proximal tubule, glucose and Na+ undergo cotransport from the tubular lumen via SGLT 2; Na+ is pumped out of the tubular cell by the Na+-K+-ATPase located in the basolateral membranes, and glucose enters the interstitial fluid via GLUT 2. In rats, a fraction of glucose is handled by SGLT 1 and GLUT 1 in the late, straight segment of the proximal tubule. SGLT 1 transports two Na+ ions per glucose molecule, whereas SGLT 2 transports one Na+ ion.

Fig. 38-12. Relationship between plasma concentration P and the excretion of PAH and inulin.

Fig. 38-13. Clearance of inulin, glucose, and PAH at various plasma concentrations of each substance in humans.
The Use of PAH to determine effective renal plasma flow was described above.
Tubular secretion of other substances
In addition to PAH, the tubular fluid actively secretes hippuric acid derivatives, phenol red and other sulfophthalein Dyes, penicillin, and A wide variety of iodinated contrast media. Endogenously synthesized substances that undergo tubular secretion also include various ethereal sulfates, glucuronides, and 5-hydroxyindoleacetic acid—the main metabolite of serotonin (see Chapter 4).
Tubuloglomerular feedback and glomerulotubular balance
Signals originating from the renal tubules exert a feedback effect on glomerular filtration. When the flow rate of fluid through the ascending limb of the loop of Henle and the early distal tubule increases, glomerular filtration in the corresponding nephron decreases, and conversely, a decrease in tubular flow rate leads to an increase in GFR (Fig. 38-14). This phenomenon, known as tubuloglomerular feedback, ensures a constant load to the distal nephron segments. The macula densa acts as the receptor in this mechanism, and GFR is regulated via constriction or dilation of the afferent arteriole. Thromboxane A2 is considered a potential mediator of vasoconstriction.
Conversely, an increase in GFR leads to enhanced reabsorption of water and solutes, predominantly in the proximal tubules, thereby maintaining a constant fraction of reabsorbed substances. This process is known as glomerulotubular balance; it is most prominent during Na+ transport. Since Changes in the filtration rate are followed within seconds by corresponding changes in Na+ reabsorption rate, it is unlikely that extrarenal humoral factors are involved. One contributing factor is the oncotic pressure in peritubular capillaries. With a high GFR, by the time blood reaches the efferent arterioles and their capillary branches, the oncotic pressure of its plasma has increased significantly, which in turn enhances the reabsorption of Na+ from the tubular lumen.
However, it is known that yet-unidentified intrarenal mechanisms also participate in this process.
Due to the action of various toxic agents, acquired diseases such as Vitamin D deficiency, or hereditary disorders like congenital glucose malabsorption, the ATP content in proximal tubular cells drops sharply. Consequently, the extrusion of Na+ ions from the cell via Na+-K+-ATPase is impaired, leading to generalized defects in the secondary active transport of glucose, amino acids, H+, and phosphate. The resulting condition is Fanconi syndrome, which is accompanied by metabolic acidosis, glucosuria, Aminoaciduria, and phosphaturia.
Last update: 10/08/2026
Editorial and Educational Adaptation: This material has been compiled based on the primary/original source text. The project team performed an editorial review, corrected technical inaccuracies, structured sections, and adapted the content for an educational format.
What was processed:
- elimination of formatting defects (OCR errors, structural breaks, corrupted characters);
- editorial organization of content;
- standardization of terminology in accordance with academic sources;
- verification of factual statements against the original source text.
All mentions of the author, publication year, and origin of the primary text have been preserved in accordance with the source.