Medical Radiology - Lazar A.P. 2008
Radiological Examination of the Digestive System
Liver and Biliary Tract Diseases
The Liver is the largest gland in The Human Body, a parenchymal organ with a mass of approximately 1.5 kg. Located in the Abdominal cavity directly beneath the Diaphragm, it occupies the right hypochondriac region, extending partially into the epigastric (left lobe) and left hypochondriac regions. The liver features a convex diaphragmatic surface adjacent to the diaphragm and a somewhat concave visceral surface adjacent to the Internal Organs. Anteriorly and inferiorly, at the convergence of these two surfaces, lies the sharp inferior border of the liver. Under normal conditions, the lower edge of the liver does not extend beyond the right costal margin. The porta hepatis is a transversely oriented depression on the visceral surface of the liver through which the proper hepatic artery and the portal vein enter, and from which the common hepatic duct emerges. The porta hepatis serves as the boundary between the liver lobes. The quadrate lobe lies anterior to the porta hepatis, while the caudate lobe is located posterior to it. Flanking these centrally positioned lobes and the porta hepatis are the two main large lobes of the liver: the right and the left. On the diaphragmatic surface, the falciform ligament serves as the boundary between the right and left lobes. The liver is conventionally divided into 8 segments, numbered clockwise (I–VIII) starting from the caudate lobe, with 4 segments forming the right part of The Liver and 4 in the left. Normally, the transverse dimension of the liver is 25-30 cm; the sagittal dimension is 20-22 cm, and the vertical dimension is 14-15 cm.
The Gallbladder is a pear-shaped organ about 10 cm in length with a capacity of approximately 40 cm3. Situated in the corresponding fossa on the visceral surface of the liver, it lies adjacent to the transverse colon and the duodenum. The gallbladder consists of a fundus, body, and neck, which continues into the cystic duct. The gallbladder wall, measuring 1.5-2 mm in thickness, features mucosal folds that give the inner surface a reticular appearance, which smooths out as the gallbladder fills.
The cystic duct, 2-4 cm in length, connects the gallbladder to the common hepatic duct, and their union forms the Bile duct. The bile duct (common bile duct), 8 cm long and 5-6 mm in diameter, courses within the hepatoduodenal ligament alongside the proper hepatic artery and the portal vein. It passes between the descending part of the duodenum and the HEAD of the Pancreas, joining with the pancreatic duct. Immediately after the confluence of the BILE AND PANCREATIC ducts within the duodenal wall lies a dilatation known as the hepatopancreatic ampulla, which opens at the apex of the major duodenal papilla (ampulla of Vater).
On radiographs, the liver is visualized as a dense, homogeneous, roughly triangular shadow. Its upper contour is distinct and coincides with the diaphragmatic silhouette. The indistinct lower contour of the liver is formed by its anterior edge and is traced against the Background of other abdominal organs. A normal gallbladder is almost never visible on standard radiographs. Radiologically, the detectable liver pathologies are limited to calcifications appearing as extra shadows and abscesses appearing as radiolucencies with a horizontal fluid level.
For the radiological evaluation of the gallbladder, a contrast-enhanced method known as cholecystography is employed, which is used when sonographic findings regarding gallstones are inconclusive. For the contrast examination of the biliary tract, tablet iodine compounds (cholevid, bilimin, iopagnost) are administered at a dose of 0.5 g per 10 kg of body weight. The highest concentration of the contrast agent in the gallbladder is reached approximately 15 hours after ingestion. In the standing position of the patient, the gallbladder shadow—measuring 7-9 cm in length and about 2-4 cm in width—is pear-shaped, homogeneous, vertically oriented, and located to the right of the spinal Column. In normosthenic individuals, the Cytology/practical/108.html">Fundus of the gallbladder is situated at the level of the II-III lumbar vertebrae.
To assess the motor and evacuatory function of the gallbladder, the patient is given a physiological cholegogic breakfast after the first radiograph: two raw eggs or a piece of white bread with butter. A second radiograph of the gallbladder is taken 45 minutes after this breakfast. Under normal contractile activity, the gallbladder decreases by one-quarter to one-third of its initial size during this time. A third radiograph is taken 2 hours after the physiological meal, at which point the gallbladder should be empty.
Cholangiography is a radiological examination of the biliary tract following the direct injection of a Water-soluble contrast medium to assess the condition (specifically, patency) of the ducts, the major duodenal papilla, and any biliary anomalies. Injection of the contrast agent into the intrahepatic bile ducts through the anterior abdominal wall is termed percutaneous transhepatic cholangiography; via the major duodenal papilla during duodenoscopy, it is endoscopic retrograde cholangiopancreatography (Fig. 203); and during surgical intervention, it is intraoperative cholangiography.
Class="center">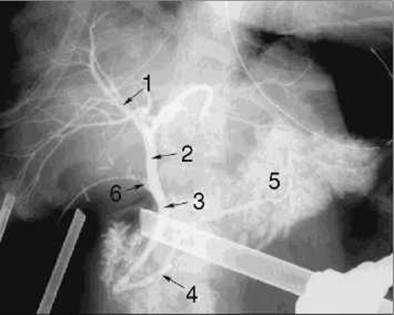
Fig. 203. Retrograde cholangiopancreatogram following cholecystectomy.
1 - intrahepatic ducts;
2 - common hepatic duct;
3 - bile duct;
4 - pancreatic duct;
5 - pancreatic parenchyma;
6 - cystic duct stump.
On sonograms, the liver presents a fairly homogeneous, fine-grained echostructure resulting from the presence of hepatic lobules. The boundary between the right and left lobes is the porta hepatis, which transmits the portal vein (12-14 mm in diameter, 5-6 cm long) and the proper hepatic artery, while the common hepatic duct (about 7 mm in diameter) emerges from it. Echonegative bands corresponding to Blood Vessels and bile ducts are visible within the liver. Intrahepatic vessels are differentiated using Doppler Ultrasonography. Ultrasound examination evaluates the Size and Structure of the liver, detects localized pathological processes (tumors, cysts, abscesses), and identifies diffuse lesions. Ultrasound guidance can also be utilized to perform targeted needle biopsy of a focal liver lesion.
Ultrasonography of the gallbladder must be performed on an empty Stomach. The gallbladder appears as an oval-shaped, echonegative structure with smooth margins, measuring 6-12 cm in length and 2.5-4.0 cm in width. The thickness of the gallbladder wall in the region of the body and fundus is 2.0 mm, and in the neck region, it is 3.0 mm.
X-ray Computed Tomography is performed when diffuse or mass lesions of the liver are suspected, as well as in cases of jaundice of undetermined origin. The examination can be performed without or with contrast enhancement, the latter being used when hepatic neoplasms are suspected. A triiodinated contrast agent is administered intravenously at a standard rate in a volume of 40 ml, or as a rapid bolus in a volume of 80 ml. A series of transverse (horizontal) scans is obtained with a slice thickness of 1.0 cm or less, using the xiphisternum as a landmark (ranging from the upper boundary of the liver, located approximately 10 cm cranial to the landmark, to the lower boundary, located approximately 20 cm caudal to it). The scans reveal a homogeneous liver structure with a density of +60±10 HU and intrahepatic vessels with a density of about +40 HU; the liver contours are smooth and distinct. The density of the gallbladder ranges from 0 to +10 HU.
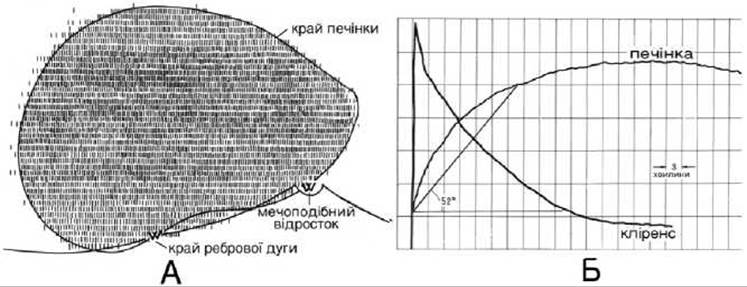
Fig. 204. Radionuclide imaging of a patient with a healthy liver.
A - scan showing a liver of normal size, with the margins of the liver and costal arch outlined by lines; the liver edge does not extend beyond the costal margin, and the radiopharmaceutical distribution is uniform.
B - radiohepatography demonstrating a radiopharmaceutical uptake angle of 520 (norm: not less than 400), an equilibrium plateau, the onset of intensive radiopharmaceutical excretion at approximately 1 hour, and a blood T1/2 of up to 20 minutes.
Spiral dynamic CT with contrast enhancement (SDCT) enables scanning of the entire liver in less than 1 minute following a bolus injection of the contrast medium, while it is still within the arterial bed. This technique provides clear visualization of hypervascular pathological lesions (such as hepatocellular carcinoma, hepatic adenoma, and most tumor metastases) due to their hyperdensity during the arterial phase of contrast enhancement.
The sensitivity of contrast-enhanced Magnetic Resonance imaging (MRI) for focal liver lesions is comparable to that of SDCT; therefore, such MRI can serve as a valuable adjunct to ultrasound and CT, or may be used independently.
Hepatoscintigraphy and radiohepatography utilizing 99mTc-labeled colloid are based on the clearance of the radiopharmaceutical from the blood via the phagocytic function of reticuloendothelial system Cells. Hepatoscintigraphy records the distribution of the radionuclide within the liver in relation to the local status of hepatic blood flow, whereas radiohepatography evaluates the functional state of hepatocytes. Normally, a uniform accumulation of the radiopharmaceutical in the liver is registered (Fig. 204).
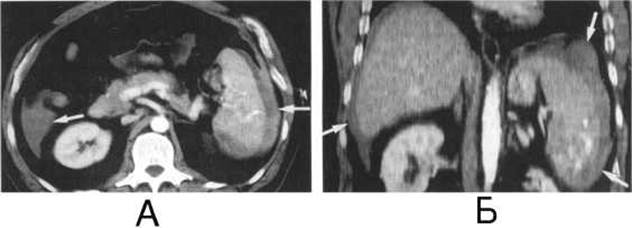
Fig. 205. Free blood in the abdominal cavity along the lower edge of the liver and around the Spleen (arrows) on a computed tomography scan.
A - horizontal section;
B - multiplanar coronal reconstruction.
Radionuclide imaging of hepatocyte function and hepatic blood flow using SPECT makes it possible to determine with high precision the number of functioning elements within a slice, thereby assessing the overall volume of functioning liver tissue.
Liver injuries are predominantly closed and subcapsular initially. Days after trauma, their progression can lead to a capsular rupture and overt intraperitoneal Hemorrhage. CT, MRI, and ultrasound reveal a disruption of the liver contours at the site of damage, accompanied by free fluid in the abdominal cavity that increases in volume over time (Fig. 205).
During the first week post-injury, hematomas are not clearly visualized on CT scans; however, the administration of contrast agents increases the densitometric density of the hepatic parenchyma without altering the density of the hematoma. By the second week, the density of the hematoma decreases, becoming hypodense with a heterogeneous structure (revealing denser sequestra within it). If the hematoma does not resolve, its density drops to +5 to +10 HU within a few months, which may mimic a cyst. An old hepatic hematoma may transform into a pseudocyst with distinct, smooth contours, or be replaced by fibrous tissue followed by scarring and calcification.
On ultrasound, a fresh hematoma appears as an ill-defined, anechoic irregular lesion with web-like extensions, whereas a few days post-injury, the borders of the hematoma become smooth and distinct. Several months after trauma, pseudocysts and calcifications may form at the site of the hematoma.
MRI not only detects intrahepatic hematomas but also helps determine their age. Areas of acute hemorrhage are poorly demarcated from the unaffected parenchyma, showing low signal intensity on T1-weighted images and high signal intensity on T2-weighted images. After the first 24 hours, due to The formation of deoxyhemoglobin, the T2 signal decreases. After 7 days, signal intensity begins to increase on both T1- and T2-weighted images, becoming high due to the formation of methemoglobin and erythrocyte lysis. Scar formation is accompanied by decreased signal intensity on both T1- and T2-weighted images.
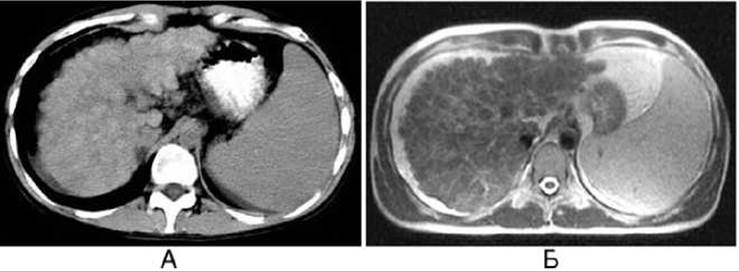
Fig. 206. Liver cirrhosis on computed tomography (A) and magnetic resonance imaging (B) scans.
Hepatitis is an acute or chronic inflammation of the liver characterized by hepatomegaly—most notably of the left lobe—and tenderness. CT or ultrasound reveals an enlarged liver, decreased densitometric density, and reduced echogenicity. Foci of increased densitometric density and echogenicity may also be detected. In patients with chronic hepatitis, ultrasound and CT imaging of the liver may appear completely normal, with the aforementioned signs emerging only during disease exacerbation.
Liver cirrhosis is a chronic condition caused by Viral Hepatitis B, alcohol abuse, Metabolic Disorders, and other factors. It is characterized by Connective Tissue proliferation, altered normal cytoarchitecture, and the formation of regenerative nodules. CT, ultrasound, and MRI reveal changes in liver size (an initial transient enlargement followed by shrinkage, which is typical of the advanced stage), altered liver shape, nodular contours, unevenly decreased hepatic densitometric density (increased echogenicity), widened Veins (portal vein exceeding 1.5 cm, splenic vein exceeding 1 cm), Splenomegaly (Fig. 206), and ascites. In 50% of patients, cirrhosis is complicated by The Development of hepatocellular carcinoma. The identification of hypodense foci on CT or hypoechoic foci on ultrasound that rapidly increase in size over time indicates the onset of liver Cancer.
Scintigraphy and SPECT with radioactive colloids demonstrate decreased radiopharmaceutical uptake in the liver and increased uptake in the spleen. A hallmark feature of scintigraphic and especially SPECT images is the mottled pattern of radiopharmaceutical distribution in the liver—significantly reduced in areas of connective tissue proliferation and increased in zones of regeneration. Hepatobiliary scintigraphy reveals signs of impaired hepatocyte function: the liver time-activity curve peaks late (at 20–25 minutes), the plateau phase is prolonged due to intrahepatic cholestasis, and visualization of the biliary tract is delayed.
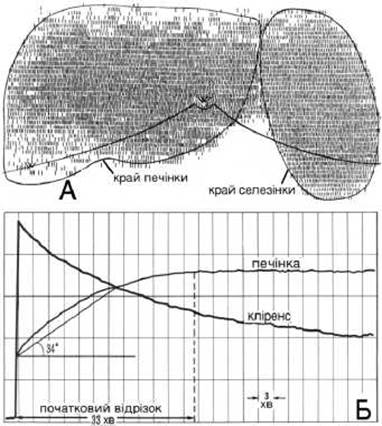
Fig. 207. Alcoholic liver cirrhosis, portal Hypertension, splenomegaly (radionuclide study).
A - scan shows a mildly enlarged liver with uneven radiopharmaceutical distribution and areas of decreased uptake in the peripheral zones and lower PARTS OF THE right lobe; the spleen is enlarged;
B - radiohepatogram demonstrates delayed radionuclide uptake and excretion, radiopharmaceutical uptake angle = 340, no equilibrium plateau is defined, the onset of intensive radiopharmaceutical excretion is absent up to 75 min, blood clearance = 36 min.
Liver cirrhosis is diagnosed based not only on structural changes but also on the hyperfixation of radiocolloids (up to 40–70%) in the spleen and Bone Marrow due to impaired uptake by the reticuloendothelial System of the liver. Advanced cirrhosis with portal hypertension is characterized by a triad of scintigraphic signs: 1) enlargement of the left lobe with uneven radiopharmaceutical distribution; 2) splenomegaly with high radionuclide uptake (Fig. 207); 3) visualization of the bones, primarily the spine and pelvis.
Fatty liver disease develops As a result of alcoholism, obesity, cholestasis, infectious, toxic, and Circulatory Disorders of the liver. CT can reveal hepatomegaly and a decrease in parenchymal density below +30 HU, depending on the stage of steatosis (Fig. 208); with a further drop in density to 0 HU, the hepatic veins become indistinguishable. Ultrasound reveals an enlarged liver with an indistinct posterior border; the liver structure is homogeneous and has increased echogenicity.
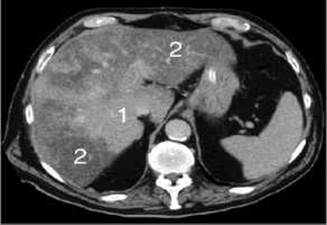
Fig. 208. Fatty liver disease on a computed tomography scan.
1 - area of normal densitometric density;
2 - "geographic" zones of decreased densitometric density.
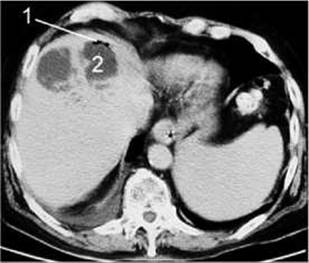
Fig. 209. Liver abscess on contrast-enhanced CT.
1 - air pocket;
2 - abscess cavity.
Focal liver lesions (tumors, cysts, abscesses) differ from the surrounding parenchyma in echogenicity (ultrasound), densitometric density (CT), and signal intensity (MRI), starting from sizes of 3–5 mm. Indirect signs of these lesions—such as distortion of the vascular pattern and local bulging of the liver contour—are also detected.
A liver abscess is identified based on clinical symptoms (high body Temperature, tachycardia, leukocytosis, pain in the hepatic region) and the following imaging findings: a rounded lesion with irregular and indistinct margins, heterogeneous CT density, MRI signal intensity, and echogenicity (appearing on a sonogram as a hypoechoic focus with hyperechoic inclusions), often with a small amount of gas in its upper portion (Fig. 209). During ultrasound, enhanced hepatic echogenicity can be observed behind the posterior wall of the abscess, which helps differentiate it from a tumor. Under CT and ultrasound guidance, abscess puncture, pus evacuation, and cavity irrigation can be performed.
Liver cysts can be non-parasitic or parasitic. According to autopsy data, the incidence of liver cysts is 14%. Clinical symptoms are usually absent, except for large cysts, which may cause pain in the hepatic region. On ultrasound, CT, and MRI, liver cysts appear round with clear margins, a homogeneous anechoic ultrasound structure, posterior acoustic enhancement, low densitometric density on CT (from -5 to +15 HU), low signal intensity on T1-weighted images, and high signal intensity on T2-weighted MRI images. Parasitic echinococcal liver cysts have a regular oval shape (Figs. 210, 211) and a distinct 2–5 mm thick capsule with calcifications (in 60% of cases). Following intravenous contrast administration, the densitometric density of the cyst remains unchanged.
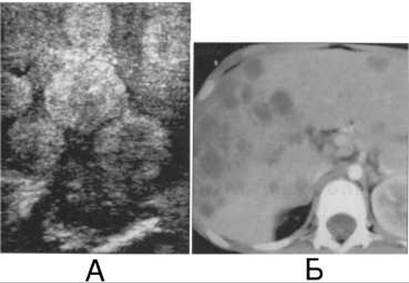
Fig. 210. Liver echinococcosis on ultrasound (A) and CT (B).
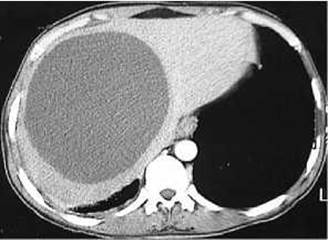
Fig. 211. Echinococcal cyst on contrast-enhanced liver CT.
Liver tumors are classified into benign and malignant. The main objective of diagnostic imaging is to differentiate benign lesions from malignant ones. Two-thirds of solitary lesions measuring up to 15 mm are typically benign tumors, which include hemangiomas, hepatic adenomas, lymphangiomas, fibromas, lipomas, teratomas, etc. The vast majority of benign tumors detected via ultrasound, CT, and MRI examinations have a round shape, homogeneous structure, and clear margins.
A hemangioma originates from the walls of the hepatic veins and is more common in women. According to autopsy data, the incidence of liver hemangiomas is 20%. Most hemangiomas are identified on ultrasound by a characteristic yet nonspecific picture: a round or oval lesion with a homogeneous structure, increased echogenicity, and a distinct border (Fig. 212).
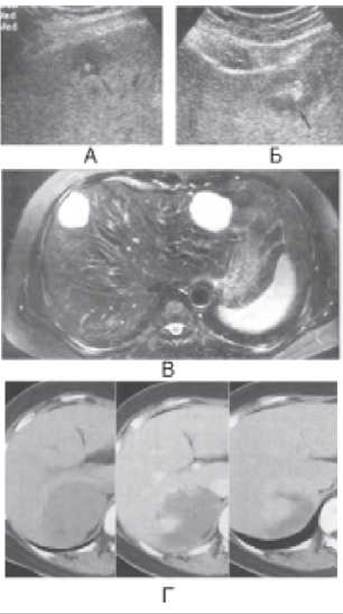
Fig. 212. Liver hemangioma: A, B - ultrasound; C - MRI, T2-weighted image; D - CT (before and after IV contrast enhancement).
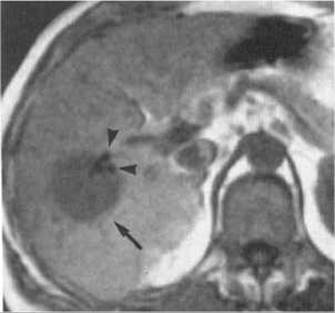
Fig. 213. Cholangiocellular carcinoma (MRI, T1-weighted image).
The detection of a stable picture on follow-up sonography at 3–6 months rules out a malignant tumor. During angiography, the contrast agent fills the dilated Vessels of the hemangioma and remains retained there for a prolonged period.
Depending on its cellular structure, liver cancer can be hepatocellular (hepatoma), cholangiocellular (cholangiocarcinoma) (Fig. 213), or mixed. Hepatocellular carcinoma is more common, accounting for 70–85% of cases.
Radionuclide imaging reveals a "cold" tumor focus in the liver and a reduction in The amount of functioning parenchyma (Fig. 214).
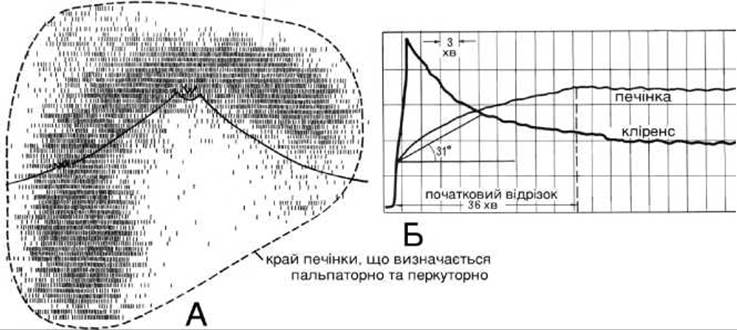
Fig. 214. Liver cancer and cirrhosis (radionuclide imaging).
A - hepatoscan shows an enlarged liver with uneven radiopharmaceutical uptake.
B - radiohepatogram shows delayed radionuclide uptake and excretion, radiopharmaceutical absorption angle = 310, no equilibrium plateau is defined, and the onset of intensive radiopharmaceutical excretion by 70 min is absent.
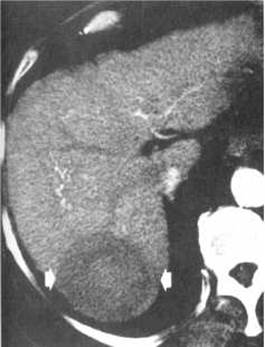
Fig. 215. Hepatocellular carcinoma (arrows) measuring 5.5 cm against the background of liver cirrhosis on a computed tomography scan.
Hepatocellular carcinoma (hepatoma) is more frequently diagnosed in men over the age of 40, and the prognosis is generally unfavorable. General weakness and jaundice are relatively early symptoms of the disease. Clinical examination reveals hepatomegaly, liver hardening, jaundice, and ascites. On computed tomography (CT) scans, a hepatoma lesion typically appears round or irregular in shape, with indistinct contours, predominantly low density, and a heterogeneous structure caused by necrosis and hemorrhages (Fig. 215). Intravenous contrast administration leads to rapid contrast agent accumulation within the tumor. On MRI and scintigraphy (emission computed tomography) scans, the hepatocellular carcinoma node has an irregular shape with uneven outlines, demonstrating low signal intensity on T1-weighted images and high signal intensity on T2-weighted MRI scans. Sonograms reveal a single lesion with decreased, increased, or mixed echogenicity, characterized by fuzzy and irregular borders. Angiographic examination of hepatocellular tumor nodes shows numerous haphazardly distributed Arteries with uneven and sporadically interrupted lumens.
Liver metastases occur more frequently than primary liver cancer. The primary tumor is most commonly located in the intestine, stomach, pancreas, or Mammary Glands, while metastases from esophageal, lung, genital, or soft-tissue cancers are less common. For the early detection of metastases, virtually all oncology patients should undergo imaging examinations, starting with ultrasound as the most accessible and cost-effective diagnostic imaging modality. Multiple small metastases, 1–2 cm in diameter and of varying echogenicity, are most frequently detected in the liver. A direct sign of liver metastases is the presence of a hypoechoic halo along the margin of the metastatic lesion. On CT scans, metastatic nodes are typically rounded with uneven and indistinct contours; their densitometric density is generally lower than that of healthy liver parenchyma. However, calcified metastases of very high density can also occur, which are characteristic of malignant tumors of the breast, sigmoid colon, and osteogenic sarcomas. Metastases are also visualized using MRI and radionuclide Diagnostics (RND) (Fig. 216).
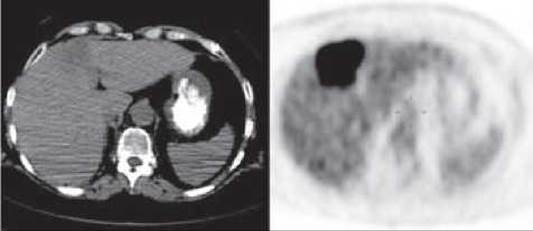
Fig. 216 A. Solitary Breast Cancer Metastasis (adenocarcinoma) to the liver on CT and PET scans.
A definitive Diagnosis of liver metastases or primary liver cancer is established based on targeted puncture biopsy under CT or sonographic guidance, followed by histological or Cytological examination of the obtained material.
Cholelithiasis is characterized by the formation and presence of calculi in the gallbladder and bile ducts. Clinically, an attack presents with abdominal pain, tension, and restricted mobility of the abdominal wall. Calcified gallbladder stones may be detected on standard plain radiography, whereas artificial contrast enhancement of the gallbladder and bile ducts renders such stones visible as additional high-intensity shadows. Cholesterol and pigment stones are radiolucent and therefore appear during cholecystography as filling defects (lucencies) (Fig. 217). Mixed stones present on radiographs and CT scans as a combination of shadows and radiolucencies (Fig. 218).
Recently, ultrasound examination has largely superseded cholecystography due to its higher accuracy, simplicity, and speed, as well as its independence from extraneous factors that affect gallbladder opacification—such as intestinal absorption of orally administered choleotropic contrast agents, hepatic concentration, and cystic duct patency. Another advantage of ultrasound is The ability to change the patient's position during the examination, which facilitates stone detection. A stone within the
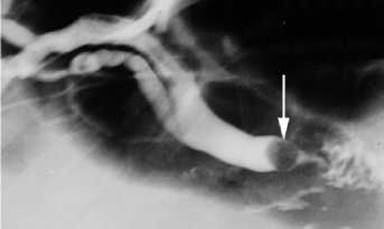
Fig. 217. Choledocholithiasis with common bile duct dilation on a cholangiogram. A filling defect (arrow) is visible in the distal portion of the bile duct near the ampulla.
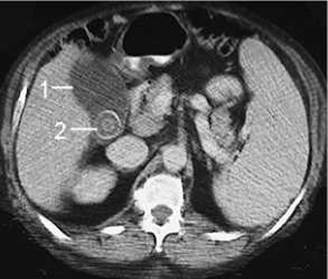
Fig. 218. Cholelithiasis on abdominal CT. The gallbladder (1) contains a mixed stone (2) composed of cholesterol, calcium, and bilirubin.
gallbladder against the background of anechoic bile produces a high-echogenicity signal (Fig. 219). When the patient is examined in a horizontal position, the stones settle along the posterior wall, whereas in a vertical position, they migrate to the gallbladder fundus. Calculi invariably shift position when the patient's body posture changes, except for those impacted in the gallbladder neck or ducts. A hallmark sign of calculi is the presence of an acoustic shadow distal to their posterior surface.
When ultrasound findings are inconclusive, discordant with clinical data, or when non-Surgical Treatment is planned, complementing the examination with cholecystography is beneficial. The sensitivity of CT for Gallbladder Calculi is slightly lower than that of ultrasound.
Acute cholecystitis most commonly develops in patients with pre-existing cholelithiasis. Clinically, patients with acute cholecystitis experience intense pain in the right upper quadrant radiating to the right hemithorax, frequently accompanied by nausea and vomiting.
The diagnosis of Calculous Cholecystitis is established with an accuracy exceeding 80% based on a triad of ultrasound signs: 1) stones located in the gallbladder neck or cystic duct; 2) precise correspondence between the tenderness elicited by transducer pressure and the anatomical Location OF THE gallbladder (Murphy's sign); 3) uneven thickening of the gallbladder wall (greater than 3 mm) with internal heterogeneity, stratification, and occasional indistinct demarcation from the liver due to edema and infiltration of the perivesicular adipose tissue (Fig. 220). Additionally, mild enlargement of the gallbladder dimensions is observed.
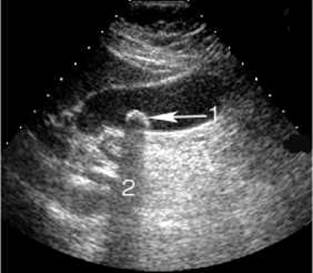
Fig. 219. Cholelithiasis on a sonogram.
1 - gallstone;
2 - acoustic shadow distal to the stone.

Fig. 220. Acute cholecystitis on ultrasound.
1 - bile in the gallbladder;
2 - biliary sludge;
3 - gallstone;
4 - thickened gallbladder wall;
5 - fluid in the pockets near the gallbladder wall;
6 - acoustic shadows behind the stone and the thickened gallbladder wall.
CT allows for the identification of uneven, significant thickening of the gallbladder wall up to 5 mm or more (Fig. 221). In the case of pericholecystitis development, an indistinct double contour appears. Hypodense, poorly marginated infiltrates and abscesses may form near the gallbladder.
In cases of doubtful ultrasound findings, particularly in acalculous cholecystitis, and in patients with a risk of adverse reactions to iodinated radiopaque agents, cholescintigraphy with a choletropic radiopharmaceutical (99mTc-labeled bromme-zide) can be employed, which demonstrates high (over 90%) sensitivity and Specificity. Following intravenous administration, the passage of the radiopharmaceutical through the biliary tract is tracked. The recording of radioactivity over the liver, bile ducts, and Small Intestine makes it possible to study the dynamics of bile outflow, revealing its deceleration during biliary obstruction and the non-visualization of the gallbladder due to cystic duct obstruction. However, false-positive results are possible, for instance, in severe hepatic dysfunction.
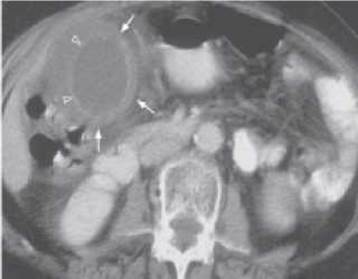
Fig. 221. Acute cholecystitis on contrast-enhanced CT. Thickened wall and enhanced gallbladder mucosa (arrows).
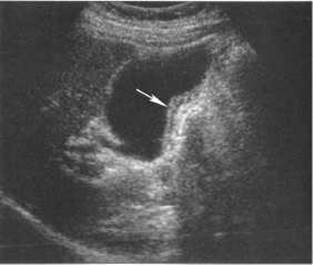
Fig. 222. Chronic cholecystitis on a sonogram. Uneven thickening of the gallbladder wall (arrow).
Chronic cholecystitis may occur independently or develop as a sequel to acute inflammation of the gallbladder. Patients with chronic cholecystitis complain of a bitter taste in the Mouth, discomfort in the hepatic region, and occasionally mild pain. The spread of the inflammatory process to all layers of the gallbladder wall leads to its sclerosis and localized calcium salt deposition. This results in deformation of the gallbladder and the formation of adhesions with adjacent organs.
Radiologically in chronic cholecystitis, due to bile stasis, the opacified gallbladder is enlarged in volume, and its shadow is insufficiently intense. Deformation of the gallbladder, alteration of its normal position, and restricted mobility are observed. Its concentration, evacuation, and contractile Functions are impaired.
In hyperkinetic gallbladder dyskinesia, its size is small and emptying is accelerated. In hypokinetic dyskinesia, the size of the gallbladder is large and its emptying is delayed.
During ultrasound and CT, chronic cholecystitis is diagnosed by the presence of uneven thickening of the gallbladder wall up to 8 mm or more, or its calcification (Fig. 222). If morphological Changes in the gallbladder wall are not pronounced, its ultrasound appearance may be normal.
Last update: 08/08/2026
Editorial and Educational Adaptation: This material has been compiled based on the primary/original source text. The project team performed an editorial review, corrected technical inaccuracies, structured sections, and adapted the content for an educational format.
What was processed:
- elimination of formatting defects (OCR errors, structural breaks, corrupted characters);
- editorial organization of content;
- standardization of terminology in accordance with academic sources;
- verification of factual statements against the original source text.
All mentions of the author, publication year, and origin of the primary text have been preserved in accordance with the source.