Review of Medical Physiology - William F. Ganong 2002
Formation and Excretion of Urine
Regulation of Composition and Volume of Extracellular Fluid
Regulation of H+ Concentration
Since acid-base balance mechanisms are often considered "mysterious," It is important to point out that this equilibrium is determined not by "buffer bases" or "bound cations," but solely by the H+ concentration in the ECF. Mechanisms regulating ICF composition are particularly vital because body Cells are extremely sensitive to changes in H+ ion concentration. Intracellular H+ concentration—which can be measured using microelectrodes, pH-sensitive fluorescent Dyes, and phosphorus magnetic Resonance—differs from extracellular fluid pH and likely influences numerous intracellular processes. Nevertheless, it remains responsive to changes in H+ concentration in the ECF.
The pH value is a convenient way to express H+ concentration in Body Fluids because the absolute concentration of H+ is very low compared to other cations. Under normal conditions, the Na+ concentration in arterial plasma in equilibrium with erythrocytes is about 140 mEq/L, whereas the H+ concentration is only 0.00004 mEq/L (Table 39-1). Thus, pH is the negative decadic logarithm; therefore, the negative logarithm of 0.00004 equals 7.4. Obviously, a one-unit decrease in pH (i.e., from 7.0 to 6.0) corresponds to a tenfold increase in H+ concentration. It is important to remember that Blood pH refers to the pH of true plasma—that is, plasma in equilibrium with erythrocytes—because red Blood Cells contain Hemoglobin, which quantitatively represents one of the most important buffer systems of the blood (see Chapter 35).
Class="center">Table 39-1. H+ ion concentration and pH in various body fluids
H+ Concentration |
pH |
|||
mEq/L |
mol/L |
|||
Gastric juice |
150 |
0.15 |
0.8 |
|
Maximal urine acidity |
0.03 |
3 x 10⁻⁵ |
4.5 |
|
Terminal acidosis |
0.0001 |
1 x 10⁻⁷ |
7.0 |
|
Blood |
Normal |
0.00004 |
4 x 10⁻⁸ |
7.4 |
plasma |
Terminal alkalosis |
0.00002 |
2 x 10⁻⁸ |
7.7 |
Pancreatic juice |
0.00001 |
1 x 10⁻⁸ |
8.0 |
|
H+ Balance
The normal arterial plasma pH is 7.40, while venous pH is slightly lower. Acidosis is generally defined as an arterial pH below 7.40, and alkalosis as a pH above 7.40, although physiological fluctuations within 0.05 units do not cause adverse effects. The extreme H+ concentrations compatible with life span a fivefold range, from 0.00002 (pH 7.7) to 0.0001 mEq/L (pH 7.0). In the Liver, Amino acid METABOLISM during Gluconeogenesis yields NH4+ and HCO3- ions as by-products of their amine and carboxyl groups (Fig. 39-3). The NH4+ ions are excreted as urea, while H+ ions intracellularly combine to form HCO3-. Consequently, only minor amounts of NH4+ and HCO3- enter the bloodstream. However, the metabolism of Sulfur-Containing Amino Acids produces H2SO4, and the metabolism of phosphorus-containing amino acids, such as phosphoserine, produces H3PO4. Entering the bloodstream, these strong acids impose a significant acid load on ECF buffer systems. Normally, amino acid metabolism generates about 50 mEq of H+ per day. Carbon dioxide (CO2), the end-product of tissue metabolism, is extensively hydrated to form H2CO3 (see Chapter 35), and the total H+ input from this source exceeds 12,500 mEq/day. However, most of the CO2 is eliminated by the Lungs, and only a negligible fraction of H+ is excreted by the Kidneys. The most Common sources of additional acid load include strenuous exercise (increased lactic acid production), diabetic ketoacidosis (acetoacetate and ß-hydroxybutyrate), and the administration of acidifying salts such as NH4Cl and CaCl2, which effectively increase HCl input. Renal failure to secrete normal amounts of H+ can also cause acidosis. Fruits are the primary dietary source of alkali; they contain sodium and potassium salts of weak organic acids whose anions are metabolized to CO2, providing the body with NaHCO3 and KHCO3. Although NaHCO3 and other alkalinizing salts are frequently administered in large amounts, the most common cause of alkalosis is the loss of H+ resulting from prolonged, severe vomiting that depletes gastric juice rich in HCl. This is functionally equivalent to the administration of a corresponding amount of alkali.
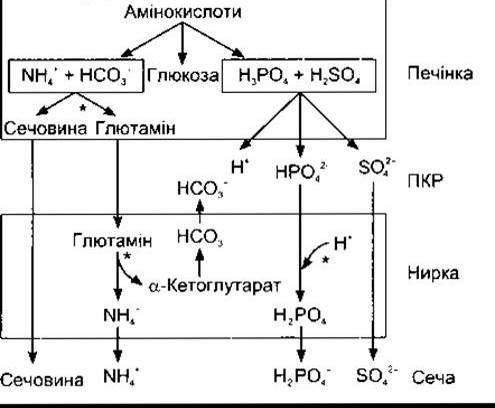
Fig. 39-3. The Role of The Liver and kidneys in eliminating excess acid. Regulatory sites are marked with asterisks (modified and reproduced from Knepper MA et al. Ammonium, urea, and systemic pH regulation. Am J Physiol 1987; 235:F199).
Buffer Systems
Buffer systems are discussed in detail in Chapter 1 and briefly in Chapter 35 in the context of CO2 transport mechanisms in the body. They play a pivotal role in maintaining H+ Homeostasis.
Henderson-Hasselbalch Equation
The general equation describing any buffer system is as follows:
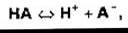
where A represents any anion and HA is the undissociated acid. If an acid stronger than HA is added to a solution containing this buffer system, the equilibrium shifts to the left. H+ ions bind to form additional undissociated HA, meaning the H+ concentration increases much less than it would without the buffer system. Conversely, if a base is added to the system, H+ and OH- ions react to form H2O; however, this causes enhanced dissociation of HA, which compensates for the loss of H+ ions. According to the law of mass action, at equilibrium, the product of the concentrations of the reaction products divided by the product of the concentrations of the reactants is a constant:
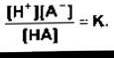
Writing this mathematical expression in terms of pH (the negative decadic logarithm of H+ concentration) yields the equation derived by Henderson and Hasselbalch, which describes pH changes resulting from The addition of H+ or OH- to any buffer system (the Henderson-Hasselbalch equation):
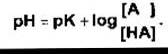
This equation clearly shows that the buffer capacity of a system is maximal when The amount of free anions equals the amount of undissociated HA—that is, when [A-]/[HA] = 1, meaning log([A-]/[HA]) = 0 and pH = pK. Therefore, one would naturally expect the most potent physiological buffer systems to have a pK close to the pH at which they operate. The normal blood pH is 7.4; intracellular pH is 7.2; and urine pH ranges from 4.5 to 8.0.
It is important to note that the Equilibrium Constant K applies strictly only to ideal solutions—namely those in which electrostatic forces between ions can be neglected. When dealing with body fluids, it is more practical to use the so-called apparent ionization constant, K'.
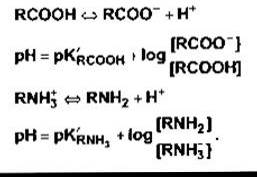
Blood Proteins, particularly Plasma Proteins, are effective buffer systems because both free carboxyl and amine groups are capable of dissociation:
Another crucial buffer system is provided by the dissociation of imidazole groups of Histidine residues within the hemoglobin molecule:
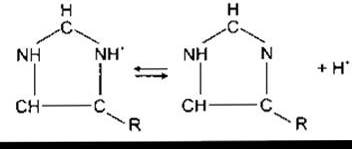
In the pH range of 7.0–7.7, the free carboxyl and amine groups of hemoglobin make only a minor contribution to its buffering capacity. However, because each hemoglobin molecule contains 38 histidine residues and hemoglobin is present in high concentrations in the blood, this protein possesses a buffering capacity six times greater than that of plasma proteins. Furthermore, The behavior of hemoglobin is somewhat unique because the imidazole groups of deoxyhemoglobin dissociate significantly less than those of oxyhemoglobin. Consequently, Hb is a weaker acid and thus a better buffer than HbO2. Titration curves for Hb and HbO2 are shown in Fig. 39-4.
The third major buffer mechanism is the carbonate-bicarbonate system:

The Henderson-Hasselbalch equation for this system is expressed as follows:
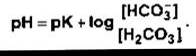
The pK value for this system in an ideal solution is very low (around 3), and the concentration of H2СO3 is also extremely low, making it difficult to measure with sufficient accuracy. However, in the body, H2СO3 exists in equilibrium with СO2:
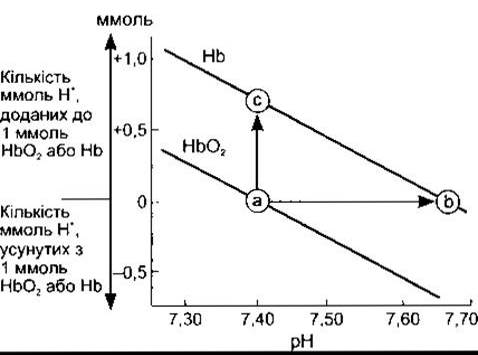
Fig. 39-4. Titration curves of Hb and HbO2. The arrow from a to c represents the amount of mmol of H+ that must be added without a pH shift. The arrow from a to b indicates the pH change in the event of deoxygenation.
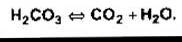
If pK is replaced with pK' (see above) and [CO2] with [Н2С03], then pK' becomes 6.1.
The following form of this equation holds certain clinical and diagnostic significance:
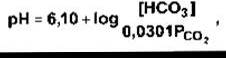
because the concentration of dissolved СO2 is proportional to the partial pressure of СO2 in millimeters of mercury, and the solubility coefficient of СO2 is 0.0301 mmol/L. While [НСO3-] cannot be measured directly, pH and РСO2 can be determined quite accurately using Glass electrodes. The value of [НСO3-] is then calculated.
Although the pK' value of this system remains considerably lower than blood pH, it Functions as one of the body's most effective buffer systems because dissolved СO2 levels are regulated by Respiration. Furthermore, plasma HCO3 concentration is controlled by the kidneys. When H+ ions are added to the blood, the HCO3 concentration decreases as more H2CO3 is formed. If this excess H2CO3 did not break down into H2O and CO2—which is subsequently eliminated through the lungs—H2CO3 concentration would rise continuously. If enough H+ ions were added to Blood Plasma to bind half of the available HCO3 ions, the pH would instantly drop from 7.4 to 6.0. However, In addition to the elimination of excess H2CO3, the rising H+ level stimulates respiration, which lowers РСO2 and drives off additional H2CO3. As a result, the pH drops only to 7.2-7.3 (Fig. 39-5).
Without the specific enzyme Carbonic anhydrase, the chemical reaction СO2 + Н2O ⇄ Н2СO3 proceeds slowly in both directions. While blood plasma lacks carbonic anhydrase, it is present in high concentrations within erythrocytes. Significant amounts are also found in the acid-secreting Cells of the Stomach (see Chapter 26) and the cells of the renal tubules (see Chapter 38). Carbonic anhydrase is a protein with a Molecular Weight of 30,000, containing a single zinc atom per molecule. It is inhibited by cyanides, azides, and sulfides. Sulfonamides also inhibit this enzyme, which is why their derivatives are used clinically as Diuretics due to their inhibitory effect on renal carbonic anhydrase (see Chapter 38).
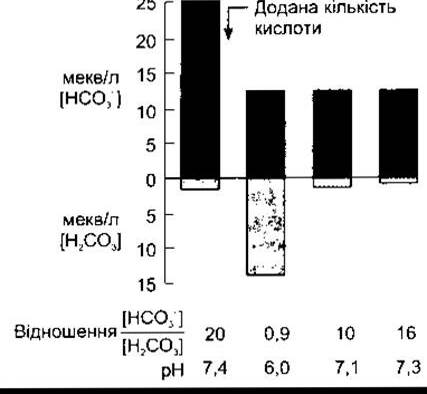
Fig. 39-5. MECHANISM OF ACTION of the blood bicarbonate buffer system. The bars illustrate a stepwise sequence to demonstrate The impact of the initial reaction, the subsequent reduction in H2СO3 content compared to previous values, and its further decrease resulting from enhanced pulmonary ventilation; [Н2СO3] effectively represents the concentration of dissolved СO2. Values in mEq/L are arbitrary.
The H2РO4 ⇄ Н+ + НРO42 system has a pK value of 6.80. Although plasma phosphate concentration is too low for this system to play a major quantitative role, it is vital for maintaining intracellular homeostasis and urine pH (see Chapter 38).
Buffers In Vivo
The body's buffer systems naturally extend far beyond the blood alone. The primary buffer systems of blood, interstitial fluid, and intracellular fluid are summarized in Table 39-2. In CEREBROSPINAL FLUID and urine, the bicarbonate and phosphate buffer systems play the leading role. During metabolic acidosis, only 15-20% of the acid load is buffered by the bicarbonate system; the remaining H+ is buffered primarily inside cells. In metabolic alkalosis, about 30-35% of the excess OH- is buffered intracellularly, whereas in respiratory acidosis and alkalosis, virtually the entire buffering load is handled by intracellular mechanisms.
Table 39-2. Major body buffer systems
Blood |
H2CO3 ⇄ H+ + HCO3- H-Protein ⇄ H+ + Protein- HHb ⇄ H+ + Hb- |
Interstitial fluid |
H2CO3 ⇄ H+ + HCO3- |
Intracellular fluid |
H-Protein ⇄ H+ + Protein- H2PO4 ⇄ H+ + HPO42- |
The primary regulators of intracellular pH in animals are HCO3 transporters. The best-studied among these are the Band 3 Cl--HCO3 exchanger (see Chapter 35), three variants of Na+-HCO3 cotransporters, and one K+-HCO3 cotransporter.
When a strong acid is added to the blood, the main buffer reactions shift to the left. The blood concentrations of the three "buffer anions"—Hb (hemoglobin), Protein, and HCO3—decrease significantly. The acid anions entering the body are filtered in the renal tubules. They are accompanied ("balanced") by cations such as Na+ to maintain electrochemical neutrality. Through the processes described in Chapter 38, tubular Na+ is exchanged for H+ with the simultaneous reabsorption of equimolar amounts of Na+ and HCO3, thereby conserving cations, excreting excess acid, and replenishing the buffer anion reserve. If an amount of CO2 is added to blood plasma, analogous Chemical Reactions take place, except that due to The formation of H2CO3, plasma HCO3 concentration increases rather than decreases.
Respiratory Acidosis and Alkalosis
An elevation in arterial blood РСO2 resulting from hypoventilation is termed respiratory acidosis. CO2 gas exists in equilibrium with H2CO3, which in turn is in equilibrium with HCO3; consequently, the level of HCO3 rises, establishing a new equilibrium state at a lower pH. This is graphically represented by the curve depicting the dependence of HCO3 concentration on pH (Fig. 39-6). Conversely, a decrease in РCO2 leads to respiratory alkalosis.
The initial changes illustrated in Fig. 39-6 occur independently of any compensatory mechanisms, meaning they manifest during uncompensated respiratory acidosis or alkalosis. In either case, these alterations prompt the kidneys to counteract the acidosis or alkalosis by shifting the pH back toward normal.
Renal Compensation
Renal tubular reabsorption of HCO3- depends not only on the filtered load of HCO3—which is arithmetically expressed as the product of the GFR and the plasma HCO3 level—but also on The rate of renal tubular H+ secretion, since HCO3 ions are reabsorbed in exchange for H+. The rate of H+ secretion, and consequently of HCO3 reabsorption, is determined by arterial РCO2. The likely reason for this is that the higher the intracellular concentration of CO2 (from which H2CO3 is formed), the greater the amount of H+ that can be secreted (see Chapter 35). In respiratory acidosis, renal tubular H+ secretion is enhanced, facilitating the elimination of excess H+ from the body. Under these conditions, even if plasma HCO3 levels are already elevated, HCO3 reabsorption is further stepped up, leading to a further increase in plasma HCO3 concentration. Thus, renal compensation for respiratory acidosis results in a transition from the acute to the chronic form of acidosis, as shown graphically in Fig. 39-6. Chloride excretion is concurrently increased; hence, as HCO3 levels rise, plasma Cl concentrations decline. Conversely, in respiratory alkalosis, the reduction in РCO2 slows down renal H+ secretion and HCO3 reabsorption while enhancing HCO3- excretion. This leads to a further reduction in plasma HCO3 concentration, thereby bringing the pH back down to normal values (see Fig. 39-6).
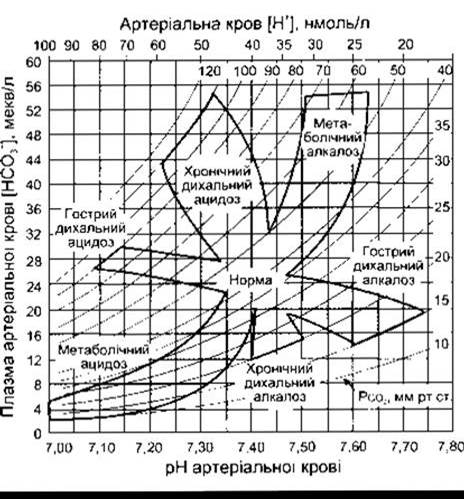
Fig. 39-6. Acid-base nomogram showing changes in РСO2 (curves on the graph), plasma HCO3- concentration, and arterial blood pH during respiratory and metabolic acidosis. Note the shifts in HCO3- concentration and pH changes during compensation for acute respiratory acidosis and alkalosis, which lead to chronic acidosis and alkalosis, respectively (reproduced with permission from Cogan MG, Rector FC Jr: Acid-base disorders. Pages 457-517 In: The Kidney, 4th ed. Brenner BM, Rector FC Jr [editors]. Saunders, 1991).
Metabolic Acidosis
Metabolic acidosis occurs when acids stronger than HHb and other buffer acids enter the blood; conversely, metabolic alkalosis arises when the concentration of free H+ ions decreases due to excessive alkali intake or acid loss. If, for instance, H2SO4 is administered, H+ ions bind to buffers, and the plasma concentrations of Hb, protein, and HCO3 decrease accordingly. The resulting H2CO3 then dissociates into H2O and CO2; Carbon dioxide is rapidly eliminated via the lungs. This typifies uncompensated metabolic acidosis (Fig. 39-7). The elevated concentration of H+ ions actually stimulates respiration, with the result that PCO2 does not rise—or may even remain unchanged—and actually decreases. Thus, respiratory compensation for acidosis drives an even more pronounced rise in pH. Renal compensatory mechanisms ensure The excretion of excess H+ ions, restoring the body's buffer systems to their normal state.
Renal Compensation
Anions that replace HCO3 in plasma during metabolic acidosis undergo filtration, with each anion accompanied by a cation (predominantly Na+) to maintain the overall electrical neutrality of the plasma. Renal tubular cells secrete H+ into the tubular fluid in exchange for Na+ ions; thus, for every H+ ion eliminated by the kidneys, one Na+ ion and one HCO3 ion are gained (see Chapter 38). Were it not for buffer compounds in the urine that bind H+, urinary pH would rapidly plunge to its limiting value of 4.5, rendering the renal excretion of H+ ions negligibly small. However, secreted H+ reacts with HCO3 to form CO2 and H2O (bicarbonate reabsorption); with HPO42 to form H2PO4; and with NH3 to form NH4+. Consequently, a substantial amount of H+ is secreted while a corresponding volume of HCO3 enters the body's fluid compartments to replenish buffer reserves, accompanied by the reabsorption of many physiologically vital cations. Only when extremely large quantities of acid are introduced from the outside are cations lost alongside anions, precipitating marked diuresis and depletion of the body's cation stores. In chronic acidosis, hepatic synthesis of glutamic acid is upregulated, consuming a fraction of the NH4+ ions normally committed to urea synthesis (see Fig. 39-3), while glutamate serves as an additional source of renal NH4+ (see Chapter 38). NH3 secretion ramps up over the course of several days (adaptation of NH3 secretion, see Chapter 38), bolstering renal compensation for acidosis. Furthermore, renal glutamine metabolism yields alpha-ketoglutarate, which subsequently undergoes decarboxylation to generate HCO3; upon entering the bloodstream, this bicarbonate neutralizes excess H+ ions (see Fig. 39-3).
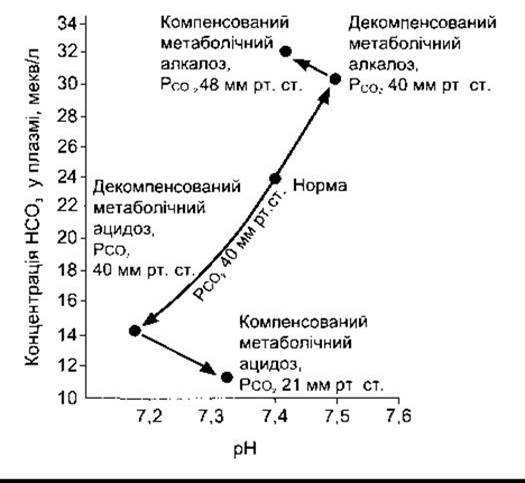
Fig. 39-7. Changes in true plasma pH, HCO3- concentration, and PCO2 during metabolic acidosis and alkalosis (Davenport diagram) (Davenport HW: The ABC of Acid-Base Chemistry, 6th ed. Univ of Chicago Press, 1974).
The addition of a strong acid, such as H2SO4, triggers the following chemical reaction in the blood:

For every mole of incoming H+, 1 mole of NaHCO3 is consumed. In the renal tubules, this chemical reaction runs in reverse:

H+ and SO42 are excreted accordingly. Naturally, H2SO4 is not excreted unchanged; H+ ions appear in the urine in the form of titratable acidity and NH4+.
In metabolic acidosis, respiratory compensation suppresses the renal acid-base regulatory mechanisms, since the marked drop in PCO2 observed under these conditions inhibits acid secretion. Conversely, however, respiratory compensation reduces HCO3 filtration, meaning the net inhibitory effect is relatively modest.
Metabolic Alkalosis
In metabolic alkalosis, plasma levels of HCO3 and CO2 rise (see Fig. 39-7). Respiratory compensation occurs via hypoventilation in response to the drop in plasma H+ concentration, which drives up РCO2. As a result, pH returns toward normal values, while plasma HCO3 concentration increases significantly. This compensatory mechanism is regulated by aortic and carotid body chemoreceptors, which stimulate the respiratory center whenever arterial РO2 drops markedly. In metabolic alkalosis, renal H+ secretion and HCO3 reabsorption are enhanced. Once plasma HCO3 concentration exceeds 26-28 mEq/L, HCO3 begins to appear in the urine. The rise in РСO2 dampens renal compensation by facilitating acid secretion, though the ultimate net effect is relatively minor.
Clinical Assessment of Acid-Base Status
Among the parameters of acid-base balance, arterial blood pH and plasma HCO3 content carry prime clinical importance. Reliable pH readings are obtained using a pH meter and glass pH electrodes. Although plasma HCO3 cannot be measured directly, РСO2 can be determined using CO2 electrodes, allowing HCO3 concentration to be calculated as described above. Venous plasma exhibits a РСO2 that is 7-8 mmHg higher and a pH that is 0.03-0.04 units lower than arterial plasma. This reflects the carriage of CO2 in venous blood en route to the lungs. Consequently, the calculated HCO3 concentration in venous blood is roughly 2 mmol/L higher. Given this, venous blood can generally be substituted for arterial blood in clinical testing.
In the Cytology/practical/136.html">Differential Diagnosis OF metabolic acidosis, the anion gap is a valuable diagnostic metric. Although this term represents a linguistic inaccuracy in scientific nomenclature, it is widely used. Numerically, the anion gap equals the difference between the concentration of unmeasured cations (excluding Na+) and unmeasured anions (excluding Cl and HCO3) in plasma. It is determined primarily by anionic proteins, HPO42, SO42, and organic acids, and normally runs around 12 mEq/L. The anion gap widens with decreases in K+, Ca2+, and Mg2+, increases in the concentration or net charge of plasma proteins, or the accumulation of organic anions such as lactate in the blood. Conversely, it narrows when cation levels rise or plasma albumin drops. The anion gap expands in metabolic acidosis driven by excess ketoacids, lactate, and Other forms of acidosis associated with an overload of organic anions. It remains unchanged in hyperchloremic acidosis resulting from the administration of NH4Cl or carbonic anhydrase inhibitors.
Siggaard-Andersen Curve
When clinicians need to evaluate the acid-base profile of arterial blood, this can be done quickly and easily using the Siggaard-Andersen curve or nomogram. This nomogram takes the form of a logarithmic curve, with pH plotted on the abscissa and РСO2 on the ordinate. Thus, the segment of the curve to the left of the vertical line drawn through pH 7.40 indicates acidosis, while the region to the right indicates alkalosis. The area below the horizontal line corresponding to a РСO2 of 40 mmHg reflects hyperventilation, whereas the area above it represents hypoventilation.
If a solution containing NaHCO3 without buffer systems is equilibrated with gas mixtures containing various amounts of CO2, the pH and CO2 values will change to form a curve shown on the left side of the graph in Fig. 39-8, or along a parallel line. In the presence of buffer substances, the slope of the curve becomes steeper; the greater the buffer capacity of the solution, the steeper the curve. For normal blood containing 15 g of hemoglobin per deciliter, the CO2 titration line passes through the 15 g/dL mark on the hemoglobin scale (on the inner side of the upper curved scale) and the intersection point of PCO2 at 40 mmHg and pH 7.40, as shown in Fig. 39-8. When blood hemoglobin levels are low, a significant loss of buffer capacity occurs, and the slope of the CO2 titration line decreases. However, since blood contains other buffer systems besides hemoglobin, the line drawn from the zero mark of the hemoglobin scale through the intersection of normal pH and PCO2 values is steeper than the curve for a solution devoid of buffer compounds.
In practice, arterial or arterialized capillary blood is collected under anaerobic conditions to measure its pH. The pH of the same blood sample is also determined after equilibration with two gas mixtures of known, varying CO2 content. The pH values corresponding to different PCO2 levels are plotted on a graph and connected to generate the CO2 titration line for that blood sample. The pre-equilibration pH of the blood sample is likewise plotted, and the corresponding PCO2 is read from the vertical scale. The standard bicarbonate content in the blood sample corresponds to the point where the CO2 titration line intersects the bicarbonate scale, which runs parallel to the horizontal axis through the PCO2 value. Standard bicarbonate is not the actual bicarbonate concentration in the sample, but rather the concentration that would prevail if any respiratory influence on the acid-base balance were eliminated. This parameter reflects the alkaline reserve of the blood, even though it is determined by pH rather than the total CO2 content of the equilibrated blood sample. Much like the alkaline reserve, it serves as an indicator of existing metabolic acidosis or alkalosis.

Fig. 39-8. Siggaard-Andersen nomogram (courtesy of O. Siggaard-Andersen and Radiometer, Copenhagen, Denmark).
Additional markings on the upper curved scale of the nomogram (see Fig. 39-8) are used to determine the buffer base content; the point where the arterial blood CO2 calibration line intersects this scale reflects the buffer base concentration in the blood (mEq/L). The term "buffer bases" corresponds to the amount of buffer anions (primarily proteins, HCO3-, and Hb; see Chapter 35) capable of binding H+ ions in the blood. The normal value for an individual with a hemoglobin level of 15 g/dL is 48 mEq/L.
The point where the CO2 calibration curve intersects the lower curved scale of the nomogram corresponds to the base excess.
This value, which is positive in alkalosis and negative in acidosis, represents the amount of acid or base required to restore the normal acid-base status of 1 L of blood at a PCO2 of 40 mmHg. It is important to note that base deficit cannot be fully corrected simply by calculating the difference between the normal standard bicarbonate level (24 mEq/L) and its actual level, and intravenously administering the corresponding amount of NaHCO3. In this case, some HCO3- is converted into CO2 and H2O, with the CO2 being eliminated via the lungs. The actual amount of NaHCO3 required exceeds the standard bicarbonate deficit by a factor of 1.2; however, more precise data can be obtained by using the lower curved scale, which was empirically derived from the analysis of numerous arterial blood samples.
Examples of acid-base disorders are summarized in Table 39-3.
When correcting acid-base disorders, one must consider not only the blood but also other body fluid compartments. Buffer concentrations in other fluids differ significantly from those in the blood. Empirically, it has been established that administering an amount of acid (in alkalosis) or base (in acidosis) equal to the product of 50% of body mass (kg) and the base excess (per liter) is entirely sufficient to fully correct the body's acid-base balance. In cases of severe acid-base disturbances, attempting rapid, single-dose correction can be hazardous. Instead, it is preferable to administer half of the calculated amount of acid or base, reassess the acid-base status and buffer systems after a period, and then calculate the exact amount of acid or base required for final correction. It is also important to note that in acidosis caused by lactate excess, NaHCO3 tends to decrease Cardiac Output and
lower ARTERIAL BLOOD PRESSURE; therefore, it must be used with caution.
Table 39-3. Plasma HCO3- concentration, pH, and PCO2 in various typical acid-base disorders1
Condition |
Parameters |
Causes |
||
pH |
HCO3-, mEq/L |
PCO2, mmHg |
||
NORMAL |
7.40 |
24.1 |
40 |
NH4Cl ingestion |
Metabolic acidosis |
7.28 |
18.1 |
40 |
Diabetic ketoacidosis |
6.96 |
5.0 |
23 |
NaHCO3 administration |
|
Metabolic alkalosis |
7.50 |
30.1 |
40 |
Prolonged vomiting |
7.56 |
49.8 |
58 |
Respiratory acidosis |
|
Respiratory acidosis |
7.34 |
25.0 |
48 |
Inhalation of 7% CO2 |
7.34 |
33.5 |
64 |
Pulmonary emphysema |
|
Respiratory alkalosis |
7.53 |
22.0 |
27 |
Hyperventilation |
7.48 |
18.7 |
26 |
Three-week stay at an altitude of 4,000 m |
|
1 In diabetic ketoacidosis and prolonged vomiting, respiratory compensation for primary metabolic acidosis and alkalosis occurs, causing PCO2 to deviate from its normal value (40 mmHg). In pulmonary emphysema and high-altitude exposure, renal compensation for primary respiratory acidosis and alkalosis develops, resulting in a greater deviation of plasma HCO3- concentration than would occur without renal compensation.
Interrelationship between potassium metabolism and acid-base balance
Potassium (K+) and hydrogen (H+) concentrations in the cerebrospinal fluid are closely linked, partly because K+ influences renal H+ excretion (see Chapter 38). Consequently, metabolic alkalosis is almost invariably accompanied by hypokalemia. K+ deficiency leads to intracellular acidosis, promoting the renal excretion of H+ ions. As a result, H+ is eliminated from the body, and HCO3- reabsorption is enhanced, culminating in extracellular fluid alkalosis. Conversely, K+ excess stimulates its secretion by renal tubular cells.
Last update: 10/08/2026
Editorial and Educational Adaptation: This material has been compiled based on the primary/original source text. The project team performed an editorial review, corrected technical inaccuracies, structured sections, and adapted the content for an educational format.
What was processed:
- elimination of formatting defects (OCR errors, structural breaks, corrupted characters);
- editorial organization of content;
- standardization of terminology in accordance with academic sources;
- verification of factual statements against the original source text.
All mentions of the author, publication year, and origin of the primary text have been preserved in accordance with the source.