LEHNINGER PRINCIPLES OF BIOCHEMISTRY - VOL. 1. THE FOUNDATIONS OF BIOCHEMISTRY: STRUCTURE AND CATALYSIS - 2011
PART I. STRUCTURE AND CATALYSIS
3. AMINO ACIDS, PEPTIDES, AND PROTEINS
3.3. Working with Proteins
Our current understanding of protein Structure and function is built upon decades of research on countless different Proteins. To study a protein, a biochemist must first be able to isolate it from all other cellular components and master the techniques used to examine its properties. This arsenal of experimental Methods forms the core of Protein Chemistry—a discipline as old as biochemistry itself and central to all biochemical research.
Proteins can be Separated and Purified
Before studying a protein's properties, one must obtain it in pure form. How is this possible when Cells contain thousands of Different types of proteins? Separation Methods exploit the fact that proteins vary in size, charge, and binding affinities. Certain modern approaches, including Cell/27.html">DNA Cloning and genome sequencing, can also greatly simplify Protein Purification (see Chapter 9).
Proteins are typically sourced from Tissues or microbial cells. The first step in any Protein Isolation protocol is Cell Disruption, which releases the intracellular proteins into a solution known as a crude extract. To isolate specific cellular fractions or particular Organelles, differential centrifugation is sometimes employed at this stage (Fig. 1-8).
A wide array of methods exists for isolating one or more proteins from a crude extract or organelle preparation. Typically, the extract undergoes an initial fractionation Procedure to separate proteins based on differences in molecular size or charge. This process is called fractionation. The earliest stages of fractionation often rely on differences in Protein solubility, which depends on conditions such as pH, Temperature, and salt concentration. Protein solubility generally decreases at high salt concentrations—an effect known as "salting out." Adding a precise amount of salt can selectively precipitate a specific fraction of proteins while leaving others in solution. Ammonium sulfate, (NH4)2SO4, is frequently used for this purpose. Certain proteins are precipitated by this Treatment (and subsequently removed by low-speed centrifugation), thereby separating them from other proteins remaining in solution.
Next, the protein solution can be subjected to dialysis, a procedure that separates proteins from smaller dissolved solutes by virtue of their large size. The partially purified extract is placed inside a semipermeable membrane tubing and submerged in a large volume of buffered solution of a specific Ionic strength; small salts and buffer components can pass freely through the membrane, whereas proteins cannot. As a result of dialysis, the macromolecules are retained inside the tubing, while the salt concentration inside equilibrates with the surrounding buffer. Dialysis is commonly used, for instance, to remove ammonium sulfate from a protein preparation.
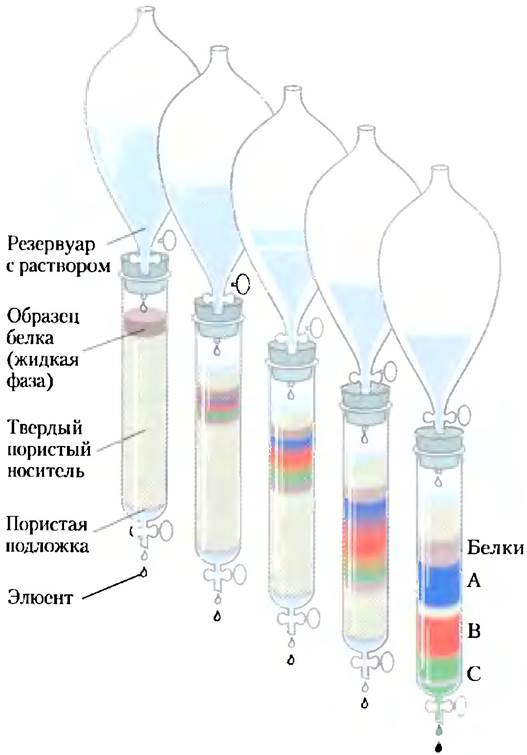
The most powerful method for protein fractionation is Column chromatography, which exploits differences in protein size, charge, binding affinity, and other properties (Fig. 3-16). A column is packed with a solid, porous material (the matrix, or stationary phase) through which a buffered solution (the Mobile phase) percolates. The protein solution is applied to the top of the column and migrates down through the solid matrix as a broadening band within the mobile phase. Individual proteins travel through the column at different rates depending on their specific properties.
Class="center">Fig. 3-16. Column chromatography. Standard column chromatography involves a solid, porous material packed into a Glass or plastic column. The solid material (matrix or support) constitutes the stationary phase, through which liquid (the mobile phase) flows. Solution is continuously supplied from a reservoir at the top, flows down through the column, and emerges at the bottom (as the eluate). The protein mixture to be separated is applied to the top of the column and allowed to enter the solid phase. Solvent is then continuously added. The protein solution forms a band within the mobile phase whose initial width equals that of the applied sample. As the proteins move down the column, they are retarded to varying degrees by interactions with the stationary phase. Consequently, the initial protein band broadens. Individual protein types (A, B, and C, shown in blue, red, and green) gradually separate from one another, each forming a distinct band within the broader profile. The greater the column length, the better the resolution; however, the band of each individual protein also broadens over time due to diffusion, which ultimately impairs resolution. In this example, protein A is well resolved from proteins B and C, but due to diffusion, complete separation of B and C under these conditions is not achievable.
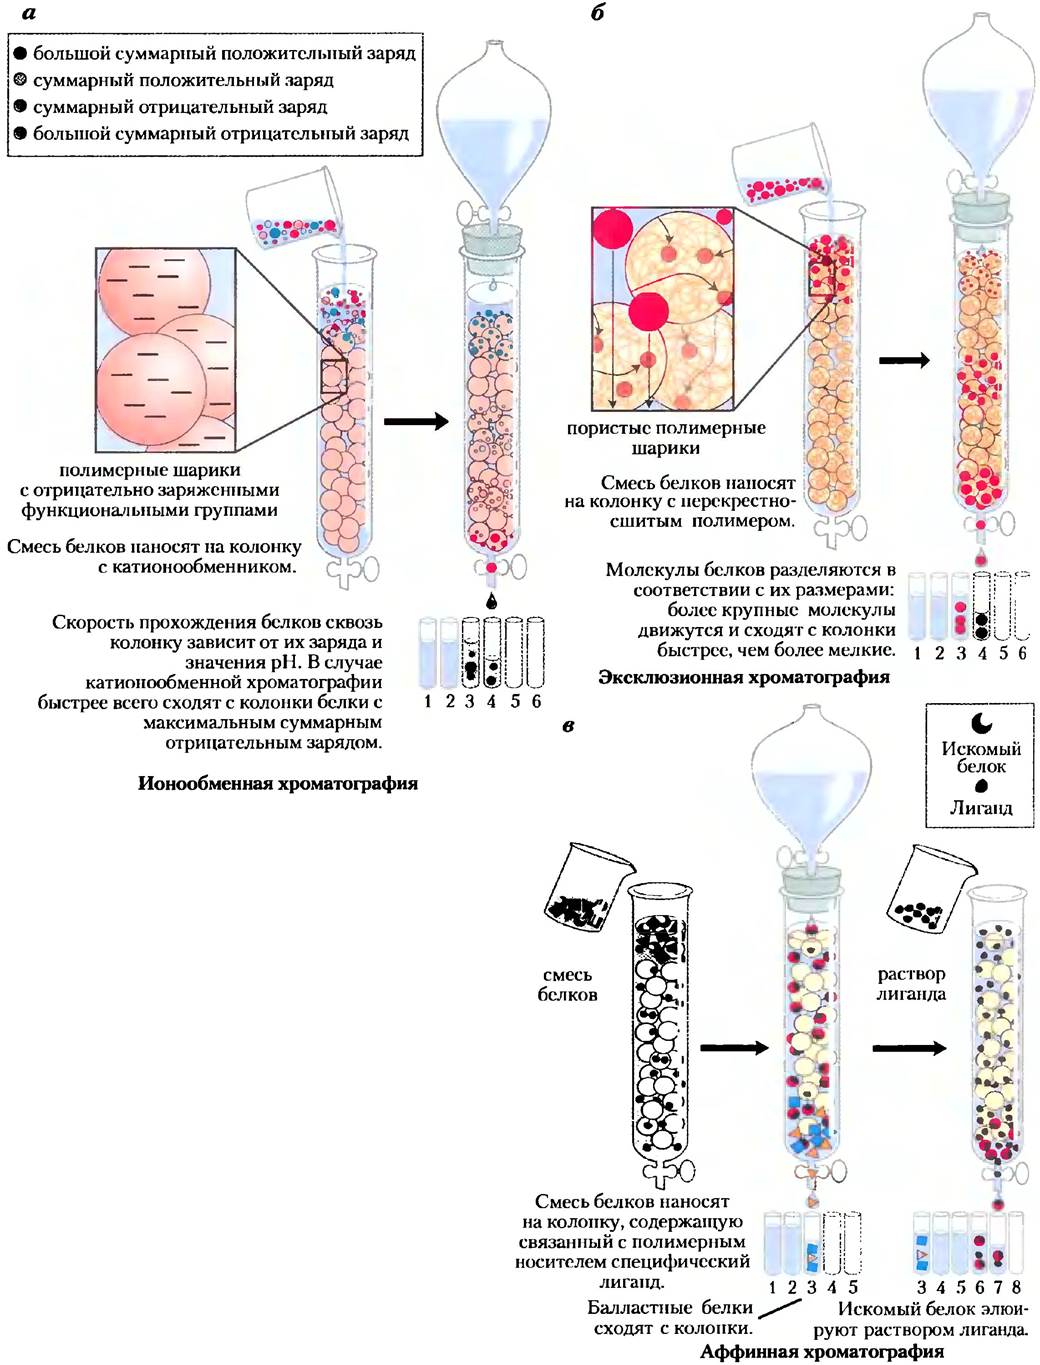
Ion-exchange chromatography exploits differences in the sign and magnitude of the net electric charge of proteins at a given pH. The stationary phase packed into the column consists of a synthetic polymer resin containing covalently bound charged groups. Resins bearing anionic groups are called cation exchangers, whereas those bearing cationic groups are anion exchangers. A protein's affinity for the charged groups of the matrix depends on the pH (which dictates the ionization state of the molecule) and the concentration of competing free ions in the solution. Separation can be optimized by gradually altering the pH and/or salt concentration of the mobile phase, thereby establishing a pH or salt gradient. In cation-exchange chromatography (Fig. 3-17a), the stationary phase carries negatively charged groups. A protein with a net positive charge moves more slowly through the liquid phase than a negatively charged protein, as the migration of the former is retarded by Electrostatic Interactions with the matrix.
Fig. 3-17. Three chromatographic methods commonly used in protein purification: (a) Ion-exchange chromatography, which separates proteins based on differences in the sign and magnitude of their net charge at a specific pH; (b) Size-exclusion chromatography (Gel filtration), which separates proteins by molecular size; (c) Affinity Chromatography, which separates proteins based on their specific binding affinity for a Ligand attached to the matrix. Further details on these methods are provided in the text.
The broadening of the protein band within the mobile phase is driven by both the physical Separation of proteins with different properties and molecular diffusion. As column length increases, the resolution of two proteins with distinct charges generally improves, though the time required for separation also increases. Consequently, excessive separation times can actually degrade band resolution because diffusion eventually becomes the dominant effect. As the solution emerges from the column, the eluate is collected in separate fractions. Each fraction is then assayed for the presence of the target protein alongside any contaminants. All fractions containing the protein of interest can subsequently be pooled.
Box 3-1. Separation of Peptides by Ion-Exchange Chromatography
A biochemist wishes to separate two peptides using ion-exchange chromatography. At the pH chosen for the column run, peptide A has a net charge of -3 due to a higher frequency of Glu and Asp residues compared to Arg, Lys, and His. Peptide B has a net charge of +1. Which peptide will elute first from a column packed with a cation-exchange resin? Which peptide will elute first from an anion-exchange resin?
Solution. A cation-exchange resin has negatively charged groups on its surface and binds positively charged molecules, delaying their migration through the column. Because peptide B carries a net positive charge, it binds more tightly to the cation-exchange resin than peptide A, causing peptide A to elute first. Conversely, peptide B will elute first from an anion-exchange resin. Peptide A, which is negatively charged, is retarded by electrostatic interactions with the positively charged groups of the matrix.
Figure 3-17 also illustrates two Other types of column chromatography. Size-exclusion chromatography (also known as molecular sieve chromatography or gel filtration; Fig. 3-17b) separates proteins by size. In this technique, larger proteins elute from the column faster than smaller ones—which may seem counterintuitive at first. The stationary phase consists of beads containing microscopic pores or cavities of defined dimensions. Large proteins cannot enter these pores and are thus restricted to the spaces between the beads, traveling quickly through the column. Smaller proteins, however, enter the pores, becoming transiently delayed, and consequently migrate through the column much more slowly.
Affinity chromatography is based on the specific binding affinity of proteins for a stationary matrix (Fig. 3-17c). The beads in the column feature covalently attached chemical groups called ligands; a ligand is any molecule or chemical group that binds specifically to a macromolecule (such as a protein). When a protein mixture is applied to the column, any protein with an affinity for the immobilized ligand binds to the beads, thereby retarding its migration. For example, if a protein's biological function involves binding ATP, attaching ATP to the matrix creates an affinity resin tailored for the purification of that protein. As the protein solution passes through the column, all ATP-binding proteins (including the target protein) bind to the matrix. Once non-binding proteins have washed through, the bound proteins are eluted by flushing the column with a solution containing either a high salt concentration or free ligand (in this case, ATP). Salt weakens the protein-ligand interaction by disrupting ionic bonds, whereas free ligand competes with the immobilized ligand for protein binding, releasing the protein from the matrix. However, proteins eluted with free ligand often emerge still complexed with that ligand.
The most sophisticated chromatographic technique is High-Performance Liquid Chromatography (HPLC). This method utilizes high-pressure pumps to accelerate the movement of protein molecules through the column. Furthermore, HPLC employs specially engineered, high-grade chromatographic media capable of withstanding these elevated pressures. By significantly reducing the transit time through the column, diffusion is minimized, resulting in dramatically enhanced resolution.
The purification strategy for a newly discovered protein must be tailored each time using experience and sound judgment. In most cases, successful purification requires the sequential application of several distinct methods that separate proteins based on different physicochemical properties. For instance, if a given purification step isolates ATP-binding proteins from those lacking ATP affinity, the subsequent step must separate the target protein from the remaining ATP-binding proteins based on differences in size or charge. Such choices are often empirical, frequently requiring trial and error to identify the most efficient protocol. This exploratory phase can sometimes be shortened by consulting published purification protocols for homologous proteins. Thousands of protein isolation Procedures are documented in the scientific literature. Common sense dictates that inexpensive techniques, such as salt precipitation, should be applied early in the purification scheme when the total sample volume and impurity load are highest. Implementing chromatographic methods at the very beginning is impractical because Processing large volumes requires excessive quantities of costly column media. As purification proceeds, the volume of the sample typically decreases (Table 3-5), making the subsequent use of more advanced (and expensive) chromatographic techniques feasible.
Table 3-5. Purification Scheme for a Hypothetical Enzyme
Purification procedure |
Fraction volume (mL) |
Total protein (mg) |
Activity (units) |
Specific activity (units/mg) |
1. Crude extract |
1 400 |
10 000 |
100 000 |
10 |
2. Ammonium sulfate precipitation |
280 |
3 000 |
96 000 |
32 |
3. Ion-exchange chromatography |
90 |
400 |
80 000 |
200 |
4. Size-exclusion chromatography |
80 |
100 |
60 000 |
600 |
5. Affinity chromatography |
6 |
3 |
45 000 |
15 000 |
Note: The numerical data reflect the state of the sample following each purification step. The determination of activity and specific activity is described below (p. 140).
Proteins can be separated and characterized by Electrophoresis
Another important protein separation method relies on the capacity of charged proteins to migrate in an electric field—a process known as electrophoresis. Electrophoresis is rarely used for the preparative-scale purification of large quantities of proteins because other, simpler methods are usually available, and the process frequently disrupts Protein Structure and biological activity. However, electrophoresis is exceptionally widely used as an analytical technique. Its advantage lies in the fact that proteins can not only be separated but also visualized, enabling a rapid estimation of the protein composition of a mixture or the purity of a given protein preparation. Electrophoresis can also be used to determine key protein characteristics, such as the isoelectric point and molecular weight.
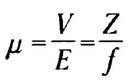
Protein Electrophoresis is typically performed in a gel composed of a cross-linked polymer substance, polyacrylamide (Fig. 3-18). The polyacrylamide gel acts as a molecular sieve in which the migration rate of proteins is proportional to their charge-to-mass ratio. Migration velocity can also be influenced by the shape of the protein molecule. The driving force causing molecules to move in an electric field is the electrical potential (E). The electrophoretic mobility of a molecule (μ) is defined as The ratio of the particle's migration velocity (V) to the electrical potential. Electrophoretic mobility is also equal to the ratio of the net molecular charge (Z) to the frictional coefficient (f), which is related to molecular shape.
Thus, the mobility of a protein in a gel during electrophoresis is determined by its size and shape.
Electrophoresis used for assessing protein purity and molecular weight is carried out in the presence of the detergent sodium dodecyl sulfate (SDS).
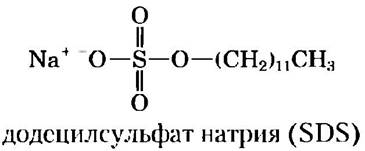
Sodium dodecyl sulfate binds to most proteins in an amount proportional to the protein's molecular weight, approximately one SDS molecule for every two amino acid residues. As a result, the protein molecule acquires a large net negative charge, rendering its intrinsic charge negligible; furthermore, in the presence of SDS, all proteins exhibit virtually the same charge-to-mass ratio. Upon binding SDS molecules, proteins partially unfold and assume approximately the same shape. Consequently, the electrophoretic separation of proteins in the presence of SDS proceeds almost exclusively according to their molecular weights: the smaller the protein, the faster it migrates. Following electrophoresis, proteins are visualized using the dye Coomassie brilliant blue, which stains the proteins but leaves the gel unstained (Fig. 3-18, b).
Fig. 3-18. Electrophoresis. (a) Various protein samples are loaded into wells at the top of a polyacrylamide gel. When an electric current is applied, the proteins begin to migrate through the gel. The gel minimizes both convection currents caused by minor temperature gradients and protein diffusion, except for that associated with movement in the electric field. (b) After electrophoresis, proteins can be visualized by treating the gel with a solution of Coomassie brilliant blue, which binds exclusively to proteins and not to the gel. Each band on the gel corresponds to an individual protein (or protein subunit); smaller proteins migrate faster through the gel than larger ones and are therefore located near the bottom of the gel. Results of the purification of the RecA protein from Escherichia coli (see Chapter 25). The RecA Gene was cloned (Chapter 9) so that its expression (Protein Synthesis) could be regulated. The first lane contains a set of standard marker proteins with known Mr values. The next two lanes show E. coli proteins before and after induction of RecA synthesis, respectively. The fourth lane contains proteins from the crude cell extract. Subsequent lanes (from left to right) successively display samples from each purification stage. The purified protein consists of a single polypeptide chain with Mr = 38 000.

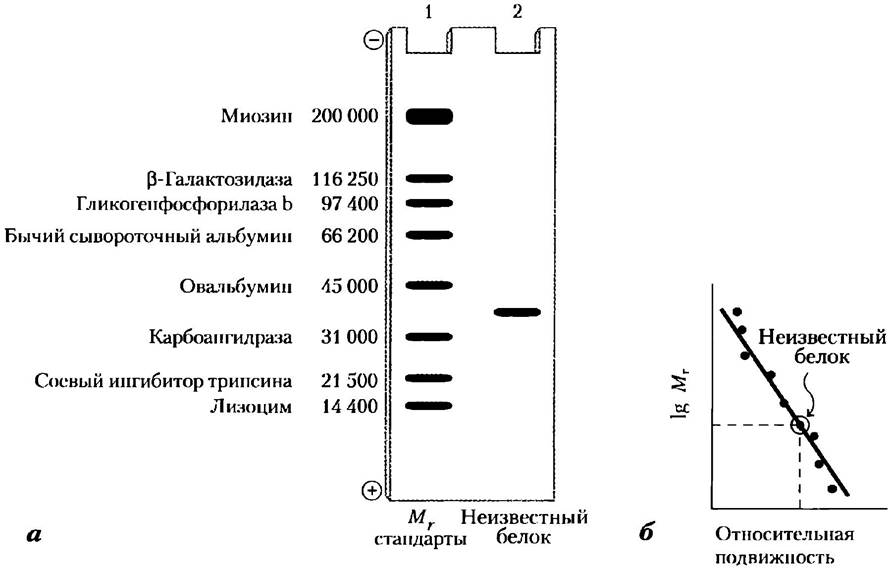
This method is a convenient way to monitor the progress of protein purification by observing the number of protein bands remaining on the gel after each successive purification step. By comparing the distances migrated in the gel by the protein of interest and by reference proteins of known molecular weight, the Molecular Weight of the target protein can be estimated (Fig. 3-19). Multisubunit proteins generally dissociate into individual subunits during SDS-Polyacrylamide gel electrophoresis, each appearing as a separate band. SDS-polyacrylamide gel electrophoresis.
Fig. 3-19. Estimation of protein molecular weight. The molecular weight of a protein can be determined from its mobility during SDS-polyacrylamide gel electrophoresis. (a) A set of marker proteins with known molecular weights (lane 1) is used to determine the molecular weight of an unknown protein (loaded in lane 2). (b) A plot of the relative mobility of the marker proteins versus the logarithm of their molecular weights allows the molecular weight of the unknown protein to be derived.
The numerical value of a protein's isoelectric point (pI) can be determined using the method of isoelectric focusing (Fig. 3-20). A pH gradient is established by means of a mixture of low-molecular-weight organic acids and bases (ampholytes, p. 123) that distribute themselves in the gel under METABOLISM/18.html">The Influence of an electric field. When a protein mixture is applied to the gel, each protein migrates in the electric field until it reaches the pH region that corresponds to its pI value (Table 3-6). Thus, proteins with different isoelectric points become localized in different Zones of the gel.
Fig. 3-20. Isoelectric focusing. This method allows the separation of proteins with different isoelectric points. A pH gradient is formed in the gel using a solution of suitable ampholytes. A protein mixture is then applied to a well in the gel. Upon application of an electric field, the proteins enter the gel and migrate until they reach regions where the pH equals their respective isoelectric points (since at pH = pI, the net charge of the protein is zero).
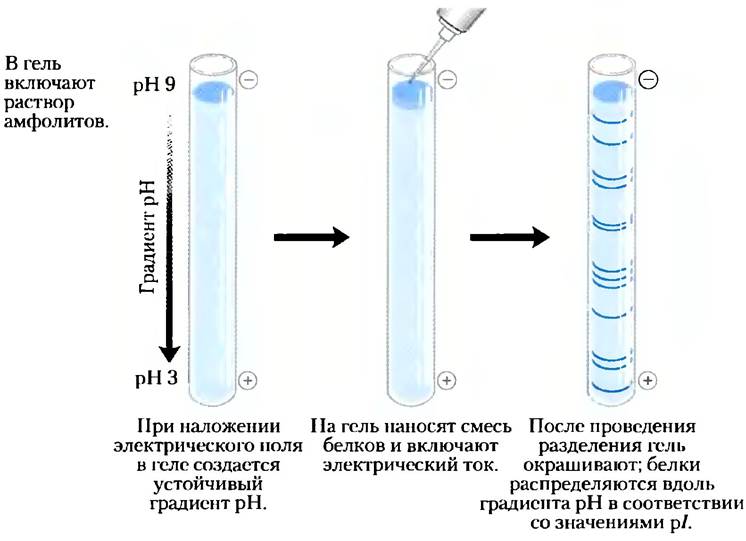
Table 3-6. Isoelectric points of selected proteins
Protein |
pI |
<1.0 |
|
Egg albumin |
4.0 |
Serum albumin |
4.9 |
Urease |
5.0 |
β-Lactoglobulin |
5.2 |
6.8 |
|
7.0 |
|
Chymotrypsinogen |
9.5 |
Cytochrome c |
10.7 |
11.0 |
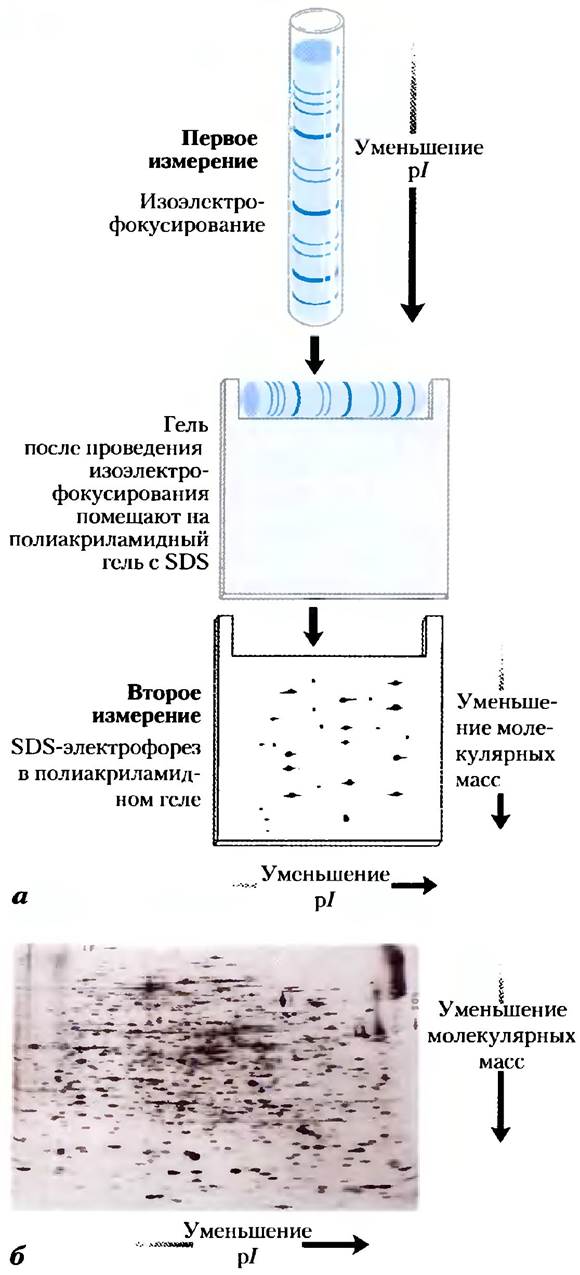
Complex protein mixtures can be resolved by sequentially employing isoelectric focusing and SDS-polyacrylamide gel electrophoresis in a technique known as two-dimensional electrophoresis (Fig. 3-21). This method is significantly more sensitive than one-dimensional electrophoresis. Two-dimensional electrophoresis makes it possible to separate proteins with identical molecular weights but different pI values, as well as proteins with the same pI but different molecular weights.
Fig. 3-21. Two-dimensional electrophoresis. (a) In the first dimension, proteins are separated by isoelectric focusing in a cylindrical gel. The gel is then placed horizontally onto a second, slab gel, and the proteins are subjected to SDS-polyacrylamide gel electrophoresis. Proteins are separated horizontally according to their pI values and vertically according to their molecular weights. (b) This approach can resolve more than 1 000 different proteins present in E. coli cells.
Assaying protein content in unseparated mixtures
During protein purification, it is essential to have a means of monitoring the presence and determining the quantity of the target protein within an unseparated protein mixture. Frequently, however, purification must be undertaken with little or no prior information regarding the protein's molecular weight, physical properties, or fractional contribution to the total cellular protein. In the case of Enzymes, their amount in solution or tissue extracts can be measured, or at least estimated, on The basis of their catalytic activity—that is, by the increase in The rate of substrate conversion in the presence of the enzyme sample. To accomplish this, the following parameters must be known: (1) the overall equation for the enzymatic reaction; (2) an analytical assay that measures the depletion of substrate or the accumulation of product; (3) the dependence of enzyme activity on any Cofactors (Metal Ions) or Coenzymes; (4) the Dependence of enzymatic activity on Substrate Concentration; (5) the pH optimum; and (6) the temperature range over which the enzyme is active and stable. Enzyme activity assays are typically conducted at their optimal pH and at temperatures between 25 and 38 °C. Furthermore, very high substrate concentrations are routinely used so that the initial reaction velocity remains directly proportional to the Enzyme Concentration (Chapter 6).
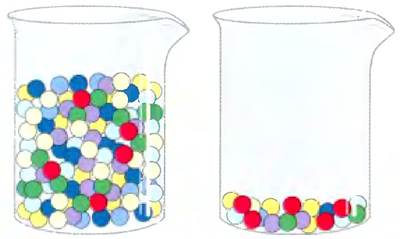
Enzymatic activity is conventionally measured in international enzyme units. By international agreement, one unit of enzyme activity is defined as The amount of enzyme that catalyzes The conversion of 1 µmol of substrate per minute at 25 °C under optimal reaction conditions (though this definition is inappropriate for certain enzymes, which are measured differently). The term activity refers to the total number of enzyme activity units in a sample. Specific activity is defined as the number of enzyme activity units per milligram of total protein (Fig. 3-22). Specific activity serves as a measure of enzyme purity: it increases during the purification process, reaches a maximum, and remains constant once the enzyme is completely pure (Table 3-5, p. 136).
Fig. 3-22. Activity and specific activity. The difference between these two concepts can be illustrated by the example of two beakers containing marbles. Both beakers contain the same number of red marbles, but different numbers of marbles of other colors. If the marbles represent proteins, both beakers contain the same amount of activity for the protein represented by the red marbles. However, the specific activity of this protein is higher In the second beaker because the red marbles make up a larger fraction of the total number of marbles.
Following each purification step, the enzymatic activity of the sample (in enzyme units) and the total protein content should be determined; the ratio of these two values yields the sample's specific activity. Both total activity and total protein typically decrease during preparation purification. Enzymatic activity drops because purification inevitably involves some degree of Enzyme inactivation, for instance, due to unfavorable interactions with chromatographic matrices or other molecules. Total protein decreases because the very goal of purification is to remove as much unwanted or nonspecific protein as possible. A purification step is considered successful if the loss of nonspecific protein significantly outweighs the loss of activity; consequently, the specific activity of the sample increases even though the total activity declines. Data concerning purification steps and their results are compiled into tables similar to Table 3-5. A protein is considered pure if further purification fails to increase its specific activity and if Analytical Methods (such as electrophoresis) detect only a single protein band.
For proteins lacking enzymatic activity, alternative detection methods are required. Transport proteins can be assayed by their binding to the molecules they transport, whereas Hormones and toxins are identified by their biological effects. For example, growth factors must stimulate the proliferation of specific cell cultures. Certain structural proteins constitute such a large fraction of the total cellular or tissue protein that they can be isolated and purified quite easily without functional assays. In this regard, there are as many problem-solving approaches as there are proteins themselves.
Summary of Section 3.3 Working with Proteins
■ Methods for protein purification and fractionation are based on differences in their properties. Proteins can be selectively precipitated by adding specific salts to the solution. There are several chromatographic separation techniques based on differences in molecular weight, affinity, charge, and other protein properties. The most frequently used chromatographic methods include ion-exchange, size-exclusion, affinity, and high-performance liquid chromatography.
■ Electrophoretic methods allow the separation of proteins based on differences in molecular weight or charge. SDS-polyacrylamide gel electrophoresis and isoelectric focusing can be used either individually or in combination to achieve higher resolution.
■ Any protein purification procedure requires a method to monitor the target protein in the presence of all other proteins in the mixture. Specific activity serves as a reliable measure of protein purity.
Last update: 06/08/2026
Editorial and Educational Adaptation: This material has been compiled based on the primary/original source text. The project team performed an editorial review, corrected technical inaccuracies, structured sections, and adapted the content for an educational format.
What was processed:
- elimination of formatting defects (OCR errors, structural breaks, corrupted characters);
- editorial organization of content;
- standardization of terminology in accordance with academic sources;
- verification of factual statements against the original source text.
All mentions of the author, publication year, and origin of the primary text have been preserved in accordance with the source.