Biochemical Engineering Fundamentals, Part 1 - Bailey J., Ollis D. 1989
Stoichiometry and Energetics of Metabolic Conversions
Stoichiometry of Cell Growth and Product Formation
Conclusions
We now know that a vast number of extremely complex chemical transformations take place within a living Cell. Despite the intricate chemistry of cellular processes, certain key compounds and reactions common to all pathways of cellular METABOLISM can very frequently be identified. Perhaps the most important processes of this type are energy transport via ATP (Fig. 5.33) and The transport of reducing equivalents in the form of NAD. We have also learned that stoichiometric relationships at various levels can be used to elucidate the interrelationships among different chemical transformations that comprise cellular metabolism.
In the next chapter, we will conclude our brief Study of the biology and biochemistry of the living cell, and then proceed to the challenging problem of analyzing, studying, and engineering technological processes that utilize biological reactions.
Class="center">
FIG. 5.33. Energy Flow diagram in The Cell and its environment. (Levy, A., Sikiševič, F., Structure and function of the Cell. Moscow: Mir, 1971.)
Exercises
5.1. Equilibrium. The Standard Free energy change for the reaction phosphoenolpyruvate + ADP → Pyruvate + ATP is —7.50 kcal. Calculate the concentrations of all species if the initial mixture contained 6.0 mM ADP, 6.0 mM phosphoenolpyruvate, 6.0 mM ATP, and no pyruvate.
5.2. Functions of Chemical Elements. Name the major biological function(s) in the cell and the dominant chemical form for performing each function for each of the elements and compounds listed in Table 5S2.1. Do all of the ash-forming elements actually have a definite biochemical function? [See Frey, C. N., Ind. Eng. Chem., 22, 1154 (1930).]
Table 5S2.1. Approximate composition of ash formed upon Complete oxidation of Yeast
Component |
Approximate content, % |
Component |
Approximate content, % |
Phosphorus pentoxide |
50 |
Silicon oxide |
1 |
Potassium oxide |
35 |
Sodium oxide |
1 |
Magnesium oxide |
5 |
Sulfur trioxide |
0.5 |
Calcium oxide |
1 |
Chlorine, iron |
Trace |
5.3. Standard Free Energy Change. The free energy change of a reaction, ∆G, is related to the electrode potentials E1 and E2 of the individual half-reactions by the following equation:

where n is the number of electrons transferred per molecule transformed, ℱ is the Faraday constant [ℱ ≈ 23 kcal/(V∙mol)], and Ei (i = 1, 2) is determined by the Nernst equation:

where si is the concentration of the reactant in its oxidized or reduced form, and Ei0 is the electrode potential at si,red/si, ox = 1.0 relative to the standard hydrogen half-cell:

The electrode potentials for several required reactions are given in Table 5S3.1.
Table 5S3.1a
Electrode reaction |
n |
E0, V |
Acetate + CO2 + 2H+→ pyruvate + 2H2O |
2 |
-0.70 |
Acetoacetate + 2H+→ β-hydroxybutyrate |
2 |
-0.27 |
Pyruvate + 2H+→ lactate |
2 |
-0.19 |
S + 2H+→ H2S |
2 |
-0.23 |
1/2O2 + 2H+→ H2O |
2 |
0.82 |
NAD(P)+ + 2H+ → NAD(P)H + H+ |
2 |
-0.32 |
FAD + 2H+ → FADH2 (free coenzyme) |
2 |
-0.18 |
Chlorophyll+ → chlorophyll* + e- (Photosynthesis in eukaryotes, non-cyclic part) |
1 |
-0.2 |
Chlorophyll+ → chlorophyll (photosynthesis in eukaryotes, non-cyclic part) |
1 |
0.9 |
NO3- + 2H+ → NO2- + H2O |
2 |
0.42 |
SO42- + 2H+→ SO32- + H2O |
2 |
0.48 |
Acetate + 2H+→ acetaldehyde + H2O |
2 |
-0.60 |
Acetaldehyde + 2H+→ ethanol |
2 |
-0.20 |
a Data from: Wood, W. B., Wilson, J. H., Benbow, R. M., Hood, L. E., Biochemistry: A Problems Approach, pp. 190–191, W. A. Benjamin, Inc., Palo Alto, CA, 1974.
Using the standard electrode potentials given in the table, determine whether the following reactions are feasible under standard conditions:
a) Electron transfer from excited chlorophyll,
b) oxidation of ß-hydroxybutyrate by oxygen,
c) oxidation of acetaldehyde by acetaldehyde (dismutation or radical disproportionation).
5.4. Free Energy Change in the Cell. a) Based on the data given in Table 5.3, calculate the free energy change for each step of Glycolysis in human erythrocytes.
b) Using your results and the Free energy of ATP Hydrolysis to ADP under the same conditions, demonstrate the necessity of ATP for driving individual steps in which it participates.
c) Based on the previous calculations, determine the total change in free energy ∆G' during glycolysis within the cell.
5.5. Kinetics of coupled reactions. Although numerous reactions occur simultaneously within a cell, the apparent kinetics of a reaction sequence is often determined by a very small number of steps.
a) Show that in the steady state, the mathematical expression defining The rate of P formation in a reaction sequence that formally corresponds to the Michaelis — Menten scheme
E + S ⇄ ES → Е + Р
does not differ from the corresponding expression for a sequence of equilibrium reactions:
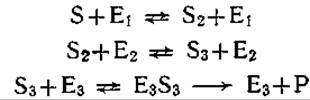
b) The ten sequential reactions shown in Fig. 5.4 can be expressed by just three kinetic equations describing

Name substances A, B, and C. Table 5U5.1
Substrate |
∆G°', kcal/mol |
Substrate |
∆G°', kcal/mol |
Phosphoenolpyruvate |
-12.8 |
Glucose-1-phosphate |
-5.0 |
1,3-Bisphosphoglycerate |
-11.8 |
Fructose-6-phosphate |
-3.8 |
Phosphocreatine |
-10.5 |
Glucose-6-phosphate |
-3.3 |
Acetyl phosphate |
-10.1 |
3-Phosphoglycerate |
-3.1 |
ATP (terminal bond) |
-7.3 |
Glycerol-1-phosphate |
-2.3 |
c) Table 5U5.1 lists the standard free energies of hydrolysis for A number of phosphates. How will the free energy difference calculated by you (in Exercise 5.4) for the three steps specified in item b change if the intracellular ATP/ADP ratio decreases 10-fold (at a constant total concentration of ATP+ADP)? What beneficial (or detrimental) effect will this change produce for the cell?
5.6. ATP regeneration. Coupling with the hydrolysis of ATP to ADP or AMP allows the cell to drive numerous reactions with unfavorable equilibrium constants. Using free Enzymes for similar synthesis would ultimately require transferring a phosphate group (to regenerate ATP) from a system with a higher free energy of hydrolysis.
a) What is the cost per pound of each compound listed in Table 5U5.1 whose free energy of hydrolysis exceeds the ∆G' of ATP? (Data can be obtained from any biochemical reagent catalog.)
b) What must the concentration of the phosphorylated compound (glucose-1-phosphate, fructose-6-phosphate, glycerol-1-phosphate) be to generate ATP from ADP at the concentrations specified in Table 5.3?
5.7. NAD regeneration in enzymatic steroid transformations. The method for steroid transformation in the presence of 20β-hydroxysteroid dehydrogenase (20ß-HSDH) [Cremonesi P. et al., Enzymatic preparation of 20ß-Hydroxysteroids in a two phase system, Biotech. Bioeng., 17, 1101 (1975)] consists of three steps:
Hydrogenation of the steroid:

Oxidation of ethanol:

Binding of acetaldehyde:

The Equilibrium Constant for the coupled reactions (1) and (2) is close to unity.
a) Estimate the thermodynamic probability of cortisone conversion, assuming that the equilibrium constant for reactions (1) and (2) equals 1, and that the equilibrium constant for reaction (3) (which must also be reversible at equilibrium) is 10, 103, 105, 1010 (in units of reciprocal concentration). Express the results as a graphical plot of the degree of cortisone conversion versus lg K.
b) Since Steroids have relatively low Water solubility (1 L of a saturated aqueous solution contains from 10-4 to 10-5 mol of steroid), organic Solvents forming a two-phase system are added to increase the total amount of cortisone in the system. Thus, the organic phase, which contains relatively high steroid concentrations (0.160 g of cortisone dissolves in 100 mL of butyl acetate), acts as a reserve source that continuously replenishes the aqueous phase. Estimate the maximum possible degree of cortisone conversion, assuming that the volume fraction of butyl acetate in the water-butanol emulsion is ε, the solubility of cortisone in water is 10-4 mol/L, dihydrocortisone has the same solubility in water as cortisone and is insoluble in butyl acetate, and the equilibrium constant K of reaction (3) is 10, 103, or 105. Perform the same calculations assuming that the solubility of dihydrocortisone in 100 mL of butyl acetate is 0.160 g.
c) List the thermodynamic mechanisms utilized in this process to drive reaction (1).
5.8. Permeability. Derive equation (5.40) and justify all assumptions.
5.9. Material balance of substances involved in a network of interconnected reactions. Suppose you have a somewhat absent-minded friend who, unfortunately, is not a very skilled experimenter. During a laboratory session, he performed a Fermentation experiment, but forgot to weigh the added glucose and determine the alcohol content in the resulting mixture. He found that the fermentation yielded the substances listed in Table 5.9.1. He knows that all glucose (С6Н12О6) is oxidized via the EMP pathway to pyruvic acid (СН3СОСООН) and that no by-products other than ethanol should be formed. He asks you to help him sort out this confusion. What should you tell him in response to his question about how many moles of ethanol were formed? (Justify your answer.)
Table 5.9.1
Substance |
Amount, mol |
Substance |
Amount, mol |
Lactic acid СН3СНОНСООН |
10 |
Carbon dioxide СО2 |
15 |
Acetic acid СН3СООН |
5 |
Hydrogen Н2 |
10 |
5.10. Defining "life". Express your thoughts on the necessity (or lack thereof) of each word in the following DEFINITION OF LIFE [Perrett J., New Biol., 12, 68 (1952)]: "Life is a potentially self-maintaining open system of coupled organic reactions, catalyzed stepwise and practically isothermally by complex and specific organic catalysts produced by the system itself." More recent Definitions of life can be found, for example, in: Bernal J. D., Theoretical and Mathematical Biology, p. 96, Blaisdell Publ. Co., N.Y., 1965.
5.11. Free Energy and electron transfer. Intracellular precursor compounds are typically ions; on the other hand, free energy transfer in glycolysis, the TCA cycle, mitochondrial, and other metabolic processes is closely coupled with electron migration. It follows that the energetics of intracellular processes can be evaluated in units that reflect electron transfer phenomena. McCarty, in the article "Energetics of Organic Matter Degradation" (Water Pollution Microbiology, Mitchell R. (ed.), p. 91, Wiley-Interscience, New York, 1972), proposed using a specific parameter—the coefficient Ye (the grams of Cells per chemical equivalent of cells formed), defined as
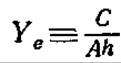
where С is the grams of cells per chemical equivalent in their oxidation half-reaction; h is the number of electrons actually transferred from the donor molecule divided by the number of chemical equivalents per mole (in the corresponding electrode half-reaction), typically h = 1.0; А is The ratio of the number of chemical equivalents of the electron donor (energy source) to the number of chemical equivalents of the cells formed.
If the elemental formula of the cell is C5H7O2N and the oxidation half-reaction is expressed by the equation

then the calculated value of С is 5.65.
a) Verify the correctness of the calculated value of С.
б) Verify the correctness of The values of А and Yе given in Table 5.11.1 using other data from the same table.
Table 5.11.1. Determination of Ye coefficients based on substrate oxidation energy parameters (K = 0.6; nitrogen source — ammonia)a
Electron donor |
Electron acceptor |
∆Grб, kcal |
∆Gp, kcal |
А (calculated) |
Ye (calculated), g/eq |
Acetate |
O2 |
—25.28 |
1.94 |
0.71 |
7.96 |
NO3-(reduction to N2) |
—23.74 |
1.94 |
0.76 |
7.43 |
|
SO42- |
—1.52 |
1.94 |
11.8 |
0.48 |
|
СO2 |
—0.85 |
1.94 |
21.1 |
0.27 |
|
Glucose |
O2 |
—28.70 |
—1.48 |
0.38 |
14.90 |
СO2 |
—4.26 |
—1.48 |
2.58 |
2.19 |
|
Ethanol |
O2 |
—26.27 |
0.95 |
0.58 |
9.76 |
СO2 |
—1.83 |
0.95 |
8.3 |
0.67 |
a McCarty P. L., in Water Pollution Microbiology, Mitchell R. (ed.), p. 107, Wiley-Interscience, New York, 1972.
б Reaction products and reactants under standard conditions, except for pH (pH 7).
If K is always assumed to be 0.60 (as in Table 5.14.1), the calculated values of А typically differ from the experimental values (for 25 systems, approximately half of which are anaerobic and the other half aerobic) by no more than 50%.
The value of А required in the definition of Ye (see above) is found using the equation

where ∆Gp is the free energy required to convert carbon source substances in cell synthesis into intermediates;
∆Gn is the free energy required to convert inorganic nitrogen sources into ammonia (whose oxidation state corresponds to the oxidation state of nitrogen in cellular matter);
∆Gc is the free energy required to convert intermediates (carbon sources) and ammonia into cell components (accounting for process efficiencies, ∆Gc ≈ 7.5 kcal per chemical equivalent of cells);
К is the average free Energy Transfer Efficiency (in heterotrophs or autotrophic Bacteria, K = 0.4–0.8);
∆Gr is the free energy change upon The oxidation of 1 chemical equivalent of the substrate.
Given the cell stoichiometry specified above, depending on the nitrogen source, the value of ∆Gn is 0 (ammonia), 3.25 (nitrite), 4.17 (nitrate), and 3.78 (N2).
5.12. Coupled transport. Assume that component A is insoluble in a membrane of thickness L and that its concentrations at the outer and inner membrane surfaces are a1 and a2, respectively. Carrier B, which exists solely within the membrane, forms an AB complex at the membrane surface. Assuming that the complexation reaction is at equilibrium at either membrane surface (though not within its interior) and that the equilibrium constants are K1 and K2, determine the flux of A from surface 1 to surface 2 given the diffusion coefficient of AB. Under what conditions (if such conditions are at all possible) will Active Transport of A take place?
5.13. Cell growth stoichiometry and yield coefficients, a) Assuming that cells can convert two-thirds (by mass) of a carbon-containing substrate (hydrocarbon or glucose) into biomass, calculate the "stoichiometric" utilization coefficients for hexadecane or glucose:
Hexadecane:

Glucose:

b) Calculate the three coefficients Ys, Y0, and Y∆. Note that Y0 and Y∆ for the hydrocarbon are lower than the corresponding coefficients for glucose, even assuming equal efficiencies of carbon conversion into biomass.
5.14. In vitro metabolic reactions. Yeast extract is incubated with 200 mmol of D-glucose, 20 mmol of ATP, 2 mmol of NAD+, and 20 mmol of phosphate (the extract contains all enzymes necessary to convert glucose to ethanol). What will the equilibrium concentrations of glucose and ethanol be? How can the fermentation process be driven to completion?
5.15. Energy efficiency of glucose storage as Glycogen. Compare The amount of energy required to incorporate a single glucose molecule into glycogen with The energy released during the subsequent degradation of a single glucose residue via a) fermentation and b) Respiration. What energetic conditions favor glycogen accumulation?
5.16. Special cases of metabolic stoichiometry. To estimate stoichiometric coefficients in metabolic processes, it has often been proposed to determine the respiratory quotient [RQ; Equation (5.51)]. a) Find a system of two linear algebraic equations with two unknowns, a and b, appearing in Equations (5.53) and (5.54) at d [NADH + H+]/dt = 0, using the definition of RQ. b) Find the conditions under which the coefficient matrix in the equations for a and b becomes singular (i.e., has a zero determinant); explain the physical significance of such conditions. c) It has been reported that during yeast growth (y = 4.14) on glucose (ys = 4.0) and ammonia (yN = 0), the Biosynthesis-associated CO2 evolution is low (σ = 0.095). Calculate a and b for RQ values of 1.05 and 1.06. Explain the practical utility of using RQ for determining metabolic stoichiometry in this system [12].
Bioenergetics
As supplementary reading, references [4–6] in Chapter 2 are recommended, along with the following sources:
1. Lehninger A. L., Bioenergetics, 2d ed., W. A. Benjamin, Inc., New York, 1971.
2. Peusner L., Concepts in Bioenergetics, Prentice-Hall, Inc., Englewood Cliffs, N.J., 1974. This monograph places significantly greater emphasis on Thermodynamics in The Study of bioenergetics.
Metabolism
All literature cited in Chapter 2 is recommended, as well as the following sources:
3. Doelle H. W., Bacterial Metabolism, 2d ed., Academic Press, New York. An excellent Overview of major metabolic processes in various bacteria.
4. Atkinson D. E., Cellular Energy Metabolism and Its Regulation, Academic Press, New York, 1977. This in-depth monograph focuses primarily on The Role of energetic factors in the REGULATION OF METABOLISM.
Stoichiometry of Cell Growth and Product Formation
5. Atkinson B., Mavituna F., Biochemical Engineering and Biotechnology Handbook, Macmillan Publishers Ltd., Surrey, England, 1983. This reference book compiles an excellently curated and well-organized collection of data and information regarding the topic of this chapter and other interesting subjects.
6. Pirt S. J., Principles of Microbe and Cell Cultivation, Blackwell Scientific Publications, Oxford, 1975. This provides a clear explanation of THE CONCEPT OF yield coefficients and many Other Aspects of cell growth.
7. Herbert D., Stoichiometric Aspects of Microbial growth, p. 1 in Continuous Culture 6: Applications and New Fields, Dean A. C. R., Ellwood D. C., Evans C. G. T., Melling J. (eds.), Ellis Horwood Ltd., Chichester, England, 1976. This offers a clear explanation of the C-mole concept and discusses its significance.
8. Roels J. A., Simple Model for the Energetics of Growth on Substrates with Different Degrees of Reduction, Biotech. Bioeng., 22, 33 (1980).
9. Poels J. A., Bioengineering Report: Application of Macroscopic Principles to Microbial Metabolism Biotech. Bioeng., 22, 1437 (1980).
10. Erickson L. E., Minkevich I. G., Eroshin V. K. Application of Mass and Energy balance Regularities in Fermentation, Biotech. Bioeng., 20, 1595 (1978).
11. Nagai S., Mass and Energy Balances for Microbial Growth Kinetics, p. 49, in Advances in Biochemical Engineering, v. 11, Ghose T. K., Fiechter A., Blakebrough N. (eds.), Springer-Verlag, Berlin, 1979.
12. Stephanopoulos G., San K. Y., Grosz R., Studies on On-Line Bioreactor Identification I—IV; Biotech Bioeng., 26, 1176, 1189, 1198, 1209 (1984).
13. Stouthamer A. H., A Theoretical Study on the Amount of ATP Required for the Synthesis of Microbial Cell Material; Anton, van Leeuwenhoek, 39, 545 (1973).
14. Minkevich I. G., Mass-Energy Balance for Microbial Product Synthesis — Biochemical and Cultural Aspects, Biotech. Bioeng., 25, 1267 (1983).
15. Cooney C. L., Acevedo F., Theoretical Conversion Yields for Penicillin Synthesis, Biotech. Bioeng., 19, 1449 (1977).
Heat generation in metabolic processes
See references [5, 6, 8, 9, 11, 14] and [4] in Ch. 14 above, as well as the following literature:
16. Abbott В. J., Clamen A., The Relationship of Substrate, Growth Rate, and Maintenance Coefficient to SINGLE CELL PROTEIN Production, Biotech. Bioeng., 15, 117 (1973).
17. Kanazawa M., The production of Yeast from n-Paraffins, p. 438 in Single Cell Proteins II, Tannenbaum S., Wang D. I. C. (eds.), MIT Press, Cambridge, MA, 1975.
18. Servizi J. A., Bogan R. H., Thermodynamic Aspects of Biological Oxidation and Synthesis, J. Water Poll. Control Fed., 36, 607 (1961).
Last update: 06/08/2026
Editorial and Educational Adaptation: This material has been compiled based on the primary/original source text. The project team performed an editorial review, corrected technical inaccuracies, structured sections, and adapted the content for an educational format.
What was processed:
- elimination of formatting defects (OCR errors, structural breaks, corrupted characters);
- editorial organization of content;
- standardization of terminology in accordance with academic sources;
- verification of factual statements against the original source text.
All mentions of the author, publication year, and origin of the primary text have been preserved in accordance with the source.