Review of Medical Physiology - William F. Ganong 2002
Blood Circulation
Hemodynamics and Lymph Circulation
Biophysical Aspects
Blood Flow, Pressure, and Resistance
Blood normally flows from areas of high pressure to areas of low pressure, except when blood flow is temporarily interrupted. The relationship among mean flow velocity, mean pressure, and resistance in Blood Vessels is analogous to the relationship among current, electromotive force, and resistance in an electrical circuit, as described by Ohm's law:
Class="center">
BLOOD FLOW IN any segment of The Vascular System is equal to the effective perfusion pressure in that segment divided by resistance. The effective perfusion pressure is the difference between the mean intraluminal pressure at the arterial end and the mean pressure at the venous end. The unit of resistance (pressure divided by flow) is dyn·s/cm5. To avoid such cumbersome units, resistance in The Cardiovascular system is expressed in R units, which are obtained by dividing pressure (mm Hg) by flow (mL/s) (see also Table 32-1). Thus, for example, if the mean aortic pressure is 90 mm Hg and the left ventricular output is 90 mL/s, the total peripheral resistance is

Methods for Measuring Blood Flow
Blood flow can be measured by cannulating a blood vessel, though this method has obvious limitations. Numerous devices have been developed to measure blood flow without damaging the vessel wall. Electromagnetic flowmeters are based on the principle that a voltage is generated in a conductor moving through a magnetic field, and the magnitude of this voltage is proportional to the speed of movement. Because blood is a conductor, a magnet is placed around the vessel, and the voltage proportional to the flow volume is measured by appropriately positioning an electrode on the vessel surface. Blood flow velocity is measured using Doppler flowmeters. In this setup, ultrasonic waves are beamed diagonally into the vessel from one crystal, and the waves reflected by erythrocytes and leukocytes are picked up by another crystal placed downstream. The frequency of the reflected waves is higher by an amount proportional to the flow velocity toward the second crystal, a phenomenon explained by the Doppler effect.
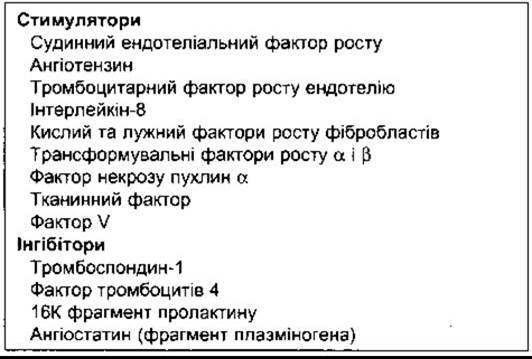
Table 30-3. Factors involved in angiogenesis
Indirect methods for measuring blood flow in various human Organs—adaptations of the Fick principle and indicator-dilution methods—are described in Chapter 29. One example is the Kety N2O inhalation method for measuring cerebral blood flow (see Chapter 32), and another is the determination of renal blood flow by measuring the clearance of para-aminohippuric acid (see Chapter 38). A wealth of data on blood flow in the extremities can be obtained using plethysmography (Fig. 30-7). In this method, for example, the forearm is placed in a Water-filled chamber (plethysmograph). Changes in forearm volume resulting from fluctuations in The amount of blood and interstitial fluid displace the liquid, which is then recorded by a volume-measuring device. When the venous outflow of the forearm is occluded, The rate of increase in forearm volume reflects the arterial inflow rate (venous occlusion plethysmography).

Fig. 30-7. Plethysmography.
Application of Physical Principles to Blood Flow in Vessels
Physical principles and equations used to describe The behavior of ideal, ordinary fluids in rigid tubes are often inadequate for explaining the behavior of blood in blood vessels. However, blood vessels are not rigid tubes, and blood is not an ideal fluid, but rather a two-phase system consisting of fluid and Cells. Consequently, the behavior of the cardiovascular system differs, sometimes significantly, from what would be predicted by physical principles alone. At the same time, these physical principles are entirely useful for understanding underlying physiological mechanisms in the body.
Laminar Flow
Blood flow in blood vessels, like fluid flow in narrow rigid tubes, is normally laminar (streamlined). Inside the vessels, an extremely thin layer of blood in direct contact with the vessel wall remains stationary. The next adjacent inner layer moves at a very low velocity, the next one faster, and so on, with velocity reaching its maximum values in the central region of the stream (Fig. 30-8). Laminar flow occurs at velocities below a certain critical velocity. At or above this critical velocity, the flow becomes turbulent. Streamlined flow is silent, whereas turbulent flow generates sounds.
The likelihood of turbulence is also related to vessel diameter and blood viscosity. This can be expressed by The ratio of inertial forces to viscous forces:

of a fluid flowing through a tube, illustrating the parabolic velocity profile (laminar flow).
where Re is the Reynolds number, named after the scientist who described this relationship; ρ is the fluid density; D is the diameter of the tube under study; V is the flow velocity; and η is the fluid viscosity. The higher the Re value, the greater the likelihood of turbulence. If D is measured in centimeters, V in centimeters per second, and η in poises, flow is typically non-turbulent when Re does not exceed 2000. Conversely, when Re exceeds 3000, turbulence is almost always present. Arterial constriction increases the velocity of Blood flow through the narrowed segment, causing turbulence and, consequently, acoustic manifestations downstream from the constriction site (Fig. 30-9). This is manifested as a murmur heard over an artery narrowed by an atherosclerotic plaque, as well as the Korotkoff sounds heard during blood pressure measurement (see below).
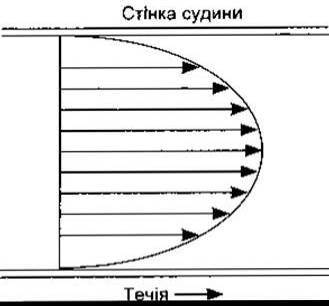
Fig. 30-8. Velocity profile across concentric surfaces of a viscous In humans, the critical velocity is sometimes exceeded in the ascending aorta at the peak of systolic ejection, though this typically occurs only in the presence of arterial narrowing. Turbulent flow occurs much more frequently in anemia As a result of decreased blood viscosity. This accounts for the systolic murmurs frequently heard in anemic patients.
Mechanical Stress and Gene Activation
Blood flow exerts a force on the endothelium that is parallel to the long axis of the vessel. This mechanical shear stress is proportional to the viscosity η multiplied by the shear rate dy/dr, which represents the rate at which longitudinal velocity increases from the vessel wall toward the center of the lumen:

Alterations in shear stress and other physical forces, such as cyclic stretch and relaxation, induce marked changes in endothelial Cell Gene Expression related to cardiovascular function. The likely receptors for these stimuli are cell-Cytoskeleton Integrins. Secondary messengers include IP3, DAG, and Components of the MAPK pathway (see Chapter 1), while the activated genes encode growth factors, integrins, and related molecules (Table 30-4). Approximately 15 endothelial cell genes are activated in response to various physical forces.

Fig. 30-9. Top: effect of constriction (C) on velocity vectors within a blood vessel. Arrows indicate the direction of velocity components, and their length is proportional to magnitude. Bottom: velocity Variability at each point along the vessel. In the region of turbulent blood flow, There is a wide distribution of anterograde (forward) (A) and retrograde (backward) (R) velocities (modified and reprinted with permission from Richards KE: Doppler echocardiography in Diagnosis and quantification of vascular disease. Mod Concepts Cardiovasc Dis 1987;56:43).
Mean Velocity
When analyzing fluid dynamics in a tube system, It is important to distinguish between velocity, which is displacement per unit time (e.g., cm/s), and flow, which is volume per unit time (e.g., cm3/s). Velocity V is proportional to flow Q divided by the cross-sectional area A of the conduit:

Thus, Q=AV, and for a constant flow rate, velocity increases in direct proportion to any decrease in A (see Fig. 30-9).
The mean velocity of fluid movement at any point in a system of parallel tubes is inversely proportional to the total cross-sectional area at that point. Consequently, mean blood velocity is highest in the aorta, continuously decreases in smaller vessels, and reaches its lowest value in capillaries, where the total cross-sectional area is 1,000 times smaller than that of the aorta (see Table 30-1). Mean velocity increases again as blood enters the Veins and is relatively high in the vena cava, though not as high as in the aorta. Clinically, blood flow velocity can be measured by injecting Bile acid salts into an upper-extremity vein and timing the appearance of a bitter taste caused by these compounds (Fig. 30-10). Normally, the mean arm-to-Tongue Circulation time is 15 s.
Table 30-4. Human, bovine, and rabbit endothelial cell genes affected by mechanical shear stress and the METABOLISM/31.html">Transcription factors involved12
Genes |
Transcription Factors |
Endothelin-1 |
AP-1 |
VCAM-1 |
AP-1, NF-KB |
ACE |
SSRE, AP-1, Egr-1 |
Tissue factor |
SP1 |
Tissue factor |
Egr-1 |
TM |
AP-1 |
PDGF-a |
SSRE, Egr-1 |
PDGF-ß |
SSRE |
ICAM-1 |
SSRE, AP-1, NF-KB |
TGF-ß |
SSRE, AP-1, NF-KB |
Egr-1 |
SREs |
c-fos |
SSRE |
c-jun |
SSRE, AP-1 |
NOS3 |
SSRE, AP-1, NF-KB |
MCP-1 |
SSRE, AP-1, NF-KB |
1 Modified from Braddock M et al: Fluid shear stress modulation of GENE EXPRESSION IN endothelial cells. News Physiol Sci 1998; 13:241.
2 Acronyms are listed in the Appendix.
Poiseuille-Hagen Formula
The relationship between flow in a long, narrow tube, fluid viscosity, and tube radius can be mathematically described by the Poiseuille-Hagen formula:

where F is flow; PA - PB is the pressure gradient across the two ends of the tube; η is viscosity; r is the radius of the tube; L is the length of the tube.
Flow is equal to the pressure gradient divided by resistance R,

Since flow is directly proportional and resistance is inversely proportional to the fourth power of the radius, both in vivo blood flow and resistance change dramatically with even minute alterations in vessel caliber. Thus, for example, blood flow through a vessel doubles with only a 19% increase in radius; conversely, if the radius doubles, resistance drops to 6% of its previous value. This is why organ blood flow is so effectively regulated by minor adjustments in arteriolar caliber, and why variations in arteriolar diameter are of such paramount importance for systemic arterial pressure.
Viscosity and Resistance
Resistance to blood flow is determined not only by blood vessel radius (vascular geometry) but also by blood viscosity. Plasma viscosity is 1.8 times that of water, whereas whole blood viscosity is 3 to 4 times that of water. Consequently, viscosity primarily depends on hematocrit—the percentage of blood volume occupied by cellular elements. The in vivo effect of viscosity differs from values predicted by the Poiseuille-Hagen equation. In large vessels, an increase in hematocrit causes a marked rise in viscosity. However, in vessels with a diameter under 100 µm, such as arterioles, capillaries, and venules, The change in viscosity per unit change in hematocrit is significantly smaller than in large vessels. This is due to the unique nature of blood flow in microvessels. Therefore, viscosity changes per unit change in hematocrit are much smaller in the vascular network in vivo than in vitro (Fig. 30-11). For this reason, hematocrit variations are relatively unimportant for peripheral resistance except when extreme. In marked polycythemia, the increased resistance elevates cardiac workload. Conversely, in anemia, peripheral resistance is reduced, partly owing to decreased viscosity. Naturally, lowered Hemoglobin levels impair the oxygen-carrying capacity of blood, though the enhanced blood flow resulting from reduced viscosity partially compensates for this effect.
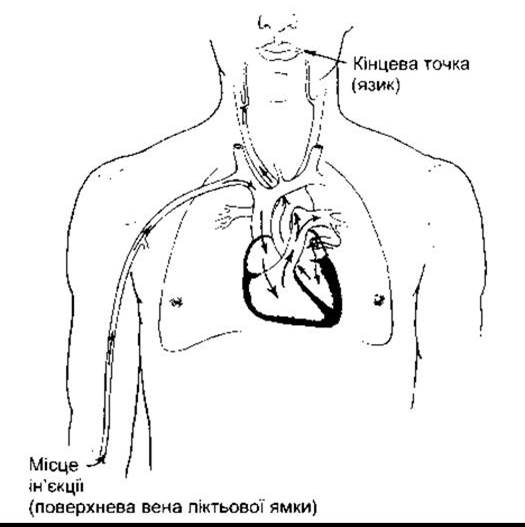
Fig. 30-10. Pathway of the injected indicator in the arm-to-tongue circulation time measurement.
Viscosity also depends on plasma composition and the deformability of Blood Cells. Clinically significant increases in viscosity are observed in disorders characterized by markedly elevated Plasma Proteins, such as IMMUNOGLOBULINS, as well as in hereditary spherocytosis involving abnormal erythrocyte rigidity.
Within blood vessels, erythrocytes tend to concentrate in the center of the moving stream. Consequently, blood along the longitudinal axis of the vessel has a low hematocrit, and side branches originating at right angles from a large vessel may receive a disproportionately cell-poor fraction of blood. This phenomenon, known as plasma skimming, accounts for the fact that capillary hematocrit is consistently about 25% lower than the whole-body hematocrit.

Fig. 30-11. Effect of hematocrit changes on the relative viscosity of blood, measured with a Glass viscometer in the hind leg of a dog. For each data point, the central line represents the mean, while the upper and lower limits indicate standard deviations (reproduced with permission from Whittaker SRF, Winton FR: The apparent viscosity of blood flowing in the isolated hind limb of the dog, and its variation with corpuscular concentration. J Physiol [Lond] 1933;78:338).
Critical Closing Pressure
In rigid tubes, the relationship between pressure and flow for a homogeneous fluid is linear; however, in thin-walled blood vessels in vivo, it is quite different. When the pressure in small blood vessels decreases, a point may be reached where blood flow ceases entirely, even though the pressure is not zero (Fig. 30-12). This occurs partly because pressure is required to force red blood cells through capillaries whose diameter is smaller than that of the cells themselves. Furthermore, blood vessels are surrounded by Tissues that exert a slight but definite pressure upon them; when the intravascular pressure falls below this tissue pressure, the vessels collapse. In inactive tissues, for example, pressure in many capillaries is low due to the constriction of precapillary sphincters and metarterioles, and many of these capillaries are in a state of collapse. The pressure at which blood flow stops is referred to as the critical closing pressure.
Law of Laplace
The relationship between distending pressure and tension is illustrated in the diagram in Fig. 30-13. It is remarkable that structures as thin-walled and delicate as capillaries are relatively resistant to rupture. The most important reason for their relative invulnerability is their small diameter. The protective effect of small size in this case is a manifestation of the law of Laplace, an important physical principle with several other Applications in physiology. This law states that the wall tension T of a cylinder equals the product of the transmural pressure P and the radius r, divided by the wall thickness w:


Fig. 30-12. Pressure-flow relationship in a system with rigid walls (top) and in the vascular system (bottom).

Fig. 30-13. Relationship between distending pressure T and wall tension H in a hollow organ.
In thin-walled structures, w is extremely small and can be neglected, whereas it is a significant factor in vessels such as Arteries. Transmural pressure is the difference between the pressure inside the cylinder and the pressure outside; since tissue pressure in The Human Body is low, P essentially equals the internal pressure of the organ. In a thin-walled organ ($P = T$), divided by the two principal radii of curvature of the organ,
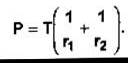
For a sphere, r1 = r2, therefore

In a cylinder, such as a blood vessel, one radius is infinite, therefore

Thus, the smaller the radius of a blood vessel, the less wall tension is required to withstand a given distending pressure. In the human aorta, for example, wall tension at normal pressure is about 170,000 dyn/cm, and in the vena cava about 21,000 dyn/cm; however, in capillaries it is approximately 16 dyn/cm.
The law of Laplace helps to explain the disadvantages of a dilated Heart. When the radius of a cardiac chamber increases, greater tension must be developed in the myocardium to achieve the same internal pressure. Consequently, a dilated heart must perform more work than a nondilated one. In the Lungs, the radii of curvature of the alveoli decrease during expiration, which tends to promote the collapse of these structures due to surface tension forces. This tendency is counteracted by a surfactant, a surface tension-lowering factor (see Chapter 34). Another example of this law in action is found in the Urinary Bladder (see Chapter 38).
Capacitance and Resistance Vessels
When a segment of the vena cava or another large distensible vessel is filled with blood, pressure does not rise sharply until relatively large volumes of fluid have accumulated (see Fig. 30-12). Veins in vivo serve as an important blood reservoir. Normally, they are partially collapsed and oval in cross-section. A large volume of blood can be accommodated within the Venous system before the veins are distended to a circular shape, beyond which any further increase in volume leads to a marked rise in venous pressure. For this reason, veins are referred to as capacitance vessels.
Small arteries and arterioles are classified as resistance vessels because they are the primary site of peripheral resistance (see below).
At rest, at least 50% of the circulating blood volume resides in the systemic veins, 20% is located in The Heart chambers, and 18% in the low-pressure pulmonary vessels. Only 2% is contained in the aorta, 8% in the arteries, 1% in the arterioles, and 5% in the capillaries (see Table 30-1). If an excess of blood is introduced via transfusion, less than 1% of it is distributed to the Arterial System (the "high-pressure system"), while the remainder is accommodated in the systemic veins, pulmonary vessels, and heart chambers (except the left ventricle) (the "low-pressure system").
Last update: 10/08/2026
Editorial and Educational Adaptation: This material has been compiled based on the primary/original source text. The project team performed an editorial review, corrected technical inaccuracies, structured sections, and adapted the content for an educational format.
What was processed:
- elimination of formatting defects (OCR errors, structural breaks, corrupted characters);
- editorial organization of content;
- standardization of terminology in accordance with academic sources;
- verification of factual statements against the original source text.
All mentions of the author, publication year, and origin of the primary text have been preserved in accordance with the source.