Molecular Biology: A Practical Guide - Velikov V.A. 2013
Appendix
Appendix 1. Characteristics of Plasmids and Bacteriophages listed in the manual
|
Name |
Marker |
Size |
Copy number per E. coli Cell |
Characteristics |
|
pBR322 |
Apr Tcr |
4,4 kb |
≈ 20 |
Recombinant plasmid. One of the first molecular cloning vectors |
|
pBluescript II |
Apr |
2,96 kb |
up to 300 |
Cloning and sequencing vector. Phagemid. Contains the M13 phage ori and the lacZ Gene |
|
M13 |
6,4 kb |
≈ 100 |
Wild-type filamentous single-stranded DNA phage. Temperate. Infects only F+ E. coli Cells |
|
|
M13 K07 |
Kmr |
6,5 kb |
≈ 100 |
Recombinant helper phage. Carries the kanamycin resistance gene. Defective in virion packaging |
|
M13 mp18 |
- |
7,25 kb |
≈ 100 |
Phage vector for cloning and sequencing. Contains an MCS. |
|
λ (Lambda) |
48,5 kb |
≈ 100 |
Lytic double-stranded DNA phage packaged in an icosahedral protein capsid. Wild type. Capable of entering a lysogenic state |
|
|
pSUP106 |
Cmr Tcr |
9,6 kb |
up to 40 |
Broad-host-range vector. Plasmid. Maintained in many Gram-negative Bacteria |
|
pSUP106::sacB |
Cmr Kmr |
14,4 kb |
up to 40 |
Contains a 3.8 kb cassette (construct) integrated at the BamH1 site with the levansucrase sacB gene from the bacterium Bacillus subtilis |
|
pHEN1 |
Apr |
4,5 kb |
≈ 100 |
Antibody phage display vector. Phagemid. Able to package into virions in the presence of M13 K07 helper phage in cells |
|
pHEN1:: scFv |
Apr |
5,4 kb |
≈ 100 |
Contains the cloned scFv gene encoding single-chain recombinant miniantibodies of defined Specificity |
|
pET30 |
Kmr |
5,4 kb |
≈ 100 |
Protein expression plasmid vector. Features a T7 phage RNA polymerase promoter |
Note. Apr - ampicillin resistance, Kmr - kanamycin resistance, Cmr - chloramphenicol resistance, Tcr - tetracycline resistance
Appendix 2. Characteristics of bacterial strains listed in the manual
|
Strain |
Genotype |
Characteristics |
|
Escherichia coli XL1-Blue |
recA1 endA1 gyrA96 thi-1 hsdR17 hsdR17 supE44 relA1 lac [F' proAB lacEZ∆M 15 Tn10(TetR)] |
Widely used host strain for various vectors |
|
E.coli TG1 |
supE thi-1 A(lac-roAB) ∆(mcrB-hsdSM)5(rK- mK-) [F' traD36 proAB lacIqZA M15] |
Host strain for filamentous phages, convenient for The production of phage (and phagemid) particles |
|
E.coli JS5 |
ara D139 A(ara leu) 7967 ∆ (lac) x74 galU galK hsdR12 (rk- mk-) mcrA mcr BC rpsL (StrR) thi rec A1 [F::Tn10 (TetR)proAB lac Iq LacZ ∆М15] |
Host strain for filamentous phages and phagemids, convenient for producing 'soluble' single-chain recombinant scFv miniantibodies |
|
E.coli BL21(DE3) |
F- dcm ompT hsdS(rB- mB-) gal λ(DE3) |
Host strain for RECOMBINANT PROTEIN EXPRESSION using T7 RNA polymerase (requires a T7 promoter on the vector) |
|
E.coli BL21(DE3) |
F- ompThsdS(rB- mB-) |
Carries the pLysS plasmid with |
|
pLysS |
gal dcm λ(DE3) [pLysS CmR] |
the gene encoding a T7 RNA polymerase inhibitor, which ensures the absence of 'basal' expression in the absence of induction |
|
Erwinia carotovora B15 |
Wild-type strain, prototroph, soil isolate |
Phytopathogenic microorganism (potato soft rot) |
|
Azospirillum brasilense Sp245 |
Wild-type strain, prototroph, soil isolate |
Model strain for studying associative Nitrogen Fixation |
|
Agrobacterium tumefaciens C58 |
Wild-type strain, prototroph, soil isolate |
Model strain for studying plant transgenesis mechanisms |
Appendix 3. Recognition sites of selected restriction Enzymes
|
Enzyme |
Recognition site and Cleavage site (indicated by an arrow) |
Number of sites in DNA |
||
|
pBR322 |
M13 mp18 |
Lambda |
||
|
BamHI |
G↓GATCC |
1 |
1 |
5 |
|
BgIII |
A↓GATCT |
- |
1 |
6 |
|
SauIIIA |
↓GATC |
22 |
7 |
16 |
|
EcoRI |
G↓AATTC |
1 |
1 |
5 |
|
EcoRII |
↓CC(A/T)GG |
6 |
7 |
71 |
|
EcoRV |
GAT↓ATC |
1 |
- |
21 |
|
HindIII |
A↓AGCTT |
1 |
1 |
7 |
|
KpnI |
G↓GTACC |
- |
1 |
2 |
|
NotI |
GC↓GGCCGC |
- |
- |
- |
|
PstI |
CTGCA↓G |
1 |
1 |
28 |
|
SmaI |
CCC↓GGG |
- |
1 |
3 |
|
XhoI |
C↓TCGAG |
- |
- |
1 |
Appendix 4. Restriction map of plasmid pBR322
Class="center">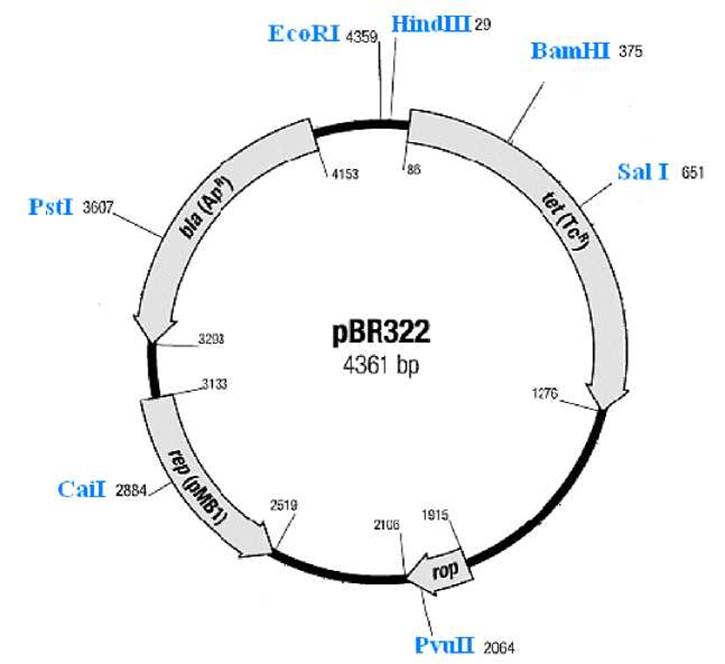
Legend:
|
rep (pMB1) |
- origin of Replication of plasmid pMB1 (ori, replication origin, replicon), |
|
bla (Apr) |
- ampicillin resistance gene (ß-lactamase), |
|
tet (Tcr) |
- tetracycline resistance gene, |
|
rop |
- copy-number control region. |
Numbers next to the restriction enzyme recognition sites correspond to THE POSITION OF the first nucleotide in the site. Counting starts from the first nucleotide T in the EcoRI recognition site. Only unique sites are shown, and only for a small fraction of the many restriction enzymes capable of digesting pBR322 plasmid DNA (≈ 50).
The ampicillin resistance gene (a semisynthetic penicillin antibiotic whose lactam ring is cleaved by ß-lactamase) is inactivated upon DNA Cloning at the PstI restriction site. The tetracycline resistance gene, which encodes a protective protein, is inactivated at the BamH1 restriction site. Insertional inactivation of these genes upon 'foreign DNA' insertion allows for the identification of recombinant plasmids, as cells transformed with such a plasmid lose resistance to one antibiotic while retaining resistance to the other.
Appendix 5. Restriction map of phagemid pBluescript® II (Stratagene)

Legend:
|
rep (pMB1) |
- origin of replication of plasmid pMB1 (ColE1-type replicon), |
|
bla (Ap) |
- ampicillin resistance gene (ß-lactamase), |
|
f1 (IG) |
- M13 phage origin of replication, |
|
LacZ |
- ß-galactosidase gene, N-terminal portion, |
|
PT3 |
- T3 phage promoter, |
|
PT7 |
- T7 phage promoter, |
|
MCS |
- multiple cloning site (polylinker). |
Order of restriction sites in the MCS polylinker starting from the PT7 promoter (polylinker orientation): pBluescript II SK(+)
KpnI, XhoI, SalI, HindIII, EcoRI, PstI, SmaI, BamHI, XbaI, NotI, SacI; pBluescript II KS(+)
SacI, NotI, XbaI, BamHI, SmaI, PstI, EcoRI, HindIII, SalI, XhoI, KpnI.
Universal sequencing primers:
M13/pUC sequencing primer (- 20)
5’-GTAAAACGACGGCCAGT-3’ (upstream of the PT7 promoter);
M13/pUC reverse sequencing primer (- 26)
5’-CAGGAAACAGCTATGAC-3’ (upstream of the PT3 promoter).
Note: Both the +-strand and, in principle, the --strand of the pBluescript® II phagemid DNA can be "packaged" into a protein capsid to yield a virion (phage particle) upon infecting an E. coli cell containing this phagemid with a specific helper phage. Single-stranded DNA from virions is convenient for sequencing. Alternatively, double-stranded phagemid DNA with a "foreign DNA" insert (or transgene) can be sequenced along both strands for higher accuracy. For this purpose, either the forward or reverse universal primer is used individually.
Appendix 6. Layout and Operation of the E. coli Lactose Operon
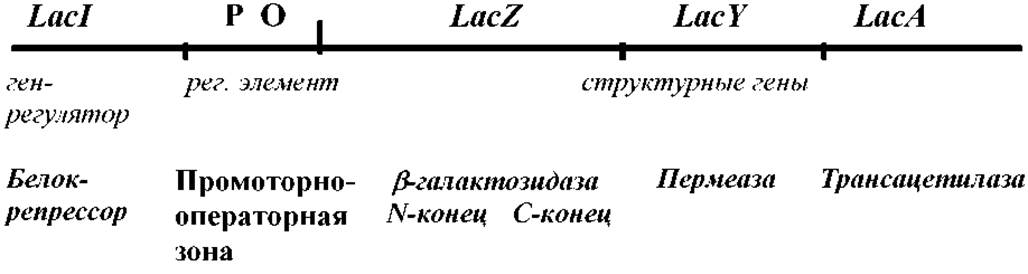
Induction of the ß-galactosidase gene. The enzyme ß-galactosidase cleaves the disaccharide lactose into galactose and glucose. The inducer of the lac operon is lactose; it binds to the repressor and promotes its dissociation from the promoter-operator region, thereby allowing METABOLISM/31.html">Transcription to proceed. The non-hydrolyzable lactose analogue IPTG (isopropyl-ß-D-thiogalactoside) can also act as an inducer.
Blue-white screening in cloning: ß-galactosidase is capable of cleaving the substrate X-gal (5-bromo-4-chloro-3-indolyl-ß-D-galactoside) into galactose and a blue-colored indole derivative. Bacterial colonies grown on nutrient Agar supplemented with X-gal and IPTG (40 µg/ml each) appear blue. When cloning is performed under the control of the lacZ gene promoter, gene inactivation occurs, leading to The formation of conventional ("white") colonies. Upon transforming E. coli with ligation reaction products, cells that successfully take up a plasmid with a foreign DNA insert will yield standard white colonies rather than blue ones.
The phenomenon of $\alpha$-complementation. Active enzyme synthesis in bacterial cells occurs if its N-terminal portion is encoded by a plasmid (such as pBluescript II or others), while its C-terminal portion is encoded by the E. coli F-factor integrated into the chromosome. In this case, the host strain must carry the lacIq LacZ $\Delta$M15 mutation (constitutive Synthesis of the Iq repressor and an N-terminal deletion of the ß-galactosidase gene). This design makes it possible to carry only a portion of the lacZ gene on the vector rather than the entire gene.
Appendix 7. Conversions between Quantity, Size, and Optical Density for Nucleic Acids
|
1 OD260 |
Double-stranded DNA |
50 µg |
|
1 OD260 |
Single-stranded DNA |
37 µg |
|
1 OD260 |
Single-stranded RNA |
40 µg |
|
1 µg |
Double-stranded DNA |
3.08 nmol phosphate |
|
1 µg |
Double-stranded DNA (1 kb in size) |
3.08 pmol 5'-ends |
|
1 µg |
Double-stranded DNA (1 kb in size) |
9.3x10¹¹ molecules |
|
1 pmol |
pBR322 plasmid DNA |
2.83 µg |
|
1 pmol |
Double-stranded DNA (1 kb in size) |
650 ng |
|
1 kb |
Double-stranded DNA |
650 kDa |
|
1 kb |
Single-stranded DNA |
330 kDa |
|
1 kb |
Single-stranded RNA |
340 kDa |
Appendix 8. Standard IUPAC Codes for Polymorphic Nucleotide Positions
|
Symbol |
Polymorphic position |
Explanation |
|
R |
A or G |
puRine |
|
Y |
C or T |
pYrimidine |
|
M |
A or C |
aMino |
|
K |
G or T |
Keto |
|
S |
C or G |
Strong interaction (3 H-bonds) |
|
W |
A or T |
Weak interaction (2 H-bonds) |
|
H |
(A, C, T) but not G |
H follows G in the alphabet |
|
B |
(C, G, T) but not A |
B follows A in the alphabet |
|
V |
(A, C, G) but not T (U) |
V follows T(U) in the alphabet |
|
D |
(A, G, T) but not C |
D follows C in the alphabet |
|
N |
(A, G, C, T) |
aNy nucleotide |
Appendix 9. Single-Letter Amino Acid Abbreviations
|
A |
Leucine |
L |
|
|
R |
K |
||
|
Asparagine |
N |
M |
|
|
Aspartic acid |
D |
P |
|
|
Valine |
V |
S |
|
|
Glutamine |
Q |
T |
|
|
Glutamic acid |
E |
W |
|
|
G |
Y |
||
|
H |
Phenylalanine |
F |
|
|
Isoleucine |
I |
C |
Appendix 10. The Genetic Code
|
1st nucleotide |
2nd nucleotide |
3rd nucleotide |
|||
|
U |
C |
A |
G |
||
|
F (Phe) |
S (Ser) |
Y (Tyr) |
C (Cys) |
U |
|
|
U |
F (Phe) |
S (Ser) |
Y (Tyr) |
C (Cys) |
C |
|
L (Leu) |
S (Ser) |
STOP |
STOP |
A |
|
|
L (Leu) |
S (Ser) |
STOP |
W (Trp) |
G |
|
|
L (Leu) |
P (Pro) |
H (His) |
R (Arg) |
U |
|
|
C |
L (Leu) |
P (Pro) |
H (His) |
R (Arg) |
C |
|
L (Leu) |
P (Pro) |
Q (Gln) |
R (Arg) |
A |
|
|
L (Leu) |
P (Pro) |
Q (Gln) |
R (Arg) |
G |
|
|
I (Ile) |
T (Thr) |
N (Asn) |
S (Ser) |
U |
|
|
A |
I (Ile) |
T (Thr) |
N (Asn) |
S (Ser) |
C |
|
I (Ile) |
T (Thr) |
K (Lys) |
R (Arg) |
A |
|
|
M (Met) |
T (Thr) |
K (Lys) |
R ( Arg) |
G |
|
|
V (Val) |
A (Ala) |
D (Asp) |
G (Gly) |
U |
|
|
G |
V (Val) |
A (Ala) |
D (Asp) |
G (Gly) |
C |
|
V (Val) |
A (Ala) |
E (Glu) |
G (Gly) |
A |
|
|
V ( Val) |
A (Ala) |
E (Glu) |
G (Gly) |
G |
|
Appendix 11. Electrophoretogram of PCR Amplification products for the NADH dehydrogenase gene of Nikolsky's viper and the 12S ribosomal rRNA gene
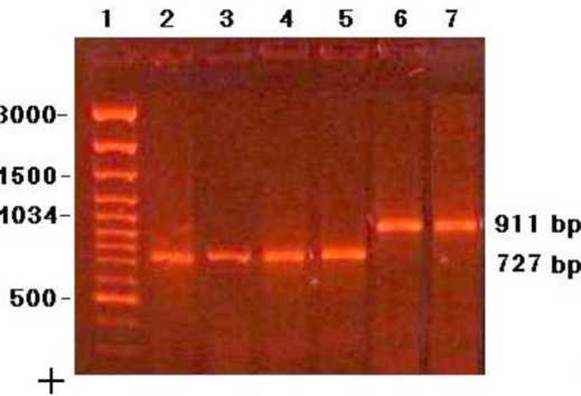
Lane descriptions:
1. - 100bp DNA Ladder Plus molecular weight marker (Fermentas). DNA fragment sizes from top to bottom: 3000, 2000, 1500, 1200, 1034, 900, 800, 700, 600, 500 bp;
2-5. - 727 bp PCR product of the 12S rRNA gene;
6-7. - 911 bp PCR product of the NADH dehydrogenase gene.
Appendix 12. Migration of various plasmid DNA Conformations in agarose gel Electrophoresis
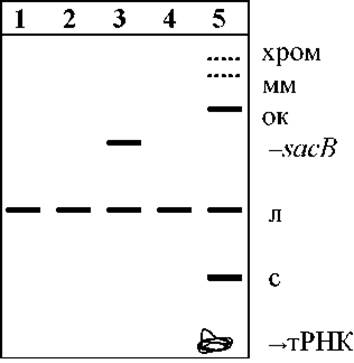
Lane descriptions:
1. - pBluescript II plasmid DNA digested with Eco31I;
2. - digested with BamHI;
3. - with the nptI-sacB-sacR cassette, BamHI-restricted;
4. - PstI-restricted;
5. - native pBluescript II plasmid DNA preparation.
Plasmid forms:
l - linear (with a break in both DNA strands); cc - supercoiled circular; oc - open circular (with a break in One DNA strand); mc - dimeric and multimeric; chrom - genomic DNA remnants; sacB - nptI-sacB-sacR cassette.
Appendix 13. Electropherogram of lambda phage DNA and E. coli genomic DNA Restriction products
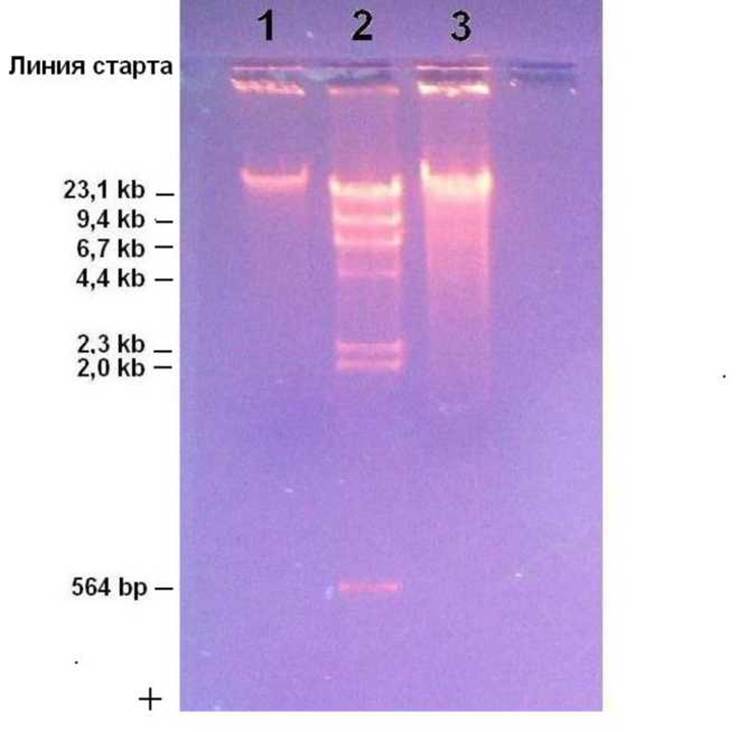
Lane designations:
1. - native phage X DNA, 48502 bp in size;
2. - phage X DNA digested with the HindIII restriction enzyme;
3. - total E. coli DNA digested with the HindIII restriction enzyme (partial Digestion)
Note. Gel electrophoresis is used to compare the electrophoretic mobility of DNA fragments or Native DNA molecules that share the same conformation: linear forms are compared with linear, supercoiled with supercoiled, single-stranded with single-stranded, etc. Here, the native lambda phage DNA is also linear, although its replicative form in E. coli cells is circularized via cos sites.
The largest DNA fragments of 23.1kb and 48.5kb are not effectively separated because a 1.5% agarose gel was used (see Topic 3). Low-molecular-weight fragments stain less intensely because they bind less ethidium bromide (EtBr), which migrates away from the DNA toward the cathode during electrophoresis. Here, the 564 bp fragment has been manually redrawn as it was barely visible, although the molar concentrations of all restriction fragments are identical. As the total DNA concentration increases, the upper fragments will gradually merge into a single bright band.
Appendix 14. DNA cloning scheme
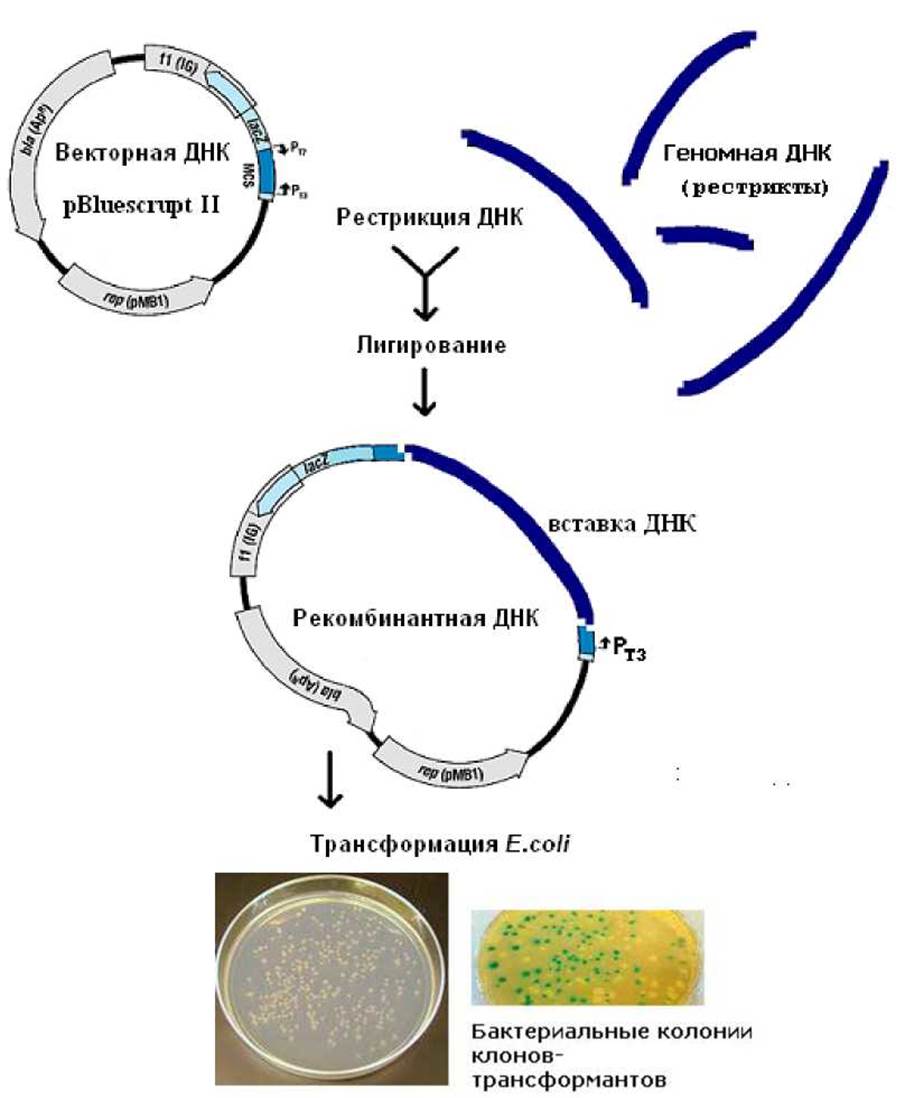
Note. In the presented scheme, besides size-based plasmid screening, "blue-white screening" of recombinant DNA is also possible. Cloning under the control of the T3 phage promoter (PT3) disrupts the integrity of the LacZ gene, preventing the synthesis of the ß-galactosidase enzyme in the cells. After plating bacterial culture cells transformed with ligation products onto nutrient agar containing ampicillin, the chromogenic substrate X-gal, and the inducer IPTG, Two Types of bacterial colonies emerge. Blue colonies contain the "empty" vector, whereas regular "white" colonies harbor the recombinant DNA. Each colony contains ~ 104-105 cells.
Hybrid DNA molecules are referred to as recombinant molecules because joining the cloned DNA and the vector DNA is essentially an in vitro recombination event.
Appendix 15. General scheme of PCR

Note. Only the first PCR cycle is shown. The first single-stranded DNA molecule of a strictly defined size — spanning from the 5'-terminal nucleotide of one primer to the nucleotide complementary to the 5'-terminal nucleotide of the other primer — appears only after the second cycle. The first double-stranded DNA molecule of this size appears after the third cycle. Thereafter, the PCR product, or amplicon, with a specific number of Base Pairs begins to accumulate in subsequent cycles. The amplicon has a fixed size because the template is now limited, further scanning by DNA polymerase is no longer possible, and the template-directed synthesis of the biopolymer terminates.
As a result of this enzymatic reaction, a specific DNA sequence, or amplificate, is synthesized de novo from single target DNA molecules in microgram quantities and millions of copies. In other words, selective in vitro DNA amplification takes place (from English "amplify" — to increase, expand). In vivo, a million copies of DNA would require a million cell divisions.
The theoretical detection limit of DNA using PCR (a single molecule) and the practical minimum practically coincide or are very close to each other. For comparison, enzyme-linked immunosorbent assay (ELISA) for the presence of a pathogenic microbe requires biological material from at least a hundred cells.
Appendix 16. Comparison of NADH dehydrogenase Amino acid sequences from Nikolsky's viper and the common viper
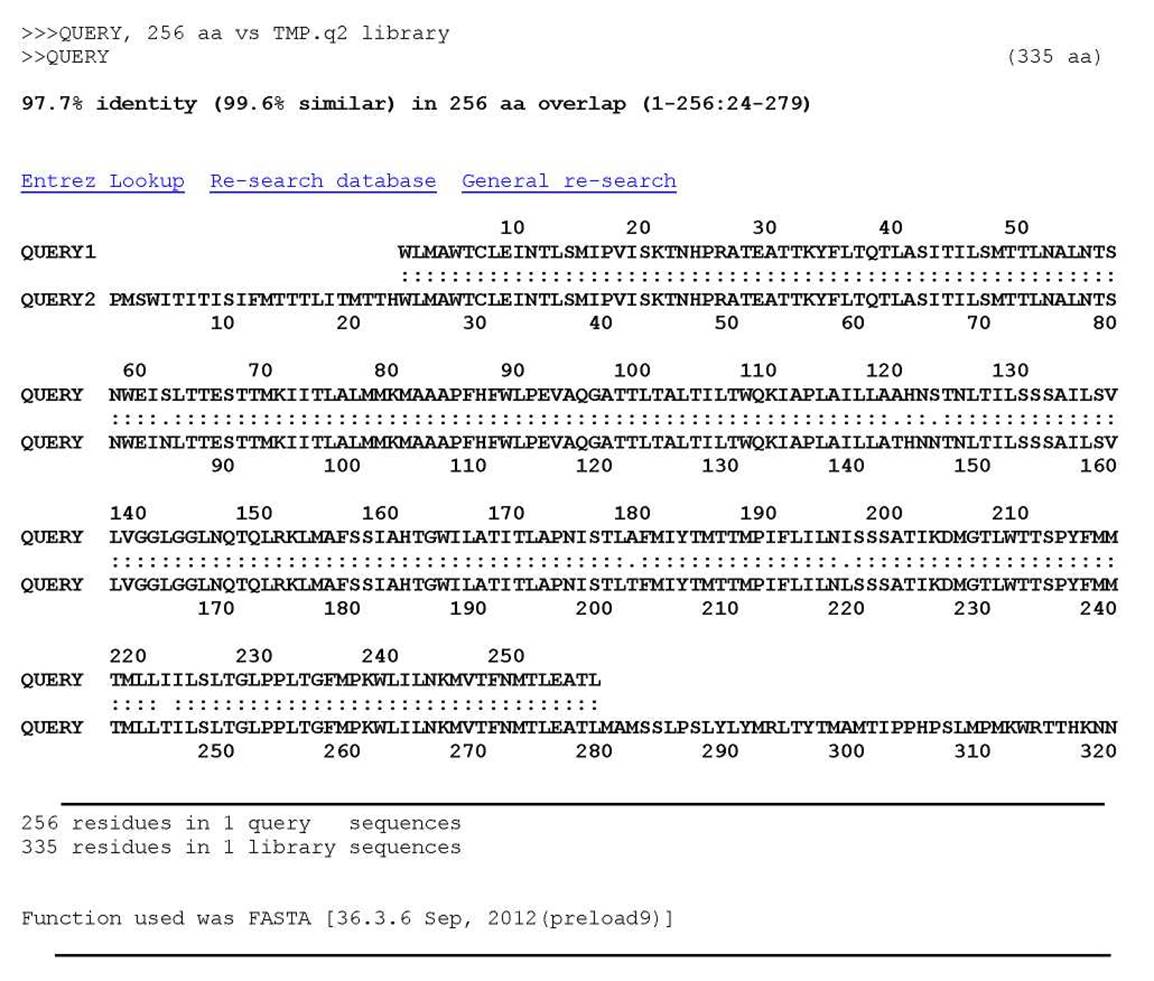
Note. Results of pairwise alignment of the NADH dehydrogenase amino acid sequences from the two viper species are shown. Top row: Vipera nikolskii; bottom row: Vipera berus. FASTA3x software.
There are 6 differences among the 256 compared amino acid residues (76% of the protein's complete Amino Acid Sequence). For instance, position no. 62/85 features serine (S) in Nikolsky's viper, whereas the common viper has asparagine (N, Ser:Asn variation). Other differences include Ala:Thr (pos. 120), Ser:Asn (pos. 123), Tyr:Thr (pos. 179), Ile:Leu (pos. 196), and Ile:Thr (pos. 222).
The comparison results refute the opinion of certain scientists that Nikolsky's viper is merely a melanistic morph of the common viper. This claim contradicts molecular analysis data of key cellular Biopolymers: the accumulated differences in the mitochondrial protein of these vipers are the result of their independent evolution.
Appendix 17. Selected relationships between size, quantity, optical density, and molar concentration for Proteins
Conversion: Mass/Moles
|
Protein Molecular Weight Mw (kDa) |
1 µg of given protein - |
1 nM of given protein - |
|
10 |
100 pM, 6 x10 13 molecules |
10 µg |
|
50 |
20 pM, 1.2x10 13 molecules |
50 µg |
|
100 |
10 pM, 6 x10 12 molecules |
100 µg |
|
150 |
6.7 pM, 4 x10 12 molecules |
150 µg |
Conversion: DNA/Protein
|
DNA Size |
Protein Molecular Weight Mw (kDa) |
Number of amino acid residues |
|
270 bp |
10 kDa |
90 |
|
0.9 kb |
33.3 kDa |
300 |
|
1 kb |
37 kDa |
333 |
|
1.35 kb |
50 kDa |
450 |
A280 of selected proteins at a concentration of 1 mg/ml
|
Protein |
Concentration |
A280 |
|
IgG |
1 mg/ml |
1.35 |
|
IgM |
1 mg/ml |
1.20 |
|
IgA |
1 mg/ml |
1.30 |
|
Protein A |
1 mg/ml |
0.17 |
|
1 mg/ml |
1.50 |
|
|
Streptavidin |
1 mg/ml |
3.40 |
|
BSA |
1 mg/ml |
0.70 |
Last update: 13/08/2026
Editorial and Educational Adaptation: This material has been compiled based on the primary/original source text. The project team performed an editorial review, corrected technical inaccuracies, structured sections, and adapted the content for an educational format.
What was processed:
- elimination of formatting defects (OCR errors, structural breaks, corrupted characters);
- editorial organization of content;
- standardization of terminology in accordance with academic sources;
- verification of factual statements against the original source text.
All mentions of the author, publication year, and origin of the primary text have been preserved in accordance with the source.