LEHNINGER PRINCIPLES OF BIOCHEMISTRY - VOL 1. THE FOUNDATIONS OF BIOCHEMISTRY: STRUCTURE AND CATALYSIS - 2011
PART I. STRUCTURE AND CATALYSIS
9. DNA-BASED INFORMATION TECHNOLOGY
9.3. From Genomes to Proteomes
A Gene is more than just a DNA sequence; it is information that is converted into a useful product—a protein or a functional RNA molecule—when and if The Cell requires it. The first and most obvious step in exploring genome sequences is cataloging the gene products of that genome. Genes that encode RNA as their final product are somewhat more difficult to identify than protein-coding genes, and even the latter can be very challenging to pinpoint in vertebrate genomes. Studying the information hidden within DNA sequences has led to an unexpected Conclusion. Despite decades of biochemical triumphs, every Introduction/5.html">Eukaryotic Cell (and quite a few bacterial ones) still harbors thousands of Proteins about which we know virtually nothing. These proteins may participate in as-yet-undiscovered processes or contribute in unknown ways to pathways we thought we fully understood. Furthermore, genomic sequences tell us nothing about the three-dimensional Structure of proteins or how they are modified post-translationally. With their countless and indispensable cellular Functions, proteins have become the focal point of new strategies in cellular biochemistry.
The entire Complement of proteins expressed by a genome is called its proteome; a term first introduced into the scientific literature in 1995. This quickly gave rise to the rapidly developing field of Proteomics. The goal of proteomics is clear-cut, even if its complete realization is not. Every genome contains thousands of protein-coding genes, and ideally, we want to know the Structure and properties of every single one of these proteins. Considering that many proteins continue to spring surprises even after years of study, investigating an entire proteome is a daunting enterprise. Simply determining the functions of newly discovered proteins requires intensive labor. However, biochemists can now employ rational approaches, armed with a host of new and improved technologies.
Protein Functions can be described at three levels. Phenotypic function characterizes the effects of proteins on the Organism as a whole. For example, a Protein deficiency may lead to retarded growth, altered development, or even death. Cellular function characterizes the network of interactions involving proteins at THE CELLULAR LEVEL. Interactions with other proteins within the cell help define the metabolic processes in which a protein takes part. Finally, molecular function refers to the specific biochemical activity of a protein down to its minutest details, such as Enzymatic Catalysis or Ligand-receptor interactions.
For certain genomes, such as those of the Yeast Saccharomyces cerevisiae and the plant Arabidopsis spp., a common approach is to inactivate each gene using Genetic Engineering Methods and examine the resulting phenotypic effects on the organism. If the growth pattern or Other properties of the organism change (or if growth ceases altogether), this provides insight into the phenotypic function of the gene's protein product.
There are also three other primary ways to study protein function: (1) sequence and structural comparisons with genes and proteins of known function, (2) determining when and where a gene is expressed, and (3) investigating Protein-Protein Interactions. Let us examine each of these approaches in turn.
Many of the approaches developed to study individual Proteins can be applied to analyze large numbers of proteins simultaneously. The emerging field of systems biology examines a multitude of biochemical processes within the cell, including shifts in the cellular protein repertoire in response to environmental changes or genetic stress. Throughout this book, as we describe various biochemical and Genetic Methods, we highlight their applicability to solving problems in systems biology.
Correlations between Protein Structure and sequence provide clues to function
The rapid accumulation of genome sequence information has vastly expanded our understanding of Evolutionary Processes (see Section 3.4, p. 156). Another major motivation for sequencing numerous genomes is the creation of Databases that can be used to infer gene functions through genome comparison—an approach known as comparative Genomics. Sometimes a newly discovered gene shows Sequence Homology to a previously studied gene from the same or a different species, allowing its function to be inferred, fully or partially, on that basis. Genes found in different species that share clear sequence and functional similarity are called orthologs. Genes related in a similar manner within a single species are called paralogs (p. 61). Once the function of a gene has been established in one species, this information can be used to determine the function of its ortholog in another species. Such similarities are easiest to detect by comparing the genomes of relatively closely related species, such as mice and humans, although many clearly orthologous genes have been found between species as distantly related as Bacteria and humans. In some cases, even the chromosomal arrangement of genes is conserved across large genomic segments in closely related species (Fig. 9-20). This conserved gene order, termed synteny, provides further evidence of an orthologous relationship between genes in corresponding regions of related segments.
Class="center">Fig. 9-20. Synteny in mouse and human genomes. Large segments of the mouse and human genomes contain closely related genes arranged in the same chromosomal order, a relationship known as synteny. Illustrated are segments of human chromosome 9 and mouse chromosome 2. The genes in these segments exhibit a high degree of homology and identical gene order. Variations in gene name labeling reflect differences in the nomenclature conventions used for the two organisms.

Alternatively, sequences associated with specific protein Structural motifs (Chapter 4) can be identified within the protein itself. The presence of a particular structural motif might indicate that a protein catalyzes ATP Hydrolysis, binds to DNA, or forms a zinc-ion complex, thereby helping to define its molecular function. Such connections are identified using continually improving computer programs, limited only by our current knowledge of gene and protein structures and our ability to link sequences to specific structural motifs.
To establish functions based on structural relationships, a large-scale structural proteomics initiative has been launched. Its goal is to crystallize and determine the structures of as many proteins and Protein domains as possible, often with little or no prior information regarding their function. This project has been greatly facilitated by the automation of several tedious steps in protein crystallization (see Box 4–5). Once a structure is solved, it is deposited in structural databases such as those discussed in Chapter 4. This approach helps determine the extent of structural variation. If a newly discovered protein is found to possess structural features that unmistakably resemble structural motifs of known function from the database, its molecular function can be inferred accordingly.
Patterns of cellular expression can clarify a gene's cellular function
In every newly sequenced genome, researchers discover protein-coding genes that lack clear structural relationships to already known genes or proteins. In such cases, alternative approaches can be used to gather clues about a gene's function. Determining the Tissues in which a gene is expressed or the conditions that trigger The production of its gene product can provide invaluable leads. A wide variety of techniques has been developed to study these expression patterns.
Two-dimensional gel Electrophoresis. As shown in Figure 3-21, two-dimensional gel electrophoresis can resolve and detect up to 1,000 different proteins in a single gel. Mass spectrometry (see Box 3–2) can then be used to partially sequence individual proteins and match each protein back to its corresponding gene. The appearance, disappearance, or modulation of specific protein spots in samples derived from different tissues, identical tissues at various developmental stages, or tissues subjected to conditions mimicking various biological states can shed light on a gene's cellular function.
Because this method allows a vast number of diverse proteins to be visualized simultaneously, it is widely utilized in systems biology. For instance, a pathogenic bacterium may mutate in a way that confers resistance to one or more Antibiotics. There is a high probability that the protein profile of such a bacterial cell will undergo noticeable changes.
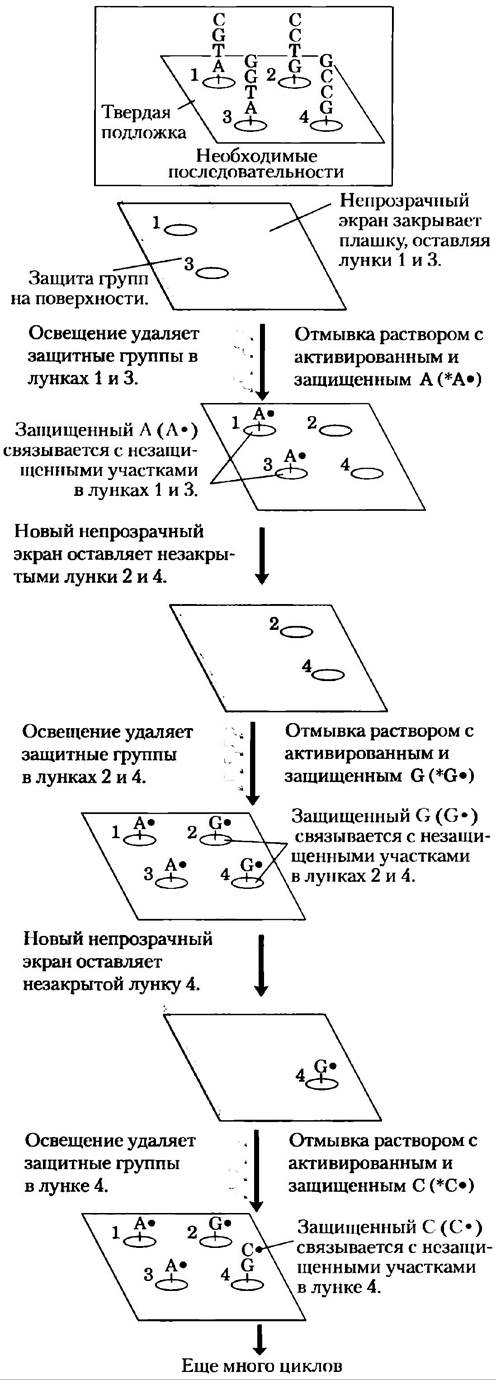
DNA Microarrays. Major technological advancements in DNA libraries, PCR, and Hybridization have converged to create DNA microarrays (sometimes simply called DNA chips), which enable the rapid and simultaneous screening of several thousands of genes. Using automated precision instruments that deposit nanoliter quantities of DNA solutions, segments of known genes ranging from a few dozen to hundreds of NUCLEOTIDES in length are amplified via PCR and spotted onto a solid support. A custom-designed chip can accommodate up to a million such spots on a surface area of just a few square centimeters. Alternatively, DNA can be synthesized directly on the solid support using photolithography (Fig. 9-21). Once prepared, the chip can be probed with mRNA or cDNA derived from a specific cell type or cell culture to identify the genes expressed therein.
Fig. 9-21. Photolithography. This method for fabricating DNA microarrays employs light-activated nucleotide precursors that couple sequentially via photoreactions (in contrast to the chemical process shown in Fig. 8-35). Information regarding the oligonucleotide sequences to be synthesized at each feature on the solid support is fed into a computer. Initially, reactive surface groups are blocked by photolabile protecting groups (•). A mask covering the surface is opened over areas destined to receive a specific nucleotide. A flash of light removes the protecting group in this exposed region. The surface is then washed with a solution of the corresponding activated nucleotide (e.g., *A•), which reacts via its 3'-hydroxyl group (*). A protecting group attached to the nucleotide's 5'-hydroxyl group prevents unwanted Side Reactions; consequently, the nucleotide becomes linked to The surface of the illuminated zone through its 3'-hydroxyl group. The mask is then replaced with another designed to selectively illuminate areas that are to receive nucleotide b. A flash of light removes the 5'-protecting groups on the previously attached nucleotides. Next, a solution of *G• is added, and the nucleotide couples at the appropriate sites. The surface is subsequently treated in a stepwise fashion with solutions of two other activated nucleotides (*G• and *T•) using selective masks to ensure the incorporation of the correct nucleotides in the precise sequence. This cycle continues until the desired sequences are built up at every feature on the support. Multiple identical polymer copies, rather than just a single one as depicted here, are synthesized at each spot. Furthermore, Supports contain thousands of features with distinct sequences (Fig. 9-22), whereas only four features are shown here for illustrative purposes.
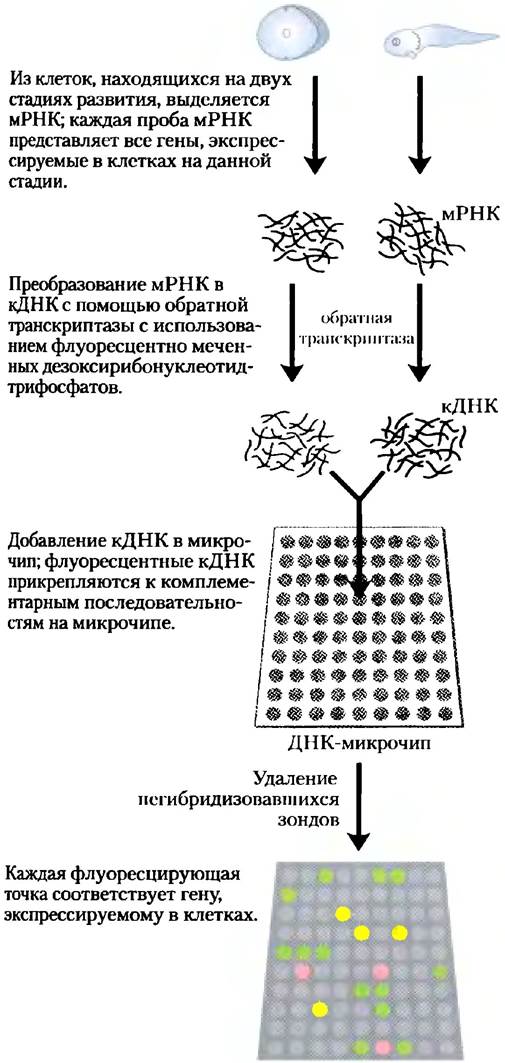
Microarray technology allows researchers to address questions regarding which genes are expressed at each developmental stage of an organism. The complete mRNA complement is extracted from Cells at two different developmental stages and converted into cDNA using Reverse Transcriptase and fluorescently labeled deoxynucleotides. The fluorescent cDNAs are mixed and used as probes, each hybridizing to complementary sequences on the microarray. For example, in Figure 9-22, labeled nucleotides are used so that the cDNA from each sample fluoresces in a distinct color. The cDNAs from the two samples are then combined and used to probe the microarray. Spots fluorescing green correspond to mRNAs predominantly expressed at the single-cell stage, whereas those fluorescing red correspond to sequences predominant at later developmental stages. mRNAs present in equal amounts at both developmental stages appear yellow. By using a mixture of two samples to measure relative rather than absolute sequence Abundance, this method compensates for variations in the initial amount of DNA spotted at each feature and other potential microarray artifacts. Fluorescent spots provide a snapshot of all genes expressed in the cells at the moment of sampling—Gene Expression on a genome-wide scale. For genes of unknown function, the timing and conditions of their expression can provide critical insights into their cellular roles.
Fig. 9-22. DNA microarray. A microarray can be constructed from any known DNA sequence, from any source, generated either by chemical synthesis or via PCR. DNA is deposited onto a solid support (typically specially treated Glass slides) using automated instruments capable of delivering extremely small (nanoliter) droplets to precise locations. UV irradiation is used to cross-link the DNA to the slides. Once the DNA is anchored to the surface, the microarray can be probed with other fluorescently labeled Nucleic Acids. In this illustration, mRNA samples are obtained from frog cells at two developmental stages. cDNA probes are generated for each sample using nucleotides labeled with different fluorophores, and a mixture of these cDNAs is used to probe the microarray. Green spots correspond to mRNAs prevalent at the single-cell stage; red spots correspond to sequences more abundant at later developmental stages. Yellow spots indicate approximately equal mRNA levels at both stages. Synthesis of Oligonucleotide chips
A microarray example (Fig. 9-23) demonstrates the impressive results that can be achieved. Segments of each of the more than 6,000 genes from the fully sequenced yeast genome were individually amplified by PCR, and each segment was spotted onto a solid support at a specific Location to yield the microarray shown here. In a sense, this chip serves as a snapshot of the entire yeast genome.
Fig. 9-23. Enlarged view of a DNA microarray. Each glowing spot on the microarray contains the DNA of one of the 6,200 genes in the yeast genome (S. cerevisiae), with every single gene represented on the chip. The microarray was probed with fluorescently labeled nucleic acid derived from mRNA isolated (1) when cells were growing normally in culture, and (2) 6 hours after the cells began forming spores. Green spots correspond to genes expressed most abundantly during normal growth; red spots represent genes predominantly expressed during sporulation. Yellow spots correspond to genes whose expression levels do not change during sporulation. The image is shown magnified; the actual dimensions of the microarray are only 1.8 x 1.8 cm. Screening an oligonucleotide chip to determine gene expression patterns

Microarrays are an indispensable tool in systems biology, enabling researchers to analyze changes in gene expression at the cellular level. The object of analysis can range from a single gene to an entire genome. The same approach applies to analyzing DNA alterations, such as genetic changes driven by natural Selection or simple population variations. If a bacterial population develops a new phenotype indicating one or more Mutations, microarrays make it possible to quickly identify those mutations. To do this, a DNA chip containing wild-type Bacterial DNA is hybridized with DNA extracted from mutant cells. Where the wild-type and mutant DNA differ, hybridization fails to occur, registering as a distinct signal. Determining the complete nucleotide sequence then pinpoints the exact changes within that DNA region. This approach can be applied in medicine, for instance, to study emerging viral strains or antibiotic-resistant pathogenic bacteria.
■ Microarrays are already finding active application in fields of medicine focused on Cancer research. Various types of tumor cells within The Human Body (and even within a single specific tissue) can vary widely in growth rate, metastatic potential, and response to ongoing Treatment. It is often impossible to determine a tumor type based solely on external Clinical Features. However, cancer cells exhibit a characteristic gene expression pattern known as a transcriptional profile, which displays distinct features across Different types of cancer. This can serve as a basis for tumor Classification. A clear example of this is the remarkable progress being made in the Diagnosis and treatment of breast cancer. Over the past decade, numerous clinical studies have used microarrays to map the transcriptional profiles of several thousand breast cancer subtypes. New treatment protocols have been developed, and successes and failures have been meticulously tracked. Individual genes and gene clusters have been identified whose overexpression (sometimes in specific combinations) serves as a prognostic biomarker. As a result, extensive databases have emerged that allow clinicians to predict outcomes and select the most appropriate treatment based on a tumor's transcriptional profile. This approach is already widely used in oncology clinics, and its value for both physicians and patients will only continue to grow as new data accumulate. ■
Protein chips. Proteins can likewise be immobilized on a solid support and used to detect the presence or absence of other proteins in a sample. For example, researchers prepare a protein microchip by spotting Antibodies against specific proteins into distinct wells on a solid support. A protein mixture is then added; if it contains a protein capable of binding to any of the antibodies, that protein can be detected via solid-phase ELISA (see Fig. 5-26, o). Numerous other formats and Applications of protein chips are also currently under development. This represents yet another powerful analytical method that can be used to study either an individual protein or the entire complement of proteins within a biological system.
Uncovering protein-protein interactions helps elucidate CELLULAR AND MOLECULAR function
The key to determining the function of a particular protein lies in discovering what it binds to. In the context of protein-protein interactions, the association of a protein of unknown function with one whose role is well understood can serve as compelling circumstantial evidence. Such interactions can be revealed through a wide variety of approaches.
Comparative genomics. Although it does not provide direct proof of a physical interaction, simply observing the co-occurrence of gene combinations across specific genomes can provide vital clues to a protein's function. Researchers can search databases for genomes containing specific genes and then determine what other genes are consistently present in those same genomes (Fig. 9-24). If two genes are invariably found together in a genome, it strongly suggests that their encoded proteins are functionally related. Such correlations are extremely valuable, provided the function of at least one of the proteins is already known.
Fig. 9-24. Using comparative genomics to identify functionally linked genes. One application of comparative genomics involves generating phylogenetic profiles to pinpoint genes that consistently co-occur within genomes. This example illustrates a comparison among four organisms, but in practice, computerized search engines can span numerous species. The designations P1, P2, etc., refer to the proteins encoded by each species. This method does not require homologous proteins. Because proteins P3 and P6 always appear together in the genomes in this example, they are likely to be functionally related. Further experimental studies are required to confirm this hypothesis.

Purification of Protein Complexes. Thanks to The Development of cDNA libraries in which each gene is fused to an epitope tag, scientists can immunoprecipitate a gene's protein product using an antibody that binds specifically to that epitope (Fig. 9-15, b). If the tagged protein is expressed within a cell, other proteins that bind to it will coprecipitate as well. Identifying these associated proteins reveals some of the protein-protein interactions involving the tagged protein. There are many variations of this technique. For example, a total cell extract from cells expressing the tagged protein can be applied to a Column containing an immobilized antibody. The tagged protein binds to the antibody, and interacting proteins are retained on the column alongside it. The bond between the protein and the tag is then cleaved with a specific protease, and the eluted protein complexes are collected for analysis. These methods can be applied to map complex interaction networks inside the cell. Many of the terminal sequences listed in Table 9-3 can be utilized in similar chromatographic protocols: the affinity of the terminal tag for a specific ligand is exploited to identify proteins capable of binding to the engineered target protein.
The yeast two-hybrid system. A sophisticated genetic method for identifying protein-protein interactions relies on The properties of the Gal4 protein (Gal4p), which activates METABOLISM/31.html">Transcription of certain yeast genes (see Fig. 28-31). Gal4p possesses two distinct functional domains: one that binds to a specific DNA sequence and another that activates RNA polymerase to synthesize mRNA from an adjacent reporter gene. Each domain is stable on its own, but activating RNA polymerase requires an interaction between the activation domain and the DNA-binding domain, which positions it correctly. Thus, for these domains to function properly, they must be brought into close proximity (Fig. 9-25, a).
In this technique, the protein-coding Regions of the genes under study are fused to the coding sequences for either the DNA-binding domain or the activation domain of Gal4p, resulting in the expression of a set of fusion proteins. If the protein attached to the DNA-binding domain interacts with the protein attached to the activation domain, Transcription is initiated. The reporter gene transcribed by this activation typically encodes a protein essential for cell growth or an enzyme that catalyzes a colored reaction product. Consequently, when grown on a selective medium, cells harboring such a pair of interacting proteins can be readily distinguished from those that do not. In most cases, the Gal4p DNA-binding domain gene is fused to a library of genes in one yeast strain, while the activation domain gene is fused to a different library of genes in a second yeast strain; the two strains are then mated, and colonies are grown from the resulting diploid cells (Fig. 9-25, b). This enables large-scale screening of interacting cellular proteins.
Fig. 9-25. The yeast two-hybrid system. (a) In this system, protein-protein interactions are detected by bringing together the DNA-binding and activation domains of yeast Gal4 through the interaction of two proteins, X and Y, fused to the respective domains. This interaction triggers the expression of a reporter gene. (b) Two sets of genetic fusions are created in different yeast strains, which are then mated. The resulting mixture is plated on a selective medium where yeast cannot survive unless the reporter gene is expressed. Thus, all surviving colonies harbor interacting fusion protein pairs. Sequencing the associated proteins from the surviving cells identifies the interacting partners. Yeast two-hybrid systems

All of these methods provide vital insights into protein function. However, they do not replace classical biochemistry; rather, they grant researchers direct access to exciting new biological frontiers. Ultimately, a complete understanding of the functional role of any novel protein requires traditional biochemical techniques, such as those historically used to characterize many well-known proteins. Combined with the ever-evolving toolkit of biochemistry and molecular biology, Genomics and proteomics are accelerating the discovery not only of new proteins, but also of previously unknown biological processes and mechanisms.
Summary of Section 9.3 From Genomes to Proteomes
■ The proteome is the complete set of proteins expressed by a cell's genome. The emerging field of proteomics aims to catalog and determine the functions of every protein within a cell. This integrated approach to analyzing multiple proteins or other cellular macromolecules is sometimes referred to as systems biology.
■ One of the most powerful ways to elucidate the function of a newly discovered gene is through comparative genomics—searching databases for genes with matching sequences. Paralogs and orthologs are proteins (and their corresponding genes) that share clear sequence and functional similarities within a single species and
across different species, respectively. In some cases, the co-occurrence of a gene in specific combinations with other genes, observed as a conserved pattern across multiple genomes, can hint at its potential function.
■ Cellular proteomes can be visualized using two-dimensional gel electrophoresis and analyzed via mass spectrometry.
■ A protein's cellular function can sometimes be inferred by determining when and where its gene is expressed. Researchers use DNA microarrays (chips) and protein chips to study gene expression at the cellular level.
■ Cutting-edge methodologies, including comparative genomics, immunoprecipitation, and yeast two-hybrid systems, make it possible to detect and map protein-protein interactions. Such interactions provide crucial clues regarding protein function.
Last update: 06/08/2026
Editorial and Educational Adaptation: This material has been compiled based on the primary/original source text. The project team performed an editorial review, corrected technical inaccuracies, structured sections, and adapted the content for an educational format.
What was processed:
- elimination of formatting defects (OCR errors, structural breaks, corrupted characters);
- editorial organization of content;
- standardization of terminology in accordance with academic sources;
- verification of factual statements against the original source text.
All mentions of the author, publication year, and origin of the primary text have been preserved in accordance with the source.