Biochemical Engineering Fundamentals, Part 1 - Bailey J., Ollis D. 1989
Kinetics of Enzyme-Catalyzed Reactions
Other Factors Affecting Enzymatic Activity
Enzyme Reaction Rates and Temperature
In studying any problems of chemical kinetics, one of the fundamental theoretical principles is the Arrhenius equation, which expresses the Temperature dependence of the reaction rate constant:
Class="center">
where Ea is the activation energy of the reaction; R is the gas constant; A is the pre-exponential factor; 7 is the absolute temperature.
When plotted, the dependence of Ink on 1/7 is represented by a straight line with a slope of — Ea/R [provided, of course, that the condition of equation (3.66) is met]. Many enzyme-catalyzed reactions also obey the Arrhenius temperature dependence of the rate constant; the experimental data presented in Fig. 3.24 serve as an example.
It should be emphasized, however, that the temperature range in which the data shown in Fig. 3.24 were obtained is very narrow. This experiment did not consider temperatures significantly exceeding normal biological limits. What would happen if we tried to make the enzyme catalyze the process even faster by raising the temperature further? As shown in Fig. 3.25, in most cases, the result would be quite disastrous.
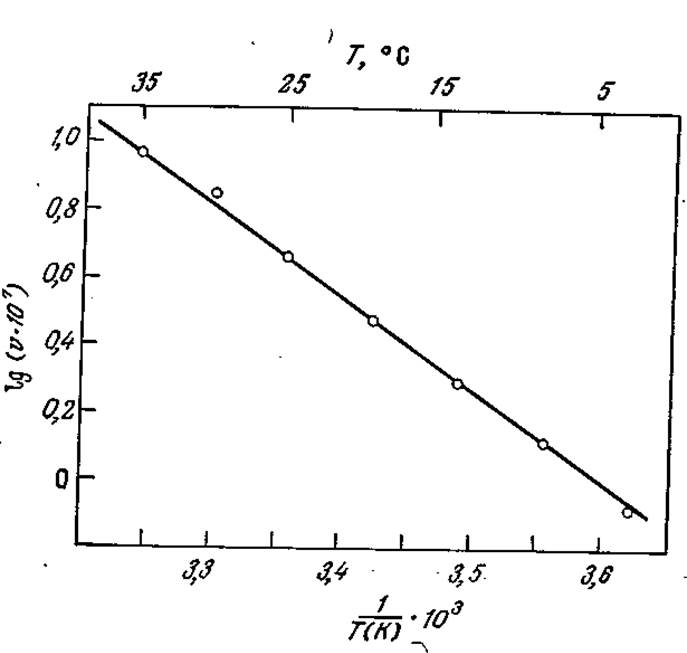
FIG. 3.24. Arrhenius temperature dependence of The rate of an enzymatic reaction (Myosin-catalyzed ATP Hydrolysis). [Reproduced from: Laidler K. J., The Chemical Kinetics of Enzyme Action, p. 197, The Clarendon Press, Oxford, 1958; data from Quellet L., Laidler K., Morales M. F., Molecular Kinetics of Muscle Adenosine Triphosphate, Arch. Biochem. Biophys., 39, 37 (1952).]
Denaturation of most Proteins begins in the temperature range of 45 to 50 °C and is completed very rapidly at 55 °C. One mechanism of thermal Protein Denaturation is obvious: as the temperature rises, the atoms within the protein molecule gain increasingly higher energy, including kinetic energy, and eventually, the disruption of weak bonds stabilizing the globular Structure OF THE protein becomes possible, leading to its inactivation.
Thermal inactivation of Enzymes can be reversible, irreversible, or mixed. The temperature dependence of the Enzymatic Catalysis rate over a sufficiently wide temperature range can be described using a simple model of reversible thermal inactivation. According to this model, we assume that the inactive (i) and active (a) forms of the enzyme are in equilibrium:

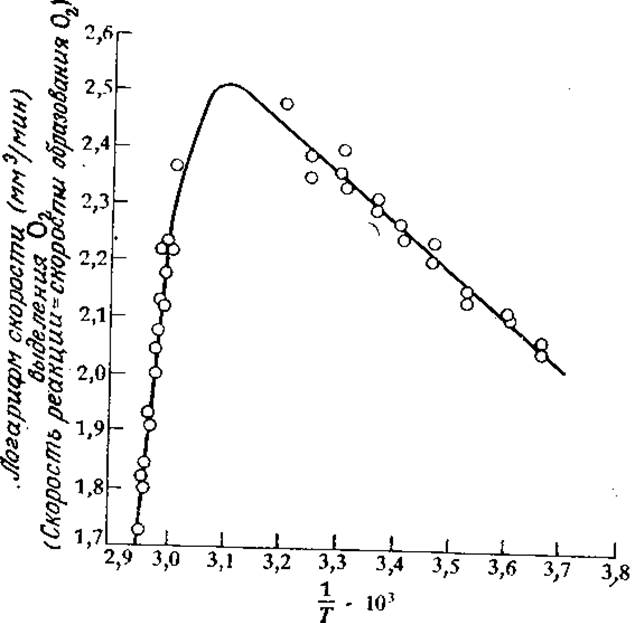
FIG. 3.25. At high temperatures, when The process of thermal Enzyme inactivation begins to dominate, the Arrhenius temperature dependence of the reaction rate breaks down (an example of Н2О decomposition by catalase is shown). The solid curve is calculated using equation (3.73) with the following parameter values: E = 3,5 kcal/mol, ∆Hd = 55,5 kcal/mol, ∆Sd = 168 kcal/(mol∙K), ß = 258 mm3/min. [Reproduced from: Sizer I.W., Temperature Activation and Inactivation of the Crystalline Catalase-Hydrogen Peroxide System, J. Biol. Chem., 154, 461 (1944).]
The Equilibrium Constant of this reaction can be expressed by the following equation:

In this equation, the symbols ∆Gd, ∆Нd, and ∆Sd denote the Free energy, enthalpy, and Entropy of inactivation, respectively.
Although isolated Hydrogen Bonds are relatively weak (their energy typically ranges from 3 to 7 kcal/mol), the enthalpy of enzyme inactivation, ∆Нd, is quite high, amounting to 68 and 73,5 kcal/mol for Trypsin and hen egg white Lysozyme, respectively. The inactivation of these enzymes is accompanied by an entropy change of + 213 cal/(mol∙K). Due to the high enthalpy of denaturation, even small changes in temperature significantly alter the relative amount of the active form of the enzyme. At such high values of ∆Нd, the enzyme is inactivated almost completely within a range of thirty degrees.
Since the entire enzyme exists in either the active or inactive form, i.e.,
eа + ei = e0 (3.69)
it follows from equation (3.68) that

According to Transition State Theory, the rate of reaction (3.4) at high substrate concentrations can be expressed as follows:
vmax = ea∙k(T) (3.71)
where

Here, kB and h are the Boltzmann and Planck constants, respectively, and a is a coefficient. From equations (3.68), (3.70) — (3.72), it follows that

In equation (3.73), the coefficient ß includes a, kB, h, е0, and ехр(∆S*/R).
This equation is the mathematical expression describing The behavior of enzyme-substrate systems shown schematically in Fig. 3.25. The solid line shown in this figure, which passes through the experimental data points, was actually calculated from equation (3.73) after determining the parameters ß, Е, ∆Sd, and ∆Нd from the same experimental data. At high values of 1/T, the slope of the curve is approximately equal to —E/R (the error is T (K) and usually does not make a significant contribution). The slope of the other linear section of the curve at higher temperatures is approximately (∆На—Е)/ R. The value of ∆Sd can be determined using the fact that at temperature Tmах, when lnvmax reaches its maximum value,

[This expression is easily obtained by Setting d(lnvmax)/dT to zero.] Since Tmax is known from measurements, and we have already determined The values of E and ∆Hd, it is straightforward to calculate the right-hand side of equation (3.74). Now, knowing the value of Kd(Tmах), we return to equation (3.68) and find ASd. Finally, we select a value for the coefficient ß such that vmах [Tmах in equation (3.73)] equals the measured value. If necessary, more accurate parameter values can be obtained by successive approximations. In particular, the value of Tmax can have a very significant effect on the results. Of course, other parameters of the reaction rate equations, such as the Michaelis constant or the inhibitor constant, also depend on temperature. If these parameters are considered equilibrium constants, as is often the case, we should arrive at a temperature dependence similar to that expressed by equation (3.68). Then, a plot of lnK (or pK) versus 1/T will be a straight line, from the slope of which the Standard Free Energy can be determined.
In some cases, the plot in these coordinates is not a straight line; in other words, the slope of the line changes as the temperature range varies. Such complications may arise from unjustified simplifications in the interpretation of Km or Ki, or even in The sequence of enzyme-catalyzed reactions. Recall, for example, that for the simplest reaction sequence (3.4), Km is nothing other than The ratio of the rate constants of the elementary reaction steps, as expressed by equation (3.5). If each of these elementary step constants is, in turn, expressed in the form of the Arrhenius equation [equation (3.66)] or the transition state theory equation [equation (3.72)], a highly complex temperature dependence will result. Another possible source of difficulty in determining the temperature dependence of certain reaction rate parameters is the existence of multiple intermediate enzyme-substrate complexes (or enzyme-product complexes).
Such considerations form The basis of a useful and widely used method for validating kinetic models and their corresponding hypothetical reaction pathways. If the dependence of kinetic parameters in Arrhenius plots is non-linear, the original model is either oversimplified or entirely incorrect.
Last update: 06/08/2026
Editorial and Educational Adaptation: This material has been compiled based on the primary/original source text. The project team performed an editorial review, corrected technical inaccuracies, structured sections, and adapted the content for an educational format.
What was processed:
- elimination of formatting defects (OCR errors, structural breaks, corrupted characters);
- editorial organization of content;
- standardization of terminology in accordance with academic sources;
- verification of factual statements against the original source text.
All mentions of the author, publication year, and origin of the primary text have been preserved in accordance with the source.