BIOLOGY Volume 2 - A Guide to General Biology - 2004
16. PLANT COORDINATION AND REGULATION
16.2. Plant Growth Substances
Chemical (humoral) coordination in animals is carried out by means of HORMONES, i.e., substances that are synthesized in one part of the body and act—at very low concentrations—in another. In plants, the coordination of Functions is achieved through compounds that are not necessarily transported away from their site of synthesis; therefore, they cannot always be strictly called hormones. Furthermore, because these chemical agents typically affect growth to a greater or lesser extent, it is preferable to refer to them as growth substances. However, this terminological distinction is often overlooked by many authors, and terms like "Plant Hormones" or "phytohormones" are widely used and will be adopted here as well. It is simply important to realize that the precise Mechanisms of action of plant growth substances remain unclear, and drawing an analogy with animal hormones can be misleading. It should be kept in mind that the growth process consists of three stages—Cell Division, cell elongation, and differentiation (specialization)—and that this process does not occur in all PARTS OF THE plant (Sec. 22.4). Consequently, this will influence the action and distribution of various growth substances within the plant. There are five main classes of growth substances:
1) Auxins, typically associated with cell enlargement and differentiation;
2) Gibberellins, which have effects similar to those of auxins;
3) Cytokinins, associated with cell division;
4) Abscisic acid, generally associated with dormancy, such as in lateral buds;
5) Ethylene (ethene), often associated with organ senescence.
In this chapter, we will first examine each Class of growth substances individually and then discuss key Milestones in the plant life cycle, with a particular emphasis on the fact that growth substances frequently produce their effects by acting in combination.
16.2.1. Auxins and Phototropism
Discovery of Auxins
Auxins were discovered through The Study of phototropism, which began with the experiments of Charles Darwin and his son Francis. Using oat coleoptiles as experimental material (Fig. 16.2), they demonstrated that the growth of seedlings toward a light source is the result of a certain "influence" traveling downward from the tip to the growth zone below. Some of these experiments are shown diagrammatically in Fig. 16.3, where each diagram reflects the results obtained from numerous coleoptiles.
16.5. a) State the Conclusions that can be drawn from experiments A–D (Fig. 16.3), given that the curvature of the coleoptile is caused by asymmetrical growth in the region just below the tip.
b) Based on the outcome of experiment B, why was it necessary to conduct experiment C?
If we analyze this tropism through the lens of the classical "signal → receptor → Transduction → effector → response" pathway, the biggest gap in our knowledge relates to The Mechanism of signal transmission. In 1913, this question was investigated by the Danish plant physiologist Boysen-Jensen. Some of his experimental results are illustrated in Fig. 16.4.
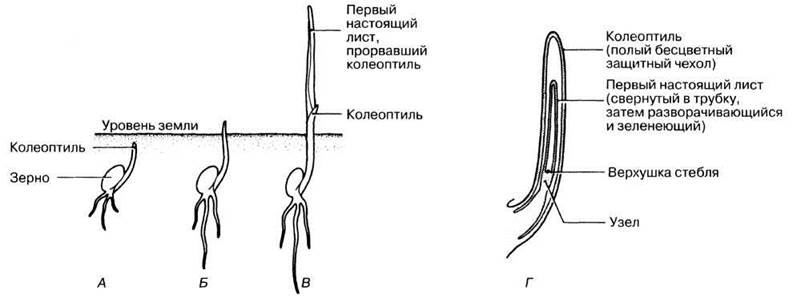
Fig. 16.2. Typical germination of a cereal grain: A, B, and C — various stages of germination; D — Cytology/practical/54.html">Longitudinal section of the coleoptile at stage B.

Fig. 16.3. Darwin's Experiments on the phototropism of oat coleoptiles. A, B, C, and D — diagrams of various experiments showing the type of Treatment (left) and the result (right).

Fig. 16.4. Boysen-Jensen's experiments on the phototropism of oat coleoptiles. A, B, and C — diagrams of various experiments showing the type of treatment (left) and the result (right).
16.6. What additional information was provided by Boysen-Jensen's experiments?
16.7. What results would be obtained if these experiments were repeated under uniform illumination from all sides? Draw diagrams and explain your answer.
16.8. What conclusions can you draw based on the results presented in Fig. 16.5?
16.9. What result would you expect if a treated Agar block is placed on the right side of a decapitated coleoptile in Experiment B?
Finally, in 1928, the Dutch plant physiologist Went proved the existence of a specific chemical messenger. Hypothesizing the presence of such a substance, he decided to intercept and collect it as it moved from the coleoptile tip into the zone below, and then test the efficacy of this agent in further experiments. Went surmised that it consisted of small molecules capable of diffusing into a piece of agar gel, whose Structure leaves quite large free spaces between its molecules. Some of the data obtained from his experiments are shown in Fig. 16.5.
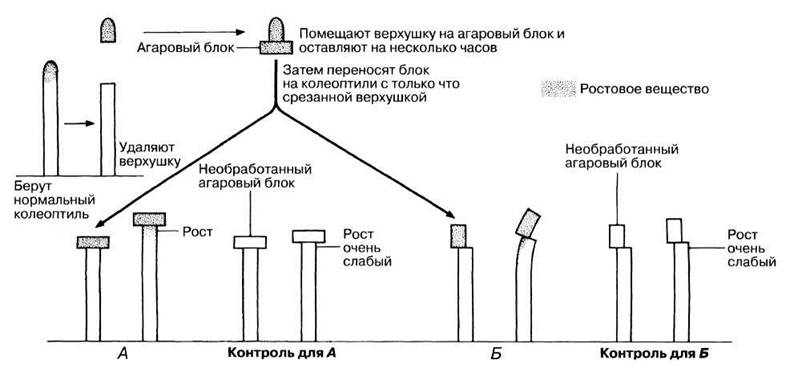
Fig. 16.5. Went's experiments. A and B are diagrams of different experiments showing the type of treatment (left) and the result (right). Control experiments are shown alongside. All experiments were carried out in the dark or under uniform lighting from all sides.
Figure 16.6 illustrates another ingenious experiment by Went. In the control experiments, the coleoptile tip was placed on two agar blocks (A and B) and incubated in the dark or under uniform illumination; these blocks were then transferred to coleoptiles with their tips removed. The magnitude of the curvature induced by blocks A and B in this case was identical. However, unilateral illumination of the tip resulted in an uneven distribution of the active substance between blocks A and B. This not only confirmed Boysen-Jensen's findings on The Effect of light on the distribution of the active substance, but also laid the groundwork for its quantitative determination using so-called bioassays. A bioassay is an experiment in which the quantity (concentration) of a substance is measured by its effect on a biological system. Went demonstrated that the degree of curvature of oat coleoptiles is directly proportional to the concentration of the growth factor (within the physiological range).
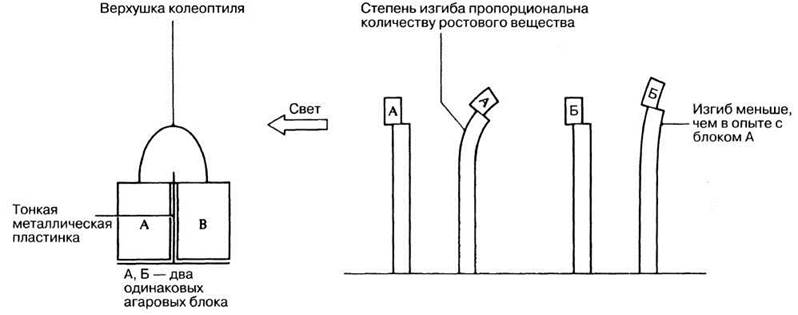
Fig. 16.6. Went's experiment demonstrating the effect of unilateral illumination on the distribution of the growth substance (auxin).
Subsequently, this substance was named auxin (from the Greek auxein, meaning to increase). In 1934, it was identified as indoleacetic acid (IAA). It was soon discovered that IAA is widespread in the plant kingdom and is closely associated with the increase in plant cell size. Figure 16.7 summarizes MODERN CONCEPTS OF IAA movement during unilateral illumination of coleoptiles. It should be noted, however, that of all plant systems studied from this perspective, the coleoptile is the simplest; in other cases, the mechanism of the growth response is likely more complex. Furthermore, little evidence has yet accumulated to show that the auxin gradient is established as early as the critical period prior to the manifestation of the response.
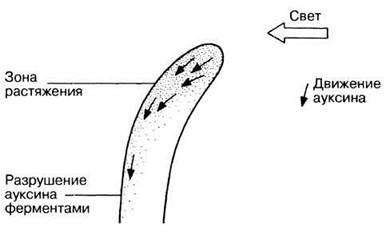
Fig. 16.7. Hypothesis explaining the effect of unilateral illumination on auxin distribution in the coleoptile. Auxin is not inactivated by light, but moves away from its source. As a result, its concentration increases on the shaded side, which stimulates cell elongation in this region, causing the plant to bend.
Structure of IAA
The structural formula of IAA is shown in Fig. 16.8.
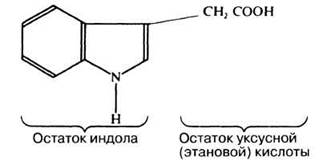
Fig. 16.8. Structural formula of indoleacetic acid (IAA), or heteroauxin.
Other substances similar to IAA in structure and activity were soon isolated, and several analogous compounds were successfully synthesized. All of them are now grouped into a class of plant hormones called auxins (IAA is also referred to as heteroauxin). Some of their commercial Applications are discussed in Section 16.2.5.
Synthesis and Distribution of Auxins
Auxins are continuously produced in the SHOOT apex and young leaves. Their movement from the site of synthesis is basipetal (from the apex to the Base of the organ) and polar (in one direction only). They apparently move from Cell to Cell by diffusion and are ultimately inactivated and broken down by Enzymes. Long-distance transport occurs through The Vascular System (primarily the phloem) and is directed from shoots to roots. Small amounts of auxins are likely synthesized by the roots themselves. The effect of various concentrations of these substances on seedling growth can be investigated in different ways, such as that described in Experiment 16.1.
Experiment 16.1. Investigating the effect of indoleacetic acid (IAA) on the growth of oat coleoptiles
The aim of the experiment is to study the effect of various concentrations of IAA on the growth of oat coleoptiles. This growth depends on sunlight (white light), so manipulations with coleoptiles must be carried out under red light or the dimmest possible illumination. A sucrose solution is used as an energy source for growth. To eliminate METABOLISM/18.html">The Influence of auxins produced within the coleoptiles, their tips (3 mm long) are removed.
Materials and Equipment
Oat seedlings with coleoptiles at least 1.5 cm long. [Soak 100 oat grains and leave them overnight; place the soaked seeds on moist filter paper in a Petri dish, cover it with aluminum foil, and place it in a dark place (incubator) at 20 °C for 5 days. To obtain the 60 coleoptiles required for each experiment, at least 100 grains should be soaked, as some may fail to germinate.]
6 test tubes in a rack
6 Petri dishes with lids
5 graduated 5-ml pipettes
25-ml graduated cylinder or 10-ml graduated pipette
Coleoptile cutter (Fig. 16.9)
Paintbrush
2% sucrose solution
Distilled Water
IAA stock solution (concentration 1 g/L). Since IAA is poorly soluble in water, it is first dissolved in ethanol; 1 g of IAA is placed in 2 mL of ethanol, and then 900 mL of distilled water is added. Heat the solution to 80 °C, hold at this Temperature for 5 min, and bring the volume up to 1 L with distilled water. Prepare The amount of solution required for the experiment.
1. Label six test tubes and six Petri dishes from A to E.
2. Pour 18 mL of the 2% sucrose solution into each test tube.
3. Using a clean 5-mL pipette, add 2 mL of the IAA solution to test tube A and mix thoroughly.
4. Using a separate pipette, transfer 2 mL of the solution from test tube A to test tube B and mix the contents of test tube B thoroughly.
5. Using a fresh pipette each time, transfer 2 mL from test tube B to test tube C and mix; then 2 mL from test tube C to test tube D, and mix; and finally, 2 mL from test tube D to test tube E.
6. Add 2 mL of distilled water to test tube F.
7. Transfer the solutions from test tubes A–E into Petri dishes A–E.
8. Cut 10-mm coleoptile segments from 60 oat seedlings at a distance of 2 mm from their tips. For this, use a double-bladed cutter with a fixed distance of exactly 10 mm between the blades; use washers or other spacers to set the blades, and secure the cutter with a screw and two nuts (Fig. 16.9). If you arrange the coleoptiles parallel to each other and align their tips along a single line, you can cut several specimens at once.
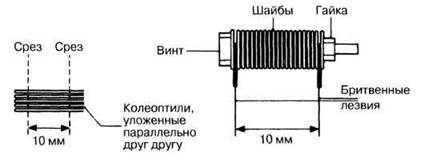
Fig. 16.9. Obtaining 10-mm coleoptile segments.
9. Using a paintbrush, transfer 10 coleoptile segments into each Petri dish, taking care to avoid cross-contamination of the solutions (the more coleoptiles you use, the more statistically reliable the results will be).
10. Cover the dishes with their lids and incubate them in the dark at 25 °C for three days (in an incubator).
11. Measure the length of the coleoptiles as accurately as possible.
12. Discard the maximum and minimum values, and determine the mean coleoptile length for each dish.
13. Plot a graph of mean coleoptile length (on the y-axis) against IAA concentration in ppm (on the x-axis).
16.10. What will be the concentration of IAA in each Petri dish, expressed in parts per million (ppm)
(1 g/L = 1000 mg L-1)?
14. Analyze your findings and compare them with the results shown in Fig. 16.10. More accurate results can be obtained by pooling the data from the entire student group.

Fig. 16.10. Dependence of ROOT and shoot growth on auxin concentration (shown on the abscissa using a logarithmic scale). Note that the auxin concentration that stimulates shoot growth inhibits root growth.
Last update: 06/08/2026
Editorial and Educational Adaptation: This material has been compiled based on the primary/original source text. The project team performed an editorial review, corrected technical inaccuracies, structured sections, and adapted the content for an educational format.
What was processed:
- elimination of formatting defects (OCR errors, structural breaks, corrupted characters);
- editorial organization of content;
- standardization of terminology in accordance with academic sources;
- verification of factual statements against the original source text.
All mentions of the author, publication year, and origin of the primary text have been preserved in accordance with the source.