Protein Chemistry - Part 2 - Selected Chapters of Special Protein Chemistry - Ashmarin I. P. 1968
Histones
Heterogeneity of Histone Fractions
Thus, data from chemical fractionation and Ion-exchange Chromatography show that the total histone of calf Thymus (or other Tissues) consists of at least 5–6 major, easily distinguishable components, most of which can be separated into several subfractions (see Table 8). The very fact that fractions obtained by one method are often subdivided into two or more subfractions by another points to their heterogeneity. A comparison of the results from Amino Acid Composition, N-terminal group, and molecular weight determinations of individual fractions confirms this Conclusion (Table 9).
Class="center">Table 8 Major histone classes and their fractional composition revealed by various Separation techniques

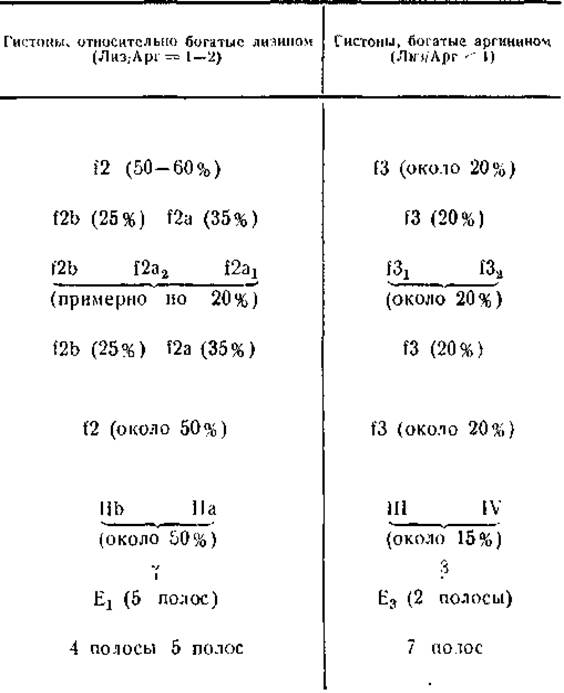
Table 9 Content of N-terminal Amino Acids in calf thymus histone fractions (in % of all N-terminal groups) (Johns, 1964; Butler, 1964)
|
N-terminal amino acid |
f1 |
f2a |
f2b |
f3 |
|
35 |
54 |
12 |
95 |
|
|
50 |
12 |
82 |
3 |
|
|
6 |
11 |
1 |
0,5 |
|
|
3 |
2 |
2 |
— |
|
|
1 |
1 |
— |
0,5 |
|
|
2 |
11 |
2 |
0,5 |
|
|
Others |
3 |
9 |
1 |
0,5 |
|
Molecular weight (calculated per 1 mol of N-terminal amino acid) |
30 000 |
112 000 |
15 000 |
18 000 |
It is evident that the major histone fractions are far from homogeneous, even if one assumes that a single type of N-terminal amino acid corresponds to a single type of protein. Meanwhile, certain histone fractions contain several distinct Proteins sharing identical N-terminal groups. For example, fraction f2b was found to contain two N-terminal Peptides that differ sharply in amino acid composition*, yet possess the same N-terminal amino acid—proline. This latter finding indicates that these peptides belong to two different proteins and that preparation homogeneity established via the N-terminal group often cannot be considered reliable.
Another example is the lysine-rich histone fraction Ia. The total content of lysine and Arginine in it is 28 mol %. Consequently, the molecule of this protein should contain 29 Trypsin-sensitive bonds and yield 30 peptides upon Hydrolysis. In reality, however, 68 peptides were detected in the hydrolysate. Clearly, fraction Ia consists of at least two polypeptide chains which, although possessing identical N-terminal groups, differ in their amino acid composition.
* The Structure of these peptides is as follows: 1) —Pro—(Ala, Glu, Pro)—Lys; 2) —Pro—(Asx, Glu, His, Ile, Ser2, Thr, Val) — Lys
Evaluation of histone homogeneity using these Methods, as well as ion-exchange chromatography, Electrophoresis, and countercurrent distribution, has not only proven the heterogeneity of the major fractions but has also revealed cross-contamination among them. It was thus demonstrated that the lysine-rich histone fraction contains impurities of relatively lysine-rich and arginine-rich Histones, whereas the arginine-rich fraction contains impurities of relatively lysine-rich histones. All of this significantly complicates The Study of the Introduction/19.html">Primary Structure of histones and the assessment of their physicochemical and biological properties.
Although amino acid composition analysis, N-terminal amino acid determination, and molecular weight estimation indicate the heterogeneity of the isolated histone fractions, they do not allow for the determination of their total number. One can approach an answer to this question by examining the patterns of electrophoretic separation in starch and polyacrylamide gels.
Starch gel electrophoresis was first applied to histones in 1959 by Neelin and Connell, who succeeded in resolving about 16 subfractions for chicken erythrocyte histones and 18 for calf thymus histones. Several of these subfractions resulted from histone aggregation, as the electrophoresis was carried out at pH 4.1–4.9. To prevent aggregation, Johns, Phillips, et al. began performing electrophoresis at pH 2.3 in a gel prepared in 0.01 N Hydrochloric acid. Under these conditions, calf thymus histones separated into 10 subfractions, which fell into three groups according to their electrophoretic mobility: group E1, containing 5 bands; group E2, containing 3 bands; and group E3, which exhibited the lowest electrophoretic mobility and contained two bands. In terms of amino acid composition, group E1 corresponded to relatively lysine-rich histones, while groups E2 and E3 corresponded to lysine-rich and arginine-rich histones, respectively (see Table 8).
An even greater effect was achieved by combining starch gel electrophoresis with chemical or chromatographic fractionation. This approach made it possible to reveal additional electrophoretic zones that were masked in total histone electropherograms due to close mobilities. Along with the major zones, faint bands were detected on the electropherograms of individual histone fractions, the number of which increased with The amount of protein applied to the gel. In total, this approach revealed 8–10 major and 6–10 minor subfractions, i.e., about 16–20 individual components.
Similar results were achieved using Polyacrylamide gel electrophoresis. In the very initial experiments, this technique made it possible to separate total calf thymus histones first into 14 and then into 18 components. The number of subfractions increased significantly when the starting "material" used was not total histones but rather their major fractions, and when optimal concentrations and separation regimes were found for each fraction. Thus, for example, lysine-rich histones and fraction f2b histones were successfully subdivided into 9 and 5 individual subfractions, respectively, and the total number of detected zones reached around 30. Here too, alongside the large major subfractions, faint minor zones were discovered, the number of which depended on the concentration of the applied material (Fig. 16).
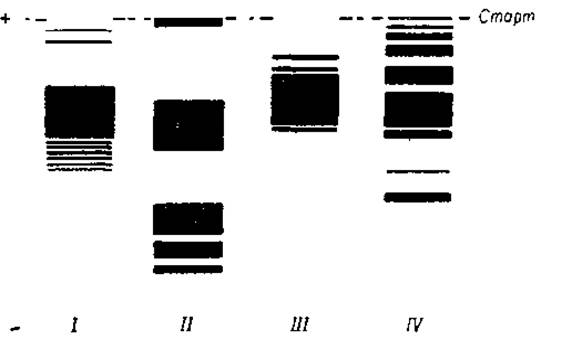
Fig. 16 Diagrams of polyacrylamide gel electropherograms of individual calf thymus histone fractions (Ashmarin et al., 1968)
I - f1 II - f2a III - f2b IV - f3
Thus, alongside several major histone fractions (8–10), which likely account for up to 90% of the total histone, researchers have revealed a whole spectrum of various minor components. At present, it remains unclear whether these are impurities of non-histone proteins whose complexes with histones dissociate during electrophoresis, products of enzymatic degradation or aggregation of the major fractions, or independent histone proteins.
The possible existence of such complexes is supported by the work of Bonner, Busch, Hnilica, and other authors, who detected non-histone proteins bound to RNA or NUCLEOTIDES within histones (for details, see § 7). However, these proteins did not migrate with histones during electrophoresis because they lacked a positive charge. Nor was it possible to detect similar minor bands on electropherograms when the major histone fractions were preliminarily partially hydrolyzed with A wide variety of proteinases and enzymatic extracts. Chromatographic purification of major fractions from accompanying impurities of other fractions also did not eliminate all minor components, although their number decreased. Their number also decreased upon electrophoresis in 7 M urea. This indicates that a significant portion of the minor components results from cross-contamination of the major histone fractions, as well as from their partial aggregation. Obviously, a definitive resolution of this issue can only be achieved by isolating these components and thoroughly analyzing their primary structure.
Therefore, it is currently difficult to state the exact number of individual histones. Nevertheless, one may assume that it is relatively small, on the order of 10–15. Such A number of histone types is by no means insignificant, considering that the repression of a single Gene requires not one, but multiple histone molecules. In this case, the existence of 10–15 individual histone types allows for a vast number of specific combinations.
Last update: 06/08/2026
Editorial and Educational Adaptation: This material has been compiled based on the primary/original source text. The project team performed an editorial review, corrected technical inaccuracies, structured sections, and adapted the content for an educational format.
What was processed:
- elimination of formatting defects (OCR errors, structural breaks, corrupted characters);
- editorial organization of content;
- standardization of terminology in accordance with academic sources;
- verification of factual statements against the original source text.
All mentions of the author, publication year, and origin of the primary text have been preserved in accordance with the source.