Review of Medical Physiology - William F. Ganong 2002
Endocrine System, Metabolism, and Reproduction
Energy Balance, Metabolism, and Nutrition
Energy Metabolism
Metabolic Rate
The amount of energy released during the Catabolism of nutrients in the body corresponds to the amount of energy released when they are burned outside the body. The energy released through catabolism is required to maintain bodily Functions, Digestion, nutrient utilization, thermoregulation, and physical activity. It provides power for active processes and heat production, and is also stored:
Class="center">
The amount of energy released per unit of time characterizes the metabolic rate. The maximum efficiency of isotonic Muscle contractions is approximately 50%:

In essence, almost all energy during isometric contraction is released as heat, since very little or no external work is performed in this case (force multiplied by the distance over which a given mass is moved) (see Chapter 3). Energy is stored through The formation of high-energy compounds. The amount of stored energy varies, and in active fasting individuals, it may be zero or negative. In adult individuals at rest in a fasting state, under emotional and physical calm and thermal comfort, almost all energy is expended on heat production. When nutrients are burned outside the body, energy is also released as heat.
Calories
The standard unit of thermal energy is the calorie (cal); 1 cal is equal to the amount of thermal energy required to raise the Temperature of 1 g of Water by 1 degree (from 15 to 16°C). This unit is also called the gram calorie, small calorie, or standard calorie. The unit predominantly used in physiology and medicine is the Calorie (kilocalorie, kcal), which equals 1000 cal.
Calorimetry
The energy released during the combustion of food products outside the body can be measured directly (direct calorimetry) by oxidizing their constituent parts in a device such as a bomb calorimeter. This apparatus is a sealed metal vessel immersed in water filling an insulated container. The substance is ignited by an electric spark. The change in water temperature serves as a measure of calorie production. Similar measurements of the energy released during The oxidation of compounds in living animal and human organisms are much more complex, and the design of the calorimeter must also take into account the ADAPTIVE REACTIONS OF the body. The heat generated in the body is measured by the change in water temperature within the calorimeter.
The ENERGY VALUE OF the main food products as measured in a bomb calorimeter is 4.1 kcal/g for CARBOHYDRATES, 9.3 for fats, and 5.3 kcal/g for Proteins. In the body, the same values are calculated for carbohydrates and fats, but protein oxidation is incomplete; the End products of Protein Catabolism, besides CO2 and H2O, also include urea and other nitrogenous substances (see below). Therefore, the energy value of protein in the body is only 4.1 kcal/g.
Indirect Calorimetry
The energy produced can be calculated by quantifying the products of Biological Oxidation—CO2, H2O, and the end products of protein catabolism—or by determining the amount of O2 consumed, which is the method of indirect calorimetry. Determining the quantity of end products is quite difficult, so it is simpler to measure the amount of O2 consumed. Since O2 does not accumulate in the body, and its consumption—except in states of oxygen deprivation—always corresponds to immediate needs, the amount of O2 consumed per unit of time corresponds to the amount of energy generated.
The difficulty in using O2 consumption to determine the amount of energy produced is that the amount of energy per mole of O2 varies slightly depending on the type of substances being oxidized. The approximate amount of energy released per liter of O2 consumed is 4.82 kcal, and for most studies, this value is sufficiently accurate. However, more precise measurements require detailed data on the oxidized food products. Such data can be obtained by determining the respiratory quotient and the amount of nitrogen excreted.
Respiratory Quotient
The respiratory quotient (RQ) is The ratio of the volume of CO2 produced to the volume of O2 consumed at rest per unit of time. It can be calculated from the respiratory exchange ratio (RER), which is the ratio of CO2 to O2 at a specific time, regardless of whether equilibrium has been reached. RQ values are influenced by non-metabolic factors. The respiratory quotient and respiratory exchange ratio can be calculated for reactions occurring outside the body, for individual Organs and Tissues, and for the whole Organism. The respiratory quotient for carbohydrates is 1.00, and for fats approximately 0.70, because H and O are present in carbohydrates in the same ratio as in water, whereas in various fats, additional amounts of O2 are required to form H2O.
Carbohydrates:

Fats:
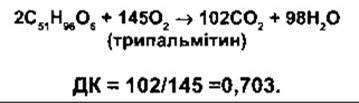
Determining the respiratory quotient of proteins in the body is a complex process. Its average value is 0.82. The approximate amounts of carbohydrates, proteins, and fats oxidized in the body over a specific time can be determined using the respiratory quotient and the amount of nitrogen excreted in the urine. The respiratory quotient and respiratory exchange ratio for the whole body have different values under various conditions. For example, during hyperventilation, the RER value increases because CO2 is eliminated through exhaled air. During heavy work, the RER can reach 2.00 because CO2 is released, and lactic acid produced by anaerobic Glycolysis is also converted into CO2 (see below). After work, the RER value may drop to 0.50 or lower. In conditions of metabolic acidosis, the RER increases because the resulting respiratory compensation enhances CO2 elimination (see Chapter 39). Under conditions of severe acidosis, the RER may exceed 1.00. In cases of metabolic alkalosis, the RER decreases.
O2 consumption and CO2 production in an individual organ can be calculated using the Fick equation by multiplying the Blood flow through the organ per unit of time by the arteriovenous O2 and CO2 differences. From this, the RQ can be determined. Data on the RQ of individual organs are essential for characterizing the metabolic processes occurring in these organs. For example, the RQ of the Brain remains constantly at 0.97–0.99, indicating that carbohydrates are the primary source of energy for this organ. During gastric juice secretion, the RER in The Stomach is negative because more CO2 is absorbed from the arterial blood than enters the venous blood (see Chapter 26).
Determination of Metabolic Rate
When determining the metabolic rate, the amount of O2 absorbed is measured using an oxygen-filled spirometer and a CO2 absorption system. A diagram of such a device is shown in Fig. 17-1. The spirometer bell is connected to a recording device whose drum rotates as the bell moves up and down. The slope of the line connecting the ends of each spirometric excursion is proportional to the amount of O2 absorbed. The amount of O2 consumed per unit of time (in milliliters) is corrected for temperature and pressure (see Chapter 34) and converted into an energy generation value by multiplying by 4.82 kcal/L of O2 consumed.
Factors Affecting Metabolic Rate
A number of factors influence metabolic rate (Table 17-1), with muscular activity being The most significant. O2 consumption increases not only during exercise but also for a prolonged period afterward to repay the oxygen debt (see Chapter 3). Metabolic rate also rises following a meal due to its specific dynamic action (SDA). SDA represents the obligatory Energy Expenditure required for the assimilation of food in the body. Specifically, the amount of protein yielding 100 kcal increases metabolic rate by 30 kcal; the same caloric equivalent of carbohydrates increases it by 6 kcal, and of fats, by 4 kcal. This means that the actual net caloric value provided by a specific foodstuff is reduced by these amounts, as the energy required for its Processing is drawn either from the food itself or from the body's energy reserves. The exact mechanism of SDA, which can last up to 6 hours, remains incompletely understood.
Table 17-1. Factors influencing metabolic rate

Another factor that elevates metabolic rate is ambient temperature. The relationship between metabolic rate and ambient temperature is U-shaped. When ambient temperature falls below body temperature, thermogenic processes such as shivering are stimulated, increasing the metabolic rate. Conversely, when ambient temperature and consequently body temperature rise, metabolic processes accelerate, increasing the metabolic rate by approximately 14% for each 1°C increase in temperature. The metabolic rate measured in a resting state within a thermoneutral comfort zone, 12 to 14 hours after the last meal, is referred to as the standard or basal metabolic rate (BMR). BMR decreases by about 10% during Sleep and by up to 40% during prolonged fasting; under these conditions, it is termed the minimal metabolic rate. The metabolic rate during normal daytime activity is naturally higher than the BMR due to physical activity and food intake, and is sometimes called the total metabolic rate. The maximum or working metabolic rate, achieved during strenuous exertion, can be up to 10 times higher than the standard BMR, and in trained athletes, up to 20 times higher.
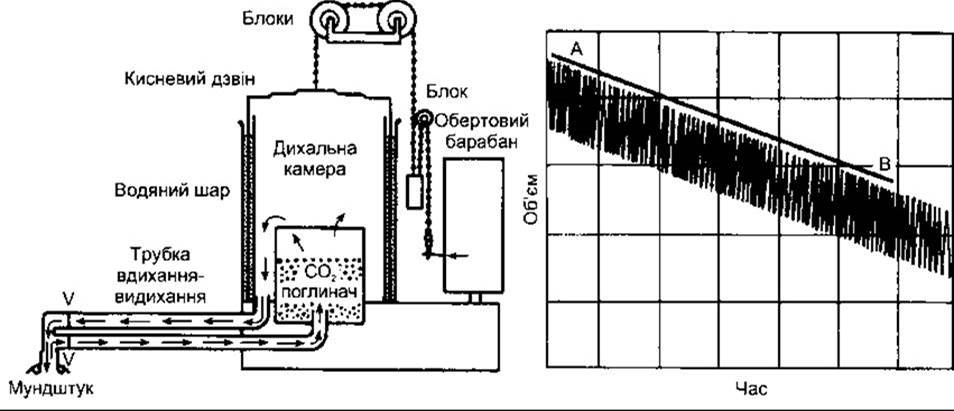
Fig. 17-1. Diagram of a modified Benedict apparatus—a recording spirometer used to measure human O2 consumption—along with its corresponding tracing. The slope of line AB is proportional to the volume of O2 consumed; V represents a one-way air valve.
The BMR of an average-sized man is approximately 2,000 kcal per day. Larger animals have a higher absolute BMR, yet the ratio of BMR to body mass is much greater in smaller animals. The body surface area of various animals correlates well with their metabolic rate, which is to be expected since heat exchange occurs across the body surface. However, the curve depicting the relationship between heat production and body mass is actually steeper: body surface area scales with body mass to the 0.67 power, whereas heat production scales to the 0.75 power (Fig. 17-2). This can be attributed to a higher mass-specific metabolic rate in larger animals, as they require more energy to overcome gravitational forces relative to their body mass. Another contributing factor to greater heat production might be a correspondingly larger capillary surface area. Nevertheless, a definitive explanation for these relationships remains elusive.
The relationship between body mass, height, and body surface area in humans is described by the following formula:
S = 0,007164 хМ0,425 х 30,725,
where S is surface area in m2; M is body mass in kg; 3 is height in cm.
Nomograms based on this formula allow for the convenient estimation of body surface area. The BMR of an adult human male is roughly 40 kcal/m2 per hour. For convenience, BMR is often expressed as a percentage increase or decrease relative to standard normal values. Thus, a value of +65 indicates that an individual's BMR is 65% above the standard for their AGE AND SEX.

Fig. 17-2. Correlation between metabolic rate and body mass plotted on logarithmic scales. The slope of the colored line is 0.75. The black line illustrates how surface area increases relative to body mass in geometrically similar animals, with a slope of 0.67 (modified from Kleiber M., reproduced with permission from McMahon TA: Size and shape in biology. Science 1973:179:1201).
In females of all ages, the BMR is slightly lower than in males. O2 consumption increases during Pregnancy due to the additional metabolic demands of the fetus. BMR is highest in children and progressively declines with age. Anxiety and tension elevate BMR by increasing adrenaline secretion and muscle tone, even during a state of rest. Conversely, in apathetic or depressed individuals, BMR may be reduced. The stimulatory effects of catecholamines and THYROID Hormones on BMR are discussed in the sections dedicated to those hormones. During prolonged fasting, BMR decreases because sympathetic Nervous system activity is concurrently suppressed, leading to lower circulating catecholamine levels that help reduce metabolic rate. Additionally, circulating levels of biologically active thyroid hormones decline (see Chapter 18). This progressive reduction in metabolic rate explains why individuals attempting to lose weight experience rapid initial weight loss that subsequently slows down over time.
The First Law of Thermodynamics—which states that energy can neither be created nor destroyed, but only transformed from one form to another—applies equally to living organisms and inanimate systems. Consequently, one must speak of an energy balance between energy intake and energy expenditure. If the caloric content of ingested food falls short of energy expenditure (i.e., a negative energy balance), the body draws upon its endogenous reserves. Glycogen, proteins, and fats undergo catabolism, resulting in weight loss. Conversely, if caloric intake exceeds the energy expended on thermogenesis and external physical activity, and nutrients are properly digested and absorbed, the energy balance is positive and the body gains weight.
The mechanisms regulating food intake are described in Chapter 14. To maintain baseline vital functions, an average adult requires approximately 2,000 kcal per day. Caloric requirements above this basal metabolic level depend on physical activity. A sedentary student (or lecturer) needs an additional 500 kcal daily, whereas a lumberjack may require nearly 3,000 kcal per day.
Last update: 10/08/2026
Editorial and Educational Adaptation: This material has been compiled based on the primary/original source text. The project team performed an editorial review, corrected technical inaccuracies, structured sections, and adapted the content for an educational format.
What was processed:
- elimination of formatting defects (OCR errors, structural breaks, corrupted characters);
- editorial organization of content;
- standardization of terminology in accordance with academic sources;
- verification of factual statements against the original source text.
All mentions of the author, publication year, and origin of the primary text have been preserved in accordance with the source.