PLANT REPRODUCTIVE BIOLOGY - N. L. Kolyasnikova - 2017
CHAPTER 4. SEED PRODUCTIVITY
An extensive body of literature is dedicated to plant seed productivity and the Methods for its determination. Its emergence has been largely driven by practical demands, since the yield problem for many agricultural crops is, in essence, Structure/149.html">The problem of enhancing their seed productivity. Responding to practical needs, for a long time the primary focus was on evaluating seed yield—that is, the quantity (typically mass) per unit area, expressed in kg/ha or q/ha.
The systematic and comprehensive study of plant seed productivity was pioneered by the research of T.A. Rabotnov. His works devoted considerable attention to the methodology of determining plant fecundity, introduced The concepts of average seed productivity and the average number of seeds per individual or generative SHOOT, which can serve as an index of individual or shoot productivity. He proposed distinguishing this from METABOLISM/2.html">THE CONCEPT OF seed yield (the number of seeds of a given species per unit area). Rabotnov noted that the number of seeds in a fruit depends on the total number of ovules and the proportion of them that successfully develop into seeds.
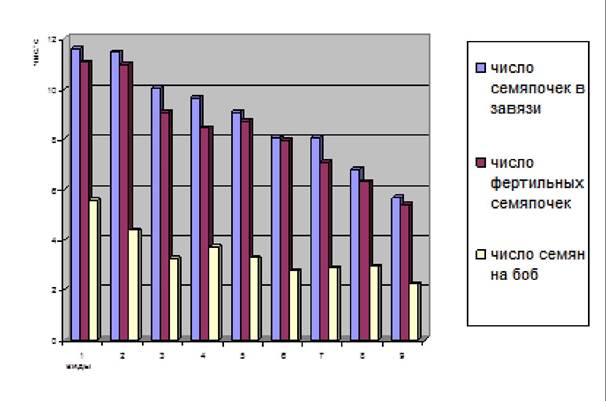
The dynamic study of angiosperm reproduction has necessitated the division of seed productivity into two categories: potential and actual (realized) seed productivity. Potential seed productivity (PSP) refers to the maximum possible number of seeds that a plant, population, or phytocoenosis can produce over a given period, assuming that all ovules initiated in the flowers successfully form mature seeds. Realized seed productivity (RSP) is the number of seeds actually produced per individual or generative shoot (Fig. 27).
Class="center">Fig. 27. Dynamics of the decline in seed productivity of the Ovary in perennial alfalfa species in 1985: 1 - Medicago glutinosa; 2 - M. varia; 3 - M. coerulea; 4 - M. sativa; 5 - M. trautvetteri; 6 - M. falcata; 7 - M. falcata (syn.); 8 - M. ruthenica (South Kazakhstan form); 9 - M. cancellata
I.V. Vainagiy [7] proposes distinguishing an elementary unit of seed productivity, based on the fact that while the number of ovules in the gynaecium is strictly fixed in some plant species, in the majority of taxonomic groups it is statistically determined. For taxonomic groups with a strictly fixed number of ovules in the gynaecium, the elementary unit is taken as the simple inflorescence or the generative shoot, if delineating the simple inflorescence is difficult. In plants where the number of ovules in the gynaecium is statistically determined, the flower or fruit is considered the elementary unit. The author believed that this approach ensures consistent accounting of ovules and seeds, with only the Determination of the number of elementary units per individual varying.
Reproduction is The process of forming structures that ensure propagation. Reproductive effort is defined as the proportion of total plant phytomass allocated to reproductive Organs. Despite differences in the methods used to determine reproductive effort (based on the phytomass of all reproductive structures combined, seed phytomass, flower phytomass, or the number of seeds and fruits), this parameter is significantly lower in perennial species than in annuals. The magnitude of reproductive effort is of critical importance for cultivated plants, as in the overwhelming majority of species and varieties, yield increases are achieved primarily through enhanced translocation of assimilates into reproductive organs (fruits and seeds), making it the primary goal of breeding. Different populations may differ substantially from one another in their reproductive effort, which is presumably an effect of species genetic polymorphism. Overall, reproductive effort is a genetically stable species-specific trait, although regular variations along eco-coenotic gradients do exist. Age-related changes in reproductive effort remain poorly studied. Reproductive effort is a vital component of plant reproductive success. Reproductive success at the level of individual life cycles is linked to plant fecundity—that is, the quantity and quality of diaspores produced by the plant. In this context, measures of reproductive success include the total number of seeds produced, the fruit-to-flower ratio, or the seed-to-ovule ratio.
Plant reproduction encompasses numerous stages. Each stage has its own key parameters that can be used as components in an overall assessment of reproductive success:
1. Budding phase - number of buds.
2. Flowering phase - amount of reproductive phytomass; number of flowers; reproductive effort; total number of ovules.
3. Pollination and Fertilization - pollen fertility; amount of pollen deposited on stigmas; number of fertilized ovules.
4. Fruiting phase - amount of reproductive phytomass concentrated in diaspores; number of fruits and seeds; seed germination and viability; heterospermy.
5. Seed dispersal phase - number of seeds entering dispersal; dispersal agents and dispersal distance.
6. Seed dormancy - depth of seed dormancy; potential for soil seed bank formation and its size.
7. Seed germination phase - number of seeds surviving by the onset of germination; number of emerged seedlings.
8. Seedling establishment - number of seedlings and their spatial distribution.
Overall, the magnitude of potential seed productivity is controlled by four groups of factors:
- genetic factors, which determine the upper limit of the plant's potential fecundity;
- physiological factors, including the age and physiological state of the individuals;
- ecological factors, which encompass environmental resources and habitat conditions;
- coenotic factors, covering the sphere of plant co-existence with All living organisms in the community.
Realized seed productivity characterizes the fecundity of individual plants, whereas seed yield characterizes the fecundity of populations. Population self-maintenance is influenced by realized seed productivity, or the Number of viable seeds produced by a generative shoot or individual. As a rule, it constitutes a minor fraction of the PSP and depends on numerous abiotic and biotic factors—such as the mode and conditions of pollination, the presence of phytophagous insects, and weather fluctuations—which leads to its high Variability. Due to this strong variability in PSP and RSP, and the often weak correlation between them, a relative index—the "seminification percentage"—has been proposed. This index is considered a reliable indicator of the "success" of seed reproduction and the well-being of a species population.
To provide a more comprehensive characterization of the plant reproductive process, it has been proposed to use the productivity coefficient ($K_{pr}$), defined as The ratio of RSP to PSP expressed as a percentage.
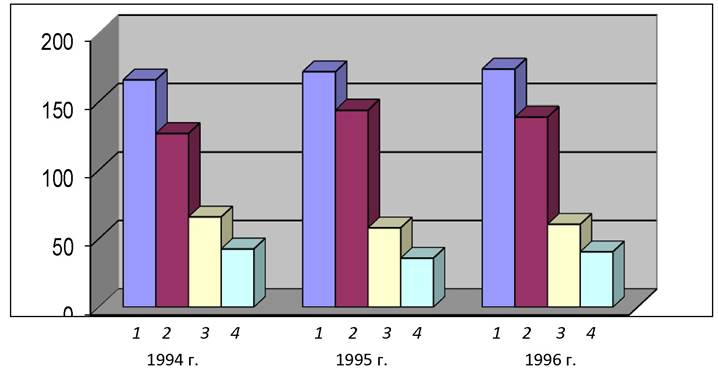
In addition to PSP and RSP, it is advisable to distinguish an intermediate concept: "conditionally real seed productivity" (CRSP), which encompasses all seeds regardless of their quality—immature, underdeveloped, and damaged by insects and Fungi. While PSP represents merely the theoretical upper limit of seed productivity that plants almost never achieve, CRSP characterizes the extent to which a species realizes its potential capacity for seed production. Comparing this value with potential seed productivity reveals what proportion of ovules actually develop into seeds. It is precisely the value of conditionally real seed productivity that reflects The impact of pollination on seed reproduction (Fig. 28).
Fig. 28. Dynamics of the decline in seed productivity of red clover heads: 1 - number of ovules per inflorescence; 2 - number of fertile ovules per inflorescence; 3 - number of seeds in green pods of the inflorescence; 4 - number of mature seeds
4.1 Methods for Assessing Seed Production in Tree Species
For the vast majority of tree species, especially conifers, seed reproduction is of paramount importance.
Its success depends on the quantity and quality of seeds ripened on the trees.
Assessing seed yields in tree species presents considerable difficulties primarily due to the significant height of the trees. Furthermore, in certain years, trees produce such a massive quantity of cones and fruits that counting them, even on a single tree, is extremely complex. Additionally, the shedding of fruits and seeds in various species does not occur all at once, but rather extends throughout the summer and autumn.
Seed productivity is defined as the number of seeds produced by a single tree or branch. The seed crop refers to the total number of seeds produced by all trees within a given unit area.
When studying forest seed production, the following diverse objectives may arise:
1) determining seed productivity and seed yield;
2) assessing seed quality: the percentage ratio of sound, diseased, and empty seeds; germination percentage; germination energy; and seed dormancy;
3) elucidating the dynamics of seed productivity: the timing of seed ripening, the beginning and end of fruit and seed fall, and the periodicity of seed production in relation to environmental conditions and weather patterns;
4) investigating the dependence of seed productivity and seed quality on environmental conditions, forest type, and tree position;
5) forecasting expected yields.
Depending on the research objectives, various assessment methods have been developed. Some methods allow for the determination of seed production in individual trees as well as entire forest communities.
All methods can be divided into two groups: visual methods and tally methods.
Visual methods. To estimate the magnitude of tree seed crops, a six-point scale has been developed (see Table 2). The advantages of this method lie in the rapid determination of yield size, making it possible to assess seed production over vast forest areas in a short period.
Tally methods are the most accurate, albeit labor-intensive.
A complete tally of fruits and cones on all trees within a sample plot is an extremely laborious and complex task; therefore, researchers typically rely on sampling methods limited to a small number of pre-selected trees known as model trees. Four to five trees with dimensions close to the average tree of the sample plot are chosen as models. N.S. Nesterov proposed a METHOD FOR DETERMINING the seed production of trees and shrubs using model branches. This method fulfills three objectives and consists of three parts: 1) determining the current year's seed production; 2) forecasting the expected yield volume; and 3) determining seed production for several past years based on scars or traces left on the branches by fallen fruits or cones. The Essence of the method is as follows: 1 to 5 branches, 40–70 cm in length, must be cut from 10–20 trees of the same species. Branch collection should be conducted evenly from all four sides of the crown. By counting the fruits, one can establish the average seed yield or the average number of fruits per linear meter of branch length. It is also possible to determine the percentage of fruitful shoots on the branches relative to the total number of young shoots.
The volume of Seed and Fruit yields is influenced by numerous factors. Among natural conditions, meteorological factors are of particular importance, with Temperature and humidity being The most significant. The presence of pests is also a substantial factor.
Seed production also depends on the vegetation itself. Different tree species begin producing seeds at varying ages depending on environmental conditions. For instance, an isolated birch tree begins to bear fruit at 10–15 years of age, whereas in closed stands, it does so only starting from 30 years.
A noticeable correlation exists between the magnitude of seed production, THE POSITION OF the tree within the stand, and the degree of crown development. The highest seed production is observed in trees of Kraft classes I and II, which account for up to 50% of the yield despite their small proportion in the forest (up to 10%); trees of class III, while occupying a predominant position in the forest in terms of stem count, also yield about 50% of the crop; whereas trees of classes IV and V exhibit negligible seed production, sometimes dropping below 1%.
The quantity of fruits and cones is distributed unevenly throughout the crown, with a noticeable predominance in the better-illuminated sectors of the crown.
4.2 Determining Expected Seed Production Based on the Number of Generative Buds
Under favorable environmental conditions, significant Development of the tree's foliage mass drives intensive Photosynthesis and robust Water-mineral Nutrition. This ensures the accumulation of assimilates within the tree, promoting the initiation and development of generative buds on its branches. Conversely, whenever photosynthesis declines and the plant's carbohydrate balance is disrupted, fewer generative buds are formed, and primarily vegetative buds develop on the branches. Thus, depending on the level of assimilate accumulation within the tree's crown, varying quantities of generative buds are formed, which will develop into fruits the following year.
The magnitude of a tree's seed productivity is periodic. A year of abundant yield is followed by one, and sometimes 2 to 3 years, of reduced yield, during which vegetative buds are primarily formed.
Forecasting the seed crop of tree species based on the number of generative buds requires an understanding of the developmental patterns and distribution of both vegetative and generative buds within the tree crown. In A number of deciduous species, generative buds differ in size and shape from vegetative ones even in the autumn period, shortly after their formation. In late winter to early spring, when growth processes take place, generative buds begin to clearly stand out from vegetative ones in size and shape. On a sample plot, a certain number of branches (5-10) are collected from individual model trees (10 specimens). A complete count of all vegetative and generative buds is performed. The generative bud Abundance coefficient is determined, i.e., the ratio of the number of generative buds to the number of vegetative buds on annual shoots of the upper crown (Table 6).
Table 6. Generative bud abundance coefficient in downy birch under the conditions of Perm (2016)
Model shoots |
Item No. |
Total number of buds per shoot |
Number of vegetative buds |
Number of generative buds |
Generative bud abundance coefficient |
Elongated vegetative |
1 |
26 |
26 |
0 |
0 |
2 |
34 |
34 |
0 |
0 |
|
3 |
40 |
40 |
0 |
0 |
|
4 |
28 |
28 |
0 |
0 |
|
5 |
20 |
20 |
0 |
0 |
|
Elongated generative |
1 |
28 |
20 |
8 |
0,29 |
2 |
56 |
41 |
15 |
0,27 |
|
3 |
26 |
22 |
4 |
0,15 |
|
4 |
29 |
17 |
12 |
0,41 |
|
5 |
24 |
18 |
6 |
0,30 |
|
Shortened vegetative |
1 |
12 |
12 |
0 |
0 |
2 |
13 |
13 |
0 |
0 |
|
3 |
15 |
15 |
0 |
0 |
|
4 |
18 |
18 |
0 |
0 |
|
5 |
10 |
10 |
0 |
0 |
|
Shortened generative |
1 |
11 |
8 |
3 |
0,27 |
2 |
18 |
14 |
4 |
0,22 |
|
3 |
20 |
14 |
6 |
0,30 |
|
4 |
15 |
10 |
5 |
0,30 |
|
5 |
12 |
9 |
3 |
0,25 |
It is important to determine the boundaries of annual shoots by the remnants of terminal bud scales, or, after they have fallen off, by the scars or marks at their attachment sites. In addition, at the junctions of annual shoots, a number of species have slight thickenings at their very ends (just below the terminal bud), where a whorl of lateral branchlets is located (Fig. 29).
Fig. 29. Branches of Maack's bird cherry: 1 - terminal annual shoots

Based on these features, it is possible to delineate the annual growth increments over the last 6–8–10 years. In coniferous tree species, annual shoots on branches can also be distinguished by the whorled arrangement of branchlets.
I.I. Rats suggests evaluating the degree of fruiting abundance per meter of branch.
According to J. Allen's observations, a generative bud abundance coefficient of 0.25 for Douglas fir predicts a very good crop. According to P.L. Gorchakovsky, it is more convenient to forecast the yield of conifers based on the abundance of male generative buds. Prior to a seed year, they are present on all annual shoots, reaching a count of 18-20 per shoot.
After a quantitative assessment of a single tree's seed productivity has been carried out, Laboratory studies are performed to determine seed quality. It is necessary to separate diseased, damaged, and empty seeds, and to determine the number and weight of healthy seeds, as well as the percentage of diseased and empty ones. Healthy seeds are then subjected to further laboratory testing to determine germination percentage, germination energy, and seed dormancy period, which characterize seed quality.
Last update: 07/08/2026
Editorial and Educational Adaptation: This material has been compiled based on the primary/original source text. The project team performed an editorial review, corrected technical inaccuracies, structured sections, and adapted the content for an educational format.
What was processed:
- elimination of formatting defects (OCR errors, structural breaks, corrupted characters);
- editorial organization of content;
- standardization of terminology in accordance with academic sources;
- verification of factual statements against the original source text.
All mentions of the author, publication year, and origin of the primary text have been preserved in accordance with the source.