Protein Chemistry - Part 1 - General Protein Chemistry - Ashmarin I. P. 1968
Protein Electrochemistry. Interaction of Proteins with Water
Protein Electrophoresis in Liquid Medium. Moving Boundary Method
Electrophoretic Separation of Proteins in an aqueous medium relies on the capacity of their charged particles to move relative to the solvent under METABOLISM/18.html">The Influence of an external electric field. If the hydrogen ion concentration in the solvent differs from the isoelectric point, the particle migration velocity depends on the magnitude of its net charge, size, and shape. Because even closely related proteins—such as certain serum albumin fractions—exhibit distinct electrophoretic mobilities, and because these mobilities change differently with variations in pH and buffer composition, Electrophoresis can be successfully applied to resolve protein mixtures and characterize individual proteins.
Although electrophoresis has been known since the second half of the 19th century, precise measurements on pure proteins only became feasible after Tiselius developed an advanced apparatus for electrophoretic analysis using the moving-boundary method. In this device, the electrophoretic Cell was housed in a low-Temperature thermostat, which permitted The Use of high potential gradients for protein separation while preventing thermal convection. The Cell itself featured a rectangular cross-section, optical surfaces, and segments capable of sliding relative to one another. This design enabled The formation of sharp boundaries between the protein and Buffer solutions and allowed Changes in the refractive index within the moving boundary zones to be monitored using a schlieren optical system based on the Foucault-Toepler principle.
Liquid-medium Protein Electrophoresis offers both Advantages and disadvantages compared to electrophoresis on neutral Supports. This method is indispensable for quantitatively determining the electrophoretic mobility and isoelectric point of proteins, estimating their molecular radius, and assessing the completeness of Protein Purification. It is also widely used to study enzymatic Protein Cleavage and Structure/156.html">Protein Interactions with various ions. A further advantage is that the boundaries and the resolution of individual fractions can be observed directly throughout the experiment. However, the drawbacks include the inability to isolate individual fractions from the cell, contamination of intermediate fractions by adjacent ones, and the high cost and complexity of the equipment. Consequently, the moving-boundary method is primarily analytical.
Before discussing certain principles of liquid-medium protein electrophoresis, it is necessary to briefly outline the design of the electrophoretic cell and the registration of refractive index changes using the schlieren optical system.
The Tiselius cell is a U-shaped tube with a rectangular cross-section, divided into three sections that slide relative to one another. This configuration allows sharp boundaries to be established between the protein and buffer solutions in the upper part of the left limb and the lower part of the right limb, which are then recorded by the appropriate optical system.
Recall that when light passes from one medium into another with a different refractive index, the direction of the ray changes. This directional change occurs abruptly when the refractive index at the boundary changes discontinuously, as in the case of two immiscible liquids. Conversely, when a ray traverses a diffuse boundary between two miscible liquids (protein and buffer solutions), the refractive index changes gradually. This results in continuous light refraction, or bending. This gradual alteration of the refractive index is termed the refractive index gradient, or the refraction gradient. Practically, the crucial point is that the bending of the ray caused by the refraction gradient results in a greater deflection than simple refraction alone.
The refractive index gradient is proportional to the concentration gradient (dc/dx) and reaches its maximum at the midpoint of the boundary zone between the protein and buffer solutions—precisely where the ideal boundary should lie. On both sides of this boundary, the magnitude of the refraction gradient decreases, yielding a peak-shaped curve.
The detection and recording of the refraction gradient curve are accomplished using schlieren optical systems based on the Foucault-Toepler principle. One such system—featuring an inclined slit and a cylindrical lens—is illustrated in Fig. 45. Known variously as the crossed-Diaphragm system, the Philpot-Svensson system, or simply the schlieren system, it is widely utilized to record protein solution-solvent boundaries not only in electrophoresis but also in ultracentrifugation.
The solution in the vertical U-shaped cell 1 is illuminated by a horizontal beam of light. The light beam passes through the solution, then through the inclined slit 2 of the second screen and a cylindrical lens 3 with a vertically oriented axis, and finally strikes the ground-Glass screen 4 of the camera. The cylindrical lens focuses the light beam onto the ground-glass screen; while it does not alter the vertical coordinate H of a point in the cell image, in combination with the inclined slit, it can displace the point along the transverse axis N. If no boundary is present in the solution within the cell (layer h0), the narrow light beam passing through the inclined slit at point Y0 undergoes no horizontal deflection and produces a narrow vertical strip of light N0 on the screen, representing the baseline. When a boundary is present, light passing through the layer hm with the maximum refraction gradient is deflected downward to Ym; upon passing through the inclined slit, it is displaced horizontally to the left by the cylindrical lens, forming the peak Nm. Rays passing through cell layers hn with lower refractive indices are deflected downward to Yn accordingly, generating the flanks of the peak. As a result, the entire refractive index gradient curve becomes visible on the screen.
Class="center">
Fig. 45. Schematic diagram of The Optical System with an inclined slit and a cylindrical lens (from Neurath and Bailey, 1956). Explanations are given in the text.
During electrophoresis, the migration of the protein mixture and its resolution into individual components lead not only to the Displacement of the protein solution-solvent boundary but also to the formation of new boundary zones between individual protein fractions. Accordingly, these boundary zones appear on the ground-glass screen as new refractive index gradient peaks. Thus, the moving-boundary method records not the protein fractions themselves, but the boundary zones between them, as well as between the terminal protein fractions and the solvent, with the number of refraction gradient peaks corresponding exactly to the number of protein fractions. An example of such a refractive index gradient curve for Serum proteins is shown in Fig. 46.
Because the protein mixture is initially loaded only into the lower and middle sections of one cell compartment, electrophoresis results in a downward migration of the protein-solvent boundary in one limb of the cell and an upward migration in the other.
This yields two diagrams that are vertically symmetrical and correspond to the descending and ascending boundaries. Typically, photographs are taken of the descending boundary only.
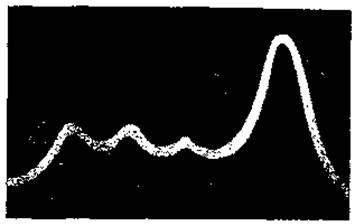
Fig. 46. Electrophoretic pattern of serum proteins (from Haurowitz, 1965).
Let us now turn to electrophoretic mobility, defined as the migration velocity of a particle under a unit electric field strength. First, let us consider the movement of a spherical protein molecule in Water. Driven by the electric field, particles accelerate until the viscous drag of the medium and the electrostatic force balance each other. The particle then attains a constant migration velocity, which, according to Stokes' law, is given by:

where Q is the net charge of the particle, E is the electric field strength, and k is the particle radius.
Determining the radius of a hydrated particle is extremely difficult. However, this parameter can be eliminated by introducing THE CONCEPT OF the potential at The surface of a spherical particle (electrokinetic potential, or zeta potential). The zeta potential represents the total potential difference between the particle surface and the bulk of the solution, and can be determined from the following equation:

where ε is the Dielectric Constant of the medium. Substituting the value of k into equation (58) allows the electrophoretic mobility to be determined:

However, a protein molecule moves not in pure water, but in an electrolyte solution whose ions exert a specific influence on particle motion. A charged molecule attracts ions of opposite sign, which form a spherical ionic atmosphere around it carrying an equivalent and opposite charge. Because this ionic atmosphere tends to move in a direction opposite to that of the protein molecule, the migration velocity of the latter in the electric field is reduced. According to the Debye-Hückel theory, the thickness of this spherical ionic atmosphere is equal to:

where μ is the Ionic strength. It is evident that the thickness of the shell is inversely proportional to the ionic strength of the buffer solution. As a result of the ionic shell, the ζ-potential of a protein ion decreases by an amount equal to its surface potential. Since the radius of the hollow sphere is r+1/x, the potential at its surface is Qλ/ε∙(1+rx). Consequently, the ζ-potential of the protein ion will be:

Substituting the value of ζ into equation (60) makes it possible to determine the mobility of protein particles in the electrolyte. Clearly, the mobility of the protein decreases as a consequence of the reduction in the ζ-potential of its particle. Since the above equations are valid only for small spherical molecules, a correction factor f(rx), which ranges from 1 to 1.5, is introduced into the formula for the ζ-potential and mobility of protein particles:

However, neither the charge and radius of a molecule nor the ζ-potential can be obtained directly from experiment. All of these characteristics of a protein molecule can only be calculated based on the electrophoretic mobility, which is determined experimentally. The mobility of a charged particle can be expressed using the following formula:

The velocity is determined by measuring the distance dx traveled by the boundary between the protein and the buffer per unit time, and the field strength is calculated according to Ohm's law:

where J is the current in amperes, A is the cross-sectional area of the cell in cm2, and σp is the specific electrical conductivity of the protein solution, which is determined experimentally and equals

Here C is the cell constant and Rp is the resistance of the protein solution. Hence,

Substituting these values into equation (64), we obtain

All of these quantities can be measured directly in an experiment. Mobility has the same sign as the net charge of the protein molecule; that is, if the protein boundary moves toward the cathode, the mobility is positive, and if the boundary moves toward the anode, it is negative. Thus, determining the mobility of a protein molecule using formulas (60)–(64) makes it possible to calculate not only its charge and radius, but also its ζ-potential. Moreover, measuring mobility at various pH values allows us to determine the isoelectric point of the protein. Recall that the isoelectric point of a protein is defined as the pH value at which its mobility is zero and the protein molecule possesses an equal number of positive and negative charges.
In Conclusion, it should be noted that the moving boundary method also makes it possible to determine The ratio of individual protein fractions in a mixture. Since the area of the refractive gradient peak is proportional to the protein concentration, by taking the sum of the areas of all peaks as 100, we can easily calculate the percentage ratio of the individual fractions.
Last update: 06/08/2026
Editorial and Educational Adaptation: This material has been compiled based on the primary/original source text. The project team performed an editorial review, corrected technical inaccuracies, structured sections, and adapted the content for an educational format.
What was processed:
- elimination of formatting defects (OCR errors, structural breaks, corrupted characters);
- editorial organization of content;
- standardization of terminology in accordance with academic sources;
- verification of factual statements against the original source text.
All mentions of the author, publication year, and origin of the primary text have been preserved in accordance with the source.