Protein Chemistry - Part 1 - General Protein Chemistry - Ashmarin I. P. 1968
Protein Electrochemistry. Interaction of Proteins with Water
Dielectric Constants of Proteins, Relaxation Time, and Protein Molecular Shape
Proteins, Amino Acids, and Peptides contain positively and negatively charged groups that are unevenly distributed across The surface of the protein particle, giving the entire molecule a strongly pronounced polar character. Therefore, all these substances exhibit high dielectric constant values.* Since neither amino acids nor Proteins can be obtained in a liquid state (the melting points of these substances exceed their decomposition temperatures), it is impossible to measure this value directly. However, the dielectric constant can be determined by measuring the capacitance of a capacitor with a protein or amino acid solution placed between its plates. Capacitance is known to be directly proportional to the Dielectric Constant of the dielectric and the area of the plates, and inversely proportional to the distance between them:
Class="center">
* The force of interaction between two electrical charges in a given medium is F = q1q2/εr2, where q is the magnitude of the charges, r is the distance between them, and ε is the dielectric constant of the medium. For interactions in a vacuum, this value is equal to 1. Consequently, ε indicates how many times weaker the interaction force between charges is in a given medium compared to a vacuum. The dielectric constant has high values for polar molecules and low values for nonpolar ones (for example, for Water at 20° it is 80, whereas for paraffin it is 2).
The dielectric constants of PROTEIN AND AMINO acid solutions are always higher than the dielectric constant of the pure solvent, even when water is used as the solvent. Furthermore, this increase in the dielectric constant is proportional to the concentration of the dissolved substance:

where ε0 is the dielectric constant of water, C is the molar concentration of the protein (amino acid), and δm is the molar increment of the dielectric constant. The latter value is a function of the polarity of the solute, and for amino acids it is approximately directly proportional to the number of atoms in the chain separating the polar groups. For α-amino acids, δm values range from 22 to 28, while for tripeptides to hexapeptides they lie within 70–234.
Since protein concentration is conventionally expressed in g/L, the molar increments δm for them are replaced by dielectric increments calculated per 1 g:

where c is the protein concentration in g/L. The determined δG values for proteins and α-amino acids turned out to be of the same order of magnitude. To understand this unexpected correspondence, one must examine the dipole moments of these substances, since the magnitude of the dielectric increment is directly related to them.
The distance between the NH3 and COO- groups in α-amino acids is approximately 3 Å, and the electron charge is roughly 4.8∙10-10 electrostatic units. From this, the dipole moment can be determined as 14.4∙10-10 electrostatic units, or 14.4 Debye units. Since the distance between polar groups is nearly identical in all amino acids, it is not surprising that they all exhibit a dielectric increment of the same order of magnitude, given that the increase in the dielectric constant is proportional to the dipole moment.
In protein molecules, only a small number of amino acids contain free positive and negative groups. Such groups may include terminal amino and carboxyl groups as well as a certain number of ionic groups in the side chains. It follows that the number of charges per 1 g of protein should be several times smaller than the number of charges per 1 g of the corresponding amino acid mixture. However, since the increase in the dielectric constant of water caused by dissolving proteins differs only slightly from the increase caused by dissolving amino acids, it must be acknowledged that the distance between charged groups in proteins is significantly greater than in amino acids. The calculated dipole moments for protein molecules range from 170 to 730 Debyes, which is considerably higher than those for ordinary polar molecules. Nevertheless, they are very small compared to the maximum possible dipole moments that these proteins would exhibit if all positive groups were concentrated near one end of the molecule and all negative groups at the other. It can be concluded that the dipole moment values found for proteins indicate a fairly uniform distribution of positive and negative charges on the molecular surface.
The dielectric constant of a protein solution varies significantly with changes in solution pH, reaching a maximum at the isoelectric point—that is, when The ionization of carboxyl and amine groups is maximal. At the same time, the dielectric constant also depends on the field frequency. By using fields of varying frequencies to determine the dielectric constant, one can gain insight into the axial ratio of the protein molecule.
Let us clarify this point. As already mentioned, the dielectric constant of a solution is typically measured by determining the capacitance of a capacitor containing the medium between its plates. An electric field applied perpendicularly to the plates causes the molecules to orient themselves, thereby increasing the capacitor's capacitance. If orientation occurs in a constant field or an alternating field of very low frequency, the time required for dipole orientation in the electric field does not affect the measured dielectric constant. However, if the field direction changes rapidly, the protein molecules will not have enough time to reposition themselves—that is, reorientation will lag noticeably behind the field changes. At even higher frequencies, the molecules will fail to keep pace with the changing field direction altogether and will thus be unable to contribute to the increase in the solution's dielectric constant. Consequently, if the frequency of the applied field increases gradually, a region can be found within which the dielectric constant drops from its static value ε1 to a lower value ε2. The latter value represents the dielectric constant measured at such a high frequency that the solute dipoles can no longer keep up with the field variations at all. A schematic diagram showing the variation of the dielectric constant as a function of field frequency for solutions of small (amino acids) and large (proteins) molecules is presented in Fig. 47.
As seen in the diagram, at a field frequency of 107 Hz and above, proteins no longer increase the dielectric constant of the solution, whereas for small amino acid molecules this value corresponds to 1010 Hz. This is quite understandable, as orienting small molecules requires relatively little time. The time required for molecular orientation is called the relaxation time and is denoted by the letter τ. For a water molecule it is 10-11 s, for amino acid molecules 10-10 s, and for proteins 10-6–10-7 s. Knowing the critical frequency corresponding to the relaxation time, the latter can be calculated using the formula.

where ν is the field frequency.
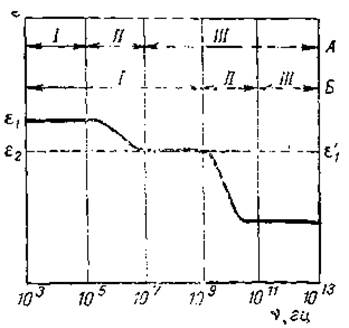
Fig. 47. Schematic diagram of the relationship between the dielectric constant of solutions of large (A) and small (B) molecules and field frequency (from Neurath and Bailey, 1956):
I — maximum orientation, II — partial orientation, III — absence of orientation.
The relaxation time τ is closely related to the rotational diffusion coefficient θ, the volume V, and the molecular radius r. Thus, for a spherical molecule, these relationships can be expressed by the following equations:
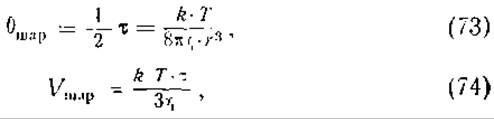
where η is the viscosity of the solution. If the particle is an ellipsoid of revolution, two values for the relaxation time must be found. One value corresponds to the rotation time around the major axis, and the other around the minor axis. By determining these values, the axial ratio a/b can be estimated. The a/b values found by this method (without accounting for Hydration) for various proteins proved to be much higher than those obtained by other Methods. It follows that the dielectric increment of proteins cannot be explained solely by the high permanent dipole moment of protein molecules.
The high values of the protein dielectric increment become understandable when one considers the binding of water molecules by proteins, as well as the presence of so-called induced dipoles. It is known, for example, that the dielectric increment of fibrous protein solutions in resting and oriented states is identical. On the other hand, when a dry preparation is placed in a water vapor atmosphere with increasing vapor pressure, its dielectric constant increases with The amount of bound water. A comparison of these data suggests that the increase in the water dielectric constant upon protein addition is apparently also due to the proper orientation of the bound water molecules. At the same time, it is known that for most molecules composed of two Different types of atoms, the centers of gravity of positive and negative charges do not coincide. This effect, which was already discussed in connection with Hydrogen bond formation (see Chapter V), arises due to the partially ionic character of most covalent bonds. The partially ionic character of these bonds becomes clear when considering that electronegative atoms (O, N) are capable of drawing the electron cloud away from not only hydrogen atoms but also carbon atoms. As a result, an uneven charge distribution occurs between bonded atoms, which can be enhanced in an electric field due to a further displacement of electrons toward the external positive pole. Such a bonded atom pair becomes an induced dipole, the magnitude of whose moment depends on the absolute value of the charges and the distance between the atoms. These induced dipole moments are incorporated into the total dipole moment of the protein molecule, increasing it. Thus, the total dipole moment of a protein molecule includes not only the permanent dipole moment, but also the induced dipole moments, as well as the moments of bound and oriented water molecules.
Last update: 06/08/2026
Editorial and Educational Adaptation: This material has been compiled based on the primary/original source text. The project team performed an editorial review, corrected technical inaccuracies, structured sections, and adapted the content for an educational format.
What was processed:
- elimination of formatting defects (OCR errors, structural breaks, corrupted characters);
- editorial organization of content;
- standardization of terminology in accordance with academic sources;
- verification of factual statements against the original source text.
All mentions of the author, publication year, and origin of the primary text have been preserved in accordance with the source.