BIOCHEMISTRY - L. Stryer - 1984
VOLUME 1
PART I. CONFORMATION AND DYNAMICS
CHAPTER 6. INTRODUCTION TO ENZYMOLOGY
6.17. The Concerted Model of Allosteric Interactions
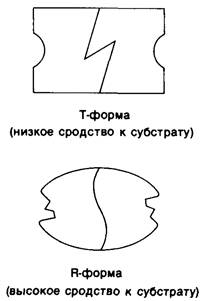
An elegant and concise model for The kinetics of allosteric Enzymes was proposed in 1965 by Jacques Monod, Jeffries Wyman, and Jean-Pierre Changeux (Monod, J., Wyman, J., & Changeux, J.-P.). Using their approach, let us consider an allosteric enzyme consisting of two identical subunits, each with a single Active Site. Assume that the subunits can exist in two Conformations, R and T. The R (relaxed) conformation has a high affinity for the substrate, whereas the T (tense) conformation has a low affinity (Fig. 6.20). Recall that The quaternary Structure of Hemoglobin was similarly designated by two forms (Section 4.10). The R and T forms are interconvertible. A key assumption of this model is that, to preserve the Symmetry of the dimer, both subunits must remain in the same conformational state. Thus, the RR and TT states are permitted, whereas the RT state is forbidden. The symbols R0 and T0 denote the permitted states in the absence of substrate, and L represents The ratio of their concentrations:
Ro ⇄ To, (27)
L = T0/R0. (28)
To simplify the Discussion, let us assume that the substrate does not bind to the T form of the enzyme. In the R form, the dimer can bind one or two substrate molecules; these states are designated as R1 and R2, respectively:
R0+S ⇄ R1, (29)
R1+S ⇄ R2, (30)
Class="center">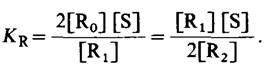 (31)
(31)
According to this equation, the binding of both the first and the second substrate molecule to the R form of the dimeric enzyme shares the same microscopic dissociation constant KR. The coefficient 2 in equation (31) indicates that the substrate can bind to either of the two active sites on R0 to form R1, and, similarly, the substrate can dissociate from either active site on R2 to form R1.
Fig. 6.20. Schematic representation of the R and T forms of an allosteric enzyme
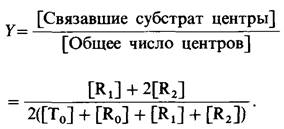
Let us express the fractional saturation Y (i.e., the proportion of active sites with bound substrate) as a function of Substrate Concentration
 (32)
(32)
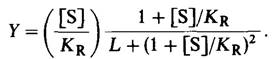
By making substitutions in this equation according to equations (27) and (31), we obtain the desired expression for Y:
 (33)
(33)
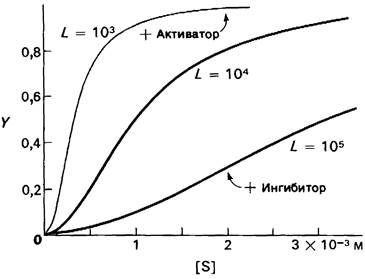
Let us plot equation (33) graphically, assuming KR=10-5 M and L= 104. The dependence of Y on [S] is expressed by a sigmoid rather than a hyperbolic curve (Fig. 6.23). In other words, this equation corresponds to cooperative substrate binding. If the turnover number per active site is identical for the R1 and R2 enzyme-substrate complexes, the plot of reaction velocity versus substrate concentration will also be sigmoidal, since
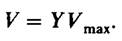 (34)
(34)
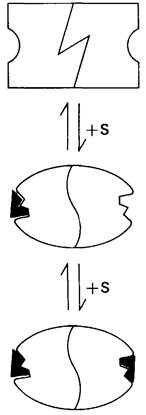
Let us now examine this binding process (Fig. 6.21). In the absence of substrate, virtually all enzyme molecules are in the T form. In the example above, for every 104 molecules in the T form, there is only one molecule in the R form. The addition of substrate shifts the conformational equilibrium toward The formation of the R form, because it is the R form that binds the substrate. When the substrate binds to one active site, the second active site must also be in the R form, According to the fundamental postulate of this model. In other words, all enzyme subunits undergo the transition from T to R and back in a concerted manner. Consequently, as substrate is added, the fraction of enzyme molecules in the R form progressively increases, and substrate binding occurs cooperatively. Upon complete saturation of the active sites, all enzyme molecules are in the R form.
Fig. 6.21. Model of the concerted mechanism of cooperative substrate binding by an allosteric enzyme. The binding of the first substrate molecule is accompanied by the transition of the low-affinity TT form into the high-affinity RR form
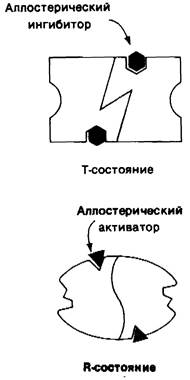
The concerted-mechanism model easily accounts for the effects of allosteric inhibitors and activators. An allosteric inhibitor binds preferentially to the T form, whereas an allosteric activator binds preferentially to the R form (Fig. 6.22). Consequently, an allosteric inhibitor shifts the conformational equilibrium R ⇄ T toward T, whereas an allosteric activator shifts it toward R. These effects can be quantified through The change in the allosteric Equilibrium Constant, which enters equation (33) as a variable. An allosteric inhibitor increases the value of L, whereas an allosteric activator decreases it. These effects are illustrated in Fig. 6.23, where Y is plotted against [S] for the following values of L: 103 (in the presence of an activator), 104 (in the absence of both activator and inhibitor), and 105 (in the presence of an inhibitor). The fractional saturation γ at all [S] values decreases in the presence of an inhibitor and increases in the presence of an activator.
Fig. 6.22. According to the concerted model, an allosteric inhibitor (shown as a hexagon) stabilizes the T state, whereas an allosteric activator (shown as a triangle) stabilizes the R state
It is useful to dwell here on two additional concepts: homotropic effects, which are allosteric interactions between identical ligands (bound molecules or ions), and heterotropic effects, i.e., interactions between different ligands. In the example considered above, the Cooperative binding of the substrate by the enzyme represents a homotropic effect. In contrast, METABOLISM/18.html">The Influence of an activator or inhibitor on substrate binding is heterotropic, since the interaction in this case occurs between molecules of different types. In the concerted model of allosteric interactions, homotropic effects are always positive (cooperative), whereas heterotropic effects can be either positive or negative.
Fig. 6.23. Fractional saturation γ as a function of substrate concentration [S] according to the concerted model [equation (33)]. The effects of an allosteric inhibitor and activator are also shown
Last update: 06/08/2026
Editorial and Educational Adaptation: This material has been compiled based on the primary/original source text. The project team performed an editorial review, corrected technical inaccuracies, structured sections, and adapted the content for an educational format.
What was processed:
- elimination of formatting defects (OCR errors, structural breaks, corrupted characters);
- editorial organization of content;
- standardization of terminology in accordance with academic sources;
- verification of factual statements against the original source text.
All mentions of the author, publication year, and origin of the primary text have been preserved in accordance with the source.