Fundamentals of Bioinformatics - Ogurtsov A.N. 2013
Methods of Bioinformatic Analysis
Sequence Alignment Algorithms
Significance of Alignments
To assess the Biological Significance of aligning a given sequence with other sequences from Databases, the standard approach is to compare the obtained results with those of aligning the given sequence against sequences generated through statistically random permutations (randomization) of elements within the database sequences.
Obviously, if randomized (random) sequences yield the same outcome as the original ones, the alignment most likely lacks biological meaning.
To evaluate alignment significance, statistical parameters such as Z-score, P-value, and E-value are commonly used.
The Z-score indicates how unusual the discovered match is; in statistical terms, it represents the distance (measured as the standard deviation) of a given score from the mean value of a dataset. If the score of the initial alignment between a given sequence and another sequence is S, then
Class="center">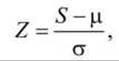
where μ is the mean alignment score of the given sequence with randomized Variants of the second sequence, and σ is the standard deviation.
When Z = 0 for two protein sequences, these Proteins resemble each other no more strongly than (on average) proteins from a control group used for comparison—an outcome that, incidentally, could easily occur by chance. The higher the Z-score, the greater the probability that the observed alignment is non-random. Experience shows that a Z-score > 5 already indicates The Significance of the initial alignment.
P-value. Many programs output P-values, which represent the probability that an alignment is no better than random. The relationship between the Z-score and P depends on the distribution of control alignment scores, which does not correspond to a normal distribution.
Roughly speaking, P-value ranges can be interpreted as follows:
|
P ≤ 10-100 |
exact match; |
|
10-100 < Р < 10-50 |
sequences are nearly identical, e.g., alleles or polymorphisms; |
|
10-50 < Р < 10-10 |
closely related sequences; Homology is obvious; |
|
10-10 < Р < 10-1 |
typically distantly related sequences; |
|
Р > 10-1 |
the match is likely insignificant. |
E-value. Database search programs, including PSI-BLAST, report the E-value.
The E-value of an alignment is the expected number of sequences that would have a Z-score equal to or better than the observed one if the program were queried with a random sequence.
Roughly speaking, E-value ranges can be interpreted as follows:
|
Е < 0,02 |
sequences are likely homologs; |
|
0,02 < Е < 1 |
homology is not obvious; |
|
Е > 1 |
the match is expected to be a chance occurrence. |
It should be noted that statistical evaluations are useful and necessary, but they cannot replace common sense and a thorough, careful Analysis of the biological validity of the results.
There are numerous empirical rules for interpreting the percentage of identical amino acid residues in an optimal protein sequence alignment.
If two proteins share more than 45% identical residues in their optimal alignment, there is every reason to assume that these proteins have similar structures and, most likely, a common or at least similar function.
If they contain more than 25% identical residues, they likely share a similar fold.
On the other hand, a low degree of sequence similarity does not rule out the possibility of homology.
Russell F. Doolittle defined the 18–25% sequence similarity range as the twilight zone (or ambiguity zone), where the assumption of homology can only be stated as a hypothesis. Pairwise alignments falling below this range are largely uninformative.
At the same time, the absence of significant sequence similarity does not mean the absence of structural similarity at all.
For example, the Amino acid sequences of homologous DNA sliding clamps from Yeast (protein 1plq) and E. coli (protein 2po1) share only 12% similarity, yet they are nearly identical in Structure and function (Figure 58).

Figure 58 - DNA sliding clamps: a - yeast protein 1plq; b - Escherichia coli protein 2po1
Although the twilight zone is unreliable for drawing Conclusions, assessing the alignment "texture" (profiles) is also important for resolving true evolutionary relationships—specifically, whether these similar residues are isolated and distributed throughout the sequence or whether they form "icebergs," which are local patches of high similarity (another Doolittle term) that may correspond to a shared Active Site. It is also helpful to use supplementary information regarding common ligands or Functions. If three-dimensional structures are known, we can test their similarity directly.
Empirical rules are guidelines rather than strict laws. Let us consider a few more characteristic Examples.
Sperm whale Myoglobin and lupine leghaemoglobin share 15% identical residues in an optimal alignment. This is also below the twilight zone of ambiguity defined by Doolittle. However, it is known that both molecules share similar three-dimensional structures, contain heme prosthetic groups, and bind oxygen. They are indeed distant homologs.
The sequences of the N- and C-terminal domains within the same rhodanese protein share 11% identical residues in an optimal alignment. If they originated from different proteins, their relationship could not be inferred from sequences alone. However, such a situation within a single protein suggests that they arose via Gene Duplication and divergence. The obvious structural similarity confirms their relationship.
Two proteases, Chymotrypsin and subtilisin, share 12% sequence identity. These Serine proteases perform a similar function, and their active site is formed by three characteristic residues. Nevertheless, they have different spatial folds and are unrelated (Figure 59).
The similarity of their catalytic functions is an example of convergent evolution. Therefore, one should not assume a evolutionary relationship between proteins with dissimilar sequences based solely on functional similarity.
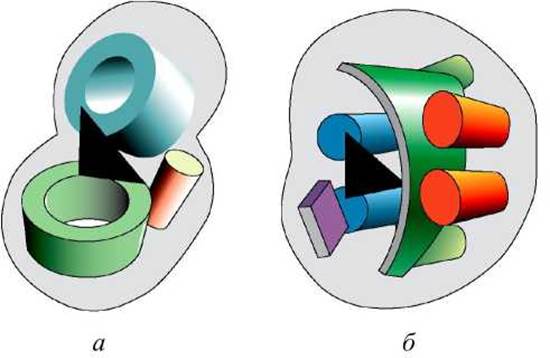
Figure 59 - Cytology/cytology/92.html">SCHEMATIC STRUCTURE OF serine proteases: a - Trypsin type; b - subtilisin type. Alpha-helices, beta-sheets, and Beta-barrels are shown schematically. The active site region is indicated by a black triangle
METABOLISM/35.html">Selection/41.html">Review Questions and Exercises
1. What are the Limitations of the dynamic programming method?
2. How is computation time reduced in the dynamic programming method?
3. What is the difference between the Needleman-Wunsch and Smith-Waterman Methods?
4. What is the algorithm for filling the Cells F(i,j) of the dynamic programming matrix?
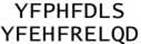
5. Using the BLOSUM62 amino acid substitution matrix and a fixed gap penalty d = 8, construct a global alignment of the two fragments using the Needleman-Wunsch method (and calculate its score (weight))
6. What are the two main differences between the Local Alignment Algorithm and the Global Alignment Algorithm?
7. WHAT IS A k-tuple?
8. What three statistical parameters are used to evaluate alignment significance?
Last update: 11/08/2026
Editorial and Educational Adaptation: This material has been compiled based on the primary/original source text. The project team performed an editorial review, corrected technical inaccuracies, structured sections, and adapted the content for an educational format.
What was processed:
- elimination of formatting defects (OCR errors, structural breaks, corrupted characters);
- editorial organization of content;
- standardization of terminology in accordance with academic sources;
- verification of factual statements against the original source text.
All mentions of the author, publication year, and origin of the primary text have been preserved in accordance with the source.