Human Biochemistry, Volume 1 - Murray R. 1993
Structure and Functions of Proteins and Enzymes
Enzymes: Kinetics
Limitations of the Michaelis-Menten Equation
Some Enzymes and other Ligand-binding Proteins, such as Hemoglobin (see chapters 6 and 10), do not obey classical Michaelis—Menten saturation kinetics. In this case, the plot of v versus [S] is sigmoidal in shape (Fig. 8.17). This usually indicates cooperative substrate binding by multiple sites—binding to one site affects binding to another, as is the case with hemoglobin (chapter 6).
Class="center">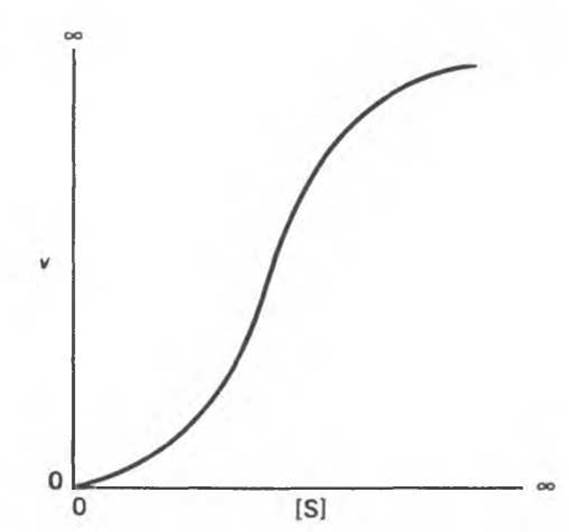
Fig. 8.17. Sigmoidal saturation kinetic curve.
In this case, the graphical method described above for estimating the Substrate Concentration at which the reaction rate is half-maximal becomes inapplicable (the corresponding coordinate plot no longer yields a straight line). Instead, one should turn to the graphical representation of the Hill equation, originally proposed to describe the Cooperative binding of O2 to hemoglobin (chapter 6). The Hill equation, transformed so that the plot in the appropriate coordinates is a straight line, has the form

where k' is a constant. It follows from the equation that under conditions where [S] is small compared to k', the reaction rate increases as the n-th power of [S]. Fig. 8.18 shows a Hill plot constructed from kinetic data for an enzyme characterized by cooperative substrate binding. The plot of log (v/Vmax — v) versus log [S] is a straight line with a slope equal to n, where n is an empirical parameter depending on the number of substrate-binding sites and The Nature of the interaction between them. When n = 1, the binding sites are independent of each other. When n > 1, there is cooperative interaction between the sites; the larger n is, the higher the degree of cooperativity and the more pronounced the sigmoidity of the saturation curves. When n < 1, it is referred to as negative cooperativity.
When the reaction rate is equal to half the maximum (v = Vmax/2), v/(Vmax—v) = 1 and log [v/(Vmax — v)] = 0. Thus, to determine the value of S50 (the substrate concentration at which the rate is half the maximum), one must drop a perpendicular from the point on the line where log [v/(Vmax—v)] = 0 onto the x-axis.
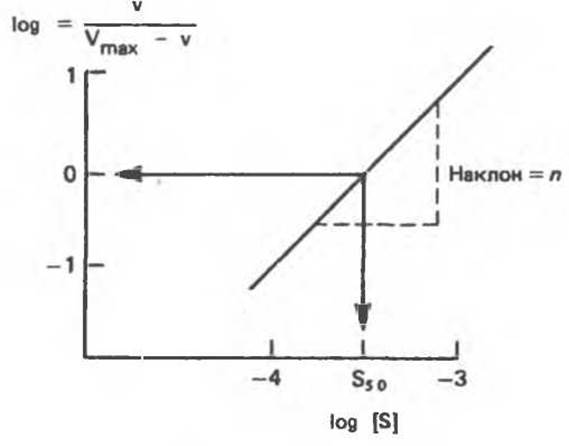
Fig. 8.18. Graphical METHOD FOR DETERMINING the substrate concentration at which the reaction rate is half-maximal from the Hill equation under conditions where the kinetic curve is sigmoidal in nature.
Last update: 06/08/2026
Editorial and Educational Adaptation: This material has been compiled based on the primary/original source text. The project team performed an editorial review, corrected technical inaccuracies, structured sections, and adapted the content for an educational format.
What was processed:
- elimination of formatting defects (OCR errors, structural breaks, corrupted characters);
- editorial organization of content;
- standardization of terminology in accordance with academic sources;
- verification of factual statements against the original source text.
All mentions of the author, publication year, and origin of the primary text have been preserved in accordance with the source.