BIOLOGY Volume 1 - A Guide to General Biology - 2004
7. AUTOTROPHIC NUTRITION
7.11. Practical Work
Experiment 7.1. Investigation of the Hill reaction
The Hill reaction
In 1939, working at Cambridge, Robert Hill discovered that isolated METABOLISM/14.html">Chloroplasts are capable of evolving oxygen in the presence of an oxidizing agent (an electron acceptor). This phenomenon became known as the Hill reaction. Certain chemical substances can substitute for the natural electron acceptor NADP. One such substance is the blue dye DCPIP (2,6-dichlorophenolindophenol), which becomes colorless upon reduction:
Class="center">
Isolation of chloroplasts
Materials and equipment
Leaves of spinach, lettuce, or cabbage
Scissors
Chilled mortar and pestle (or blender, or household food mixer)
Cheesecloth or nylon mesh
Filter funnel
Centrifuge and centrifuge tubes
Ice-salt Water bath
Glass stirring rod
Solutions (see notes)
0.05 M phosphate buffer, pH 7.0
Chloroplast isolation medium
DCPIP solution (reaction medium)
Chloroplasts can be isolated from minced leaves of spinach, lettuce, or cabbage using a chilled medium of suitable osmotic and Ionic strength and pH. Examples of such media include 0.4 M sucrose solution, 0.01 M KCl, and 0.05 M phosphate buffer at pH 7.0. To preserve the biochemical activity of the isolated samples, all solutions and glassware used must be pre-chilled. All Procedures should be carried out as rapidly as possible; therefore, the method and equipment should be carefully reviewed beforehand.
This method yields a sufficient quantity of chloroplasts for several groups of students to study, in cases where individual chloroplast isolation by each group is not feasible.
1. Cut up three small leaves of spinach, lettuce, or cabbage with scissors, discarding the major Veins and petioles. Place them into a cold mortar or blender beaker containing 20 ml of cold isolation medium (the amounts of minced leaves and medium may be scaled up proportionally).
2. Grind vigorously and quickly (grinding time about 10 s).
3. Place four layers of cheesecloth or nylon in a funnel and moisten them with cold isolation medium.
4. Filter the resulting homogenate through the funnel. Collect the filtrate in pre-chilled centrifuge tubes placed in an ice-salt water bath. Gather the edges of the cheesecloth together and squeeze thoroughly into the tubes.
5. Ensure that all tubes contain approximately the same volume of filtrate.
6. If your benchtop centrifuge has a single fixed speed, the centrifugation time should be 2–5 min (it is necessary to obtain a small pellet, but centrifugation time should be kept to a minimum). If the centrifuge speed is adjustable, centrifuge the filtrate for 1–2 min at 100–200 g. Centrifuge the supernatant for an additional 5 min at 1000–2000 g (this time is sufficient to yield a small pellet containing chloroplasts).
7. Discard the supernatant. Using a glass stirring rod, resuspend the pellet in one of the centrifuge tubes by adding about 2 mL of isolation medium. Transfer the resulting suspension into the second centrifuge tube and resuspend the pellet again. (If more than one student group is participating, add 2 mL of isolation medium to each centrifuge tube and use one tube per group.)
8. Keep the resulting chloroplast suspension in an ice-salt water bath and use it as quickly as possible.
Hill Reaction
The chloroplast suspension can now be used to study the Hill reaction. The DCPIP solution should be at room Temperature.
Prepare four test tubes containing the following:
1) 0.5 mL chloroplast suspension + 5 mL DCPIP solution. Leave the tube in bright light;
2) 0.5 mL isolation medium + 5 mL DCPIP solution. Leave the tube in bright light;
3) 0.5 mL chloroplast suspension + 5 mL DCPIP solution. Place the tube immediately in the dark;
4) 0.5 mL chloroplast suspension + 5 mL distilled water. This tube will serve as a color standard to show what the color of the suspension should be after DCPIP reduction.
After 20 min, record your observations.
If a colorimeter is available, the course of the reaction can be monitored by measuring the decrease in Light absorption by the dye, since it is blue in the oxidized form and colorless in the reduced form. In this case, samples 2 and 4 should be prepared directly in the colorimeter cuvettes. Insert a red (or yellow) filter and zero the colorimeter using suspension 4 as a control. Then place the cuvettes containing mixture 1 into the instrument, take the reading immediately, and return the sample to the bright light. Continue taking measurements every 30 s. Plot the reaction rate. When the reduction is complete, take measurements for sample 3. The reduction of the DCPIP dye itself can be evaluated by measuring sample 2 using the isolation medium as a standard, zeroing the instrument against the isolation medium solution as well. Ideally, complete reduction takes about 10 min.
Notes
Prepare the following solutions:
0.05 M phosphate buffer, pH 7.0
Na2HPO4 · 12Н2O 4.48 g (0.025 M)
КН2РO4 1.70 g (0.025 M)
Bring to 500 mL with distilled water and store the solution in a refrigerator at 0–4 °C.
Isolation medium
Sucrose 34.23 g (0.4 M)
КСl 0.19 g (0.01 M)
Dissolve in phosphate buffer at room temperature, make up to 250 ml. Store in a refrigerator at 0—4 °С.
DCPIP solution (reaction medium)
DCPIP 0.007–0.01 g (approximately 10-4 M)
KCl 0.93 g (0.05 M)
Dissolve in phosphate buffer at room temperature, make up to 250 ml. Store in a refrigerator at 0—4 °С. Use at room temperature.
(CAUTION: Potassium chloride acts as a cofactor in the Hill reaction).
7.17. What changes, if any, do you observe in tube 1?
7.18. What is the purpose of tubes 2 and 3?
7.19. What other Organelles, in your opinion, might be present in the chloroplast suspension?
7.20. How can you prove that they are not involved in dye reduction?
7.21. Why should the isolation medium be kept chilled?
7.22. Why is the isolation medium prepared using a phosphate buffer?
7.23. What are (a) the electron donor and (b) the electron acceptor in the Hill reaction?
7.24. During the Hill reaction, DCPIP acts between electron acceptor X and PSI (see Fig. 7.14), with the concomitant evolution of oxygen. What type of phosphorylation do you think the Hill reaction represents: cyclic, non-cyclic, or both?
Explain your answer.
7.25. Fig. 7.23 shows the appearance of chloroplasts after being used in the experiment described above.
The photograph illustrates the changes that occur when chloroplasts are transferred from the hypertonic isolation medium containing sucrose to the hypotonic reaction medium.
(a) How does the appearance of the chloroplasts shown in Fig. 7.23 differ from that of normal chloroplasts?
(b) Try to explain why transferring the chloroplasts to a sucrose-deficient medium causes such changes.
(c) Why is it desirable for these changes to take place prior to the Hill reaction?
7.26. In your opinion, what is The Significance of the Discovery of the Hill reaction for understanding the mechanisms of Photosynthesis?

Fig. 7.23. Transmission electron micrograph of chloroplasts after isolation in a hypotonic solution. Envelopes and stroma are lost, x13,485.
Experiments: Investigation of the conditions for photosynthesis and its products
Certain products can serve as indicators that photosynthesis is actively taking place. The first such product is phosphoglyceric acid, which is rapidly converted into a range of compounds, including sugars and subsequently starch. The latter compound is very easy to detect and can therefore serve as a marker for photosynthesis. To carry out such an experiment, it is necessary to use leaves or whole plants that have been destarch-treated (depleted of starch).
Breakdown of starch in plants
If a plant is kept in the dark for 24–48 hours, its starch reserves will break down. Prior to conducting Experiment 7.2, it is advisable to verify that starch has been completely depleted from the plant.
7.27. Why do plants lose starch when kept in the dark?
Experiment 7.2. Testing a leaf for starch
Materials and equipment
A plant leaf
Test tube
Forceps
White ceramic tile
Hot water bath, 90% ethanol
Iodine-potassium iodide solution
Procedure
The presence of starch can be detected using an iodine-potassium iodide solution (I2/KI). However, the leaf must first be decolorized, as the green color of chlorophyll would mask any visible changes. To do this, place the leaf in a test tube containing boiling 90% ethanol set in a water bath, and leave it there for as long as necessary (due to the high flammability of ethanol, open flames must never be used).
Wash the decolorized leaf in hot water to remove the ethanol and soften the tissue. Then, spread the leaf out flat on a white ceramic tile and apply a red-brown iodine solution to its surface, which turns starch-containing areas dark blue.
Experiment 7.3. Investigating the requirement for carbon dioxide
Materials and equipment
A destarched plant with leaves, such as zonal geranium (Pelargonium)
Desk lamp
Cotton wool
Materials required for starch testing
250 ml conical flask
Retort stand with clamps
Limewater
20% potassium hydroxide solution
Procedure
Fig. 7.24 illustrates a convenient setup for investigating a plant's requirement for carbon dioxide. The plant should be left in the light for several hours, after which the starch content of the leaves is determined.
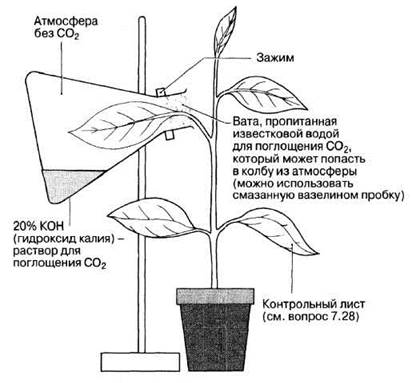
Fig. 7.24. Studying the carbon dioxide requirement in photosynthesis.
7.28. Describe the conditions under which the leaf in the control experiment should be kept.
A more precise experiment demonstrating the utilization of carbon dioxide by plants involves The Use of 14СO2 (a radiolabeled compound), which is incorporated into sugars and other Organic compounds.
7.29. Based on the equation for photosynthesis, try to determine which reactants and products can be monitored to measure The rate of photosynthesis.
7.11.1. Measuring the Rate of Photosynthesis
Section 7.8 discussed The Influence of certain environmental factors (such as light intensity, carbon dioxide concentration, and temperature) on the rate of photosynthesis. When studying The Effect of a specific factor, it is crucial to keep all other factors constant and, ideally, optimal so that they do not become limiting.
Rate of oxygen evolution
The simplest way to measure the rate of photosynthesis is to determine the rate at which oxygen is released by an aquatic plant.
Experiment 7.4. Investigating the effect of light intensity on the rate of photosynthesis
Materials and equipment
Gas collection apparatus (Fig. 7.25)
Test tube
400 ml beaker
Thermometer
Mercury lamp or projector lamp
Sodium hydrogen carbonate
Ruler
Stopwatch
Desk lamp-type light source
Canadian pondweed (Elodea), pre-illuminated in bright light for several hours
Detergent
Procedure
It is advisable to use Elodea that has been well illuminated and tested for active photosynthesis. If no bubble formation is visible, 2–10 g of sodium hydrogen carbonate per liter of water can be added to stimulate photosynthesis (this increases the carbon dioxide concentration). Alternatively, the water can be aerated (by bubbling air through it for an hour) prior to the experiment.
1. Using a sharp scalpel, cut off a bubble-covered Elodea stem about 5 cm long. Place it cut-end up in a test tube containing the same water the plant was kept in previously.
2. Place the test tube in a beaker filled with room-temperature water. Record the water temperature, which acts as a thermal shield, and monitor it throughout the experiment. It must remain constant; top up or replace the water as needed.
3. Fill the apparatus with tap water, ensuring there are no air bubbles anywhere, then push the syringe plunger all the way in (Fig. 7.25).
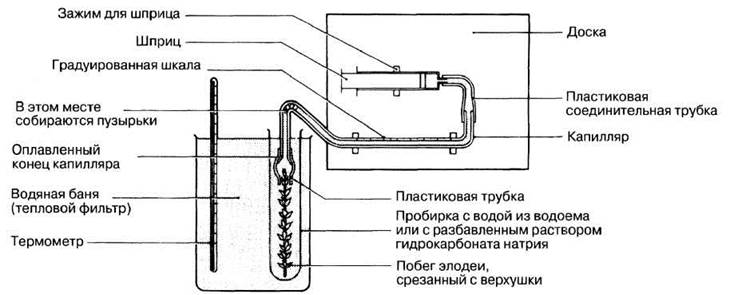
Fig. 7.25. Apparatus for measuring the rate of oxygen evolution by an aquatic plant during photosynthesis.
4. Darken the laboratory. Place a bright light source 5 cm away from the plant.
5. Allow the plant 2–3 minutes to acclimate (reach equilibrium) to the given light intensity. Then make sure the bubble formation rate is sufficient (more than 10 bubbles per minute). Trace amounts of a detergent are sometimes added to lower surface tension and facilitate bubble formation.
6. Position the Elodea SHOOT so that the bubbles collect inside the capillary tube of the apparatus. Start timing.
7. Collect a certain volume of gas over a set period (e.g., 5–10 min). Use the plunger to push the bubble through the capillary to THE POSITION OF the scale, and measure the length of the bubble.
8. Move the gas bubble further into the connecting tubing so it does not interfere with subsequent measurements. Repeat the described procedure, increasing the distance between the light source and the plant to 10, 15, 20, 30, 40, and 80 cm. In each case, allow the plant to adjust to the new light level. For all measurements, record the following parameters: a) the distance between the plant and the light source; b) the time taken to collect the gas; c) the length of the collected gas bubbles (this value is directly proportional to volume).
Results
The light intensity at the subject is inversely proportional to the square of the distance from the light source. In other words, increasing the distance between the plant and the light source will decrease the light intensity not twofold, but fourfold.

where LI is light intensity and d is the distance between the subject and the light source. Plot a graph with the rate of photosynthesis on the vertical axis (measured as the length of gas bubbles passing through the capillary per unit time) and LI on the horizontal axis (expressed as 1/d2 or, more conveniently, 1000/d2).
7.30. a) What relationship between gas production and light intensity do the results of your experiments demonstrate?
б) Why is it necessary to keep the temperature and the laboratory darkness constant?
7.31. What are the Main sources of error in this experiment?
7.32. If the collected gas were analyzed, it would turn out not to be pure oxygen. How can you explain this?
7.33. Why is it advisable to aerate the water before starting the experiment?
There is a simpler and faster (though less precise) METHOD FOR DETERMINING the rate of oxygen production: counting the gas bubbles released from the cut end of the Elodea shoot over a specific time interval. This type of experiment yields quite satisfactory data, although errors may arise due to varying bubble sizes. This issue can be resolved by adding trace amounts of a detergent to reduce surface tension (see step 5 above). The Elodea can be secured to the bottom of the test tube using modelling clay.
Last update: 06/08/2026
Editorial and Educational Adaptation: This material has been compiled based on the primary/original source text. The project team performed an editorial review, corrected technical inaccuracies, structured sections, and adapted the content for an educational format.
What was processed:
- elimination of formatting defects (OCR errors, structural breaks, corrupted characters);
- editorial organization of content;
- standardization of terminology in accordance with academic sources;
- verification of factual statements against the original source text.
All mentions of the author, publication year, and origin of the primary text have been preserved in accordance with the source.