Review of Medical Physiology - William F. Ganong 2002
Respiration
Gas transport between the lungs and tissues
Carbon dioxide transport
Buffer Systems
To understand buffering processes in the body from the moment CO2 is generated from carbonic acid in the Blood, it is necessary to examine how CO2 transport occurs. Buffer systems are introduced in Chapter 1 and discussed in detail in Chapter 39.
Transport of Carbon Dioxide in the Blood
The solubility of CO2 in blood is 20 times greater than that of O2; therefore, at identical partial pressures, there is considerably more CO2 in simple solution than O2. Upon diffusion into erythrocytes, CO2 is rapidly hydrated to H2CO3 in the presence of Carbonic anhydrase. Dissociation of H2CO3 yields H+ and HCO3. The H+ ion is buffered primarily by Hemoglobin, whereas HCO3 enters the plasma. A fraction of the CO2 within erythrocytes reacts with protein amino groups—chiefly those of hemoglobin—to form carbamino compounds.
Class="center">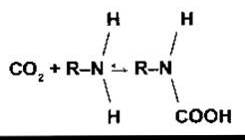
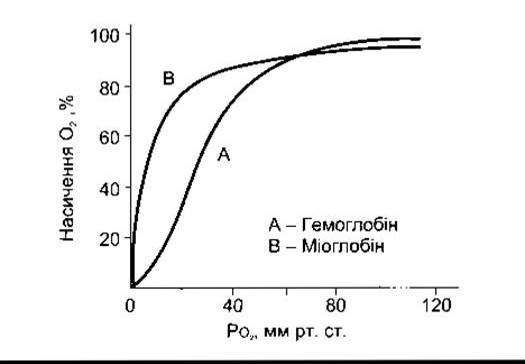
Fig. 35-5. Hemoglobin and Myoglobin dissociation curves.
As soon as deoxygenated hemoglobin binds more H+ than oxyhemoglobin does, the rapid formation of carbamino compounds is initiated. This promotes O2 binding to hemoglobin while decreasing its affinity for CO2 (the Haldane effect). Venous blood carries more CO2 than arterial blood; thus, CO2 uptake is facilitated in the Tissues, and CO2 is released in the Lungs. Over 11% of CO2 enters the systemic capillary blood and is transported to the lungs as carbamino-CO2.
In plasma, CO2 reacts with Plasma Proteins to form small amounts of carbamino compounds, while a minor fraction undergoes Hydration. The hydration reaction proceeds slowly in the absence of carbonic anhydrase.
Chloride Shift
Due to the increased intracellular concentration of HCO3 in erythrocytes relative to plasma as blood passes through the capillaries, over 70% of this HCO3 diffuses into the plasma. The movement of excess HCO3 out of erythrocytes in exchange for Cl- (Fig. 35-6) is mediated by Band 3, the principal membrane transport protein. This process is known as the chloride shift, as it results in a significantly higher Cl- content in the erythrocytes of venous blood compared to arterial blood. The chloride shift occurs rapidly, reaching completion within 1 second.
Note that every CO2 molecule entering an erythrocyte increases the number of osmotically active particles within The Cell by one—either HCO3 or Cl (see Fig. 35-6). Consequently, erythrocytes take up Water and increase in volume. For this reason, and considering that the small amount of fluid in arterial blood returns via Lymphatic vessels faster than via Veins, the hematocrit of venous blood is normally about 3% greater than that of arterial blood. In the lungs, Cl is driven out of the Cells, causing them to shrink.

Fig. 35-6. Changes occurring in erythrocytes upon The addition of CO2 to the blood. Note that every CO2 molecule entering an erythrocyte results in an additional HCO3- or Cl- ion inside the cell.
Summary
Given the diverse Functions of CO2 in plasma and erythrocytes, they are summarized in Table 35-2. As shown in Fig. 35-7, the increase in the CO2-carrying capacity of blood is defined by the difference between the dissolved CO2 and total CO2 lines on the CO2 dissociation curve.
Each deciliter of arterial blood contains approximately 49 mL of CO2 (see Table 35-1): 2.6 mL dissolved, 2.6 mL bound as carbamino compounds, and 43.8 mL present as HCO3-. In the tissues, each deciliter of blood receives 3.7 mL of CO2, of which 0.4 mL remains in solution, 0.8 mL forms carbamino compounds, and 2.5 mL forms CHO3. The blood pH drops from 7.4 to 7.36. The reverse process occurs in the lungs, where 3.7 mL of CO2 is eliminated via the alveoli. Thus, at rest, 200 mL of CO2 per minute—and significantly more during exercise—is transported from the tissues to the lungs and excreted. This is a remarkable capacity, as this amount of CO2 is equivalent to buffering 12,500 mEq of H+ per 24 hours.
Table 35-2. CO2 in the blood
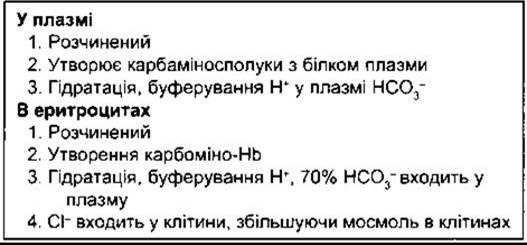
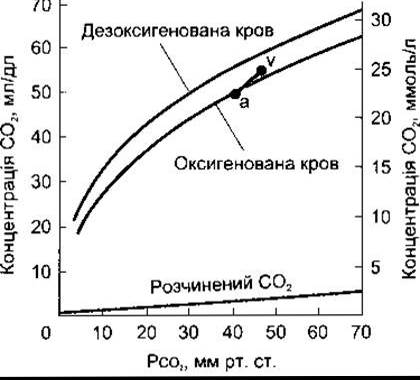
Fig. 35-7. CO2 dissociation curve. Arterial (a) and venous (v) points represent the total CO2 content in normal human arterial and venous blood at rest (modified and reproduced with permission from Schmidt RF, Thews G [editors]: Human Physiology. Springer, 1983).
Last update: 10/08/2026
Editorial and Educational Adaptation: This material has been compiled based on the primary/original source text. The project team performed an editorial review, corrected technical inaccuracies, structured sections, and adapted the content for an educational format.
What was processed:
- elimination of formatting defects (OCR errors, structural breaks, corrupted characters);
- editorial organization of content;
- standardization of terminology in accordance with academic sources;
- verification of factual statements against the original source text.
All mentions of the author, publication year, and origin of the primary text have been preserved in accordance with the source.