Practical Protein Chemistry - A. Darbre 1989
X-ray Crystallography and Electron Microscopy
X-ray Diffraction
Protein Crystallography
Ultimately, any crystallographic study aims to obtain experimental data on the electron density distribution ρ (x,y,z), which can be expressed using the Fourier function:
Class="center">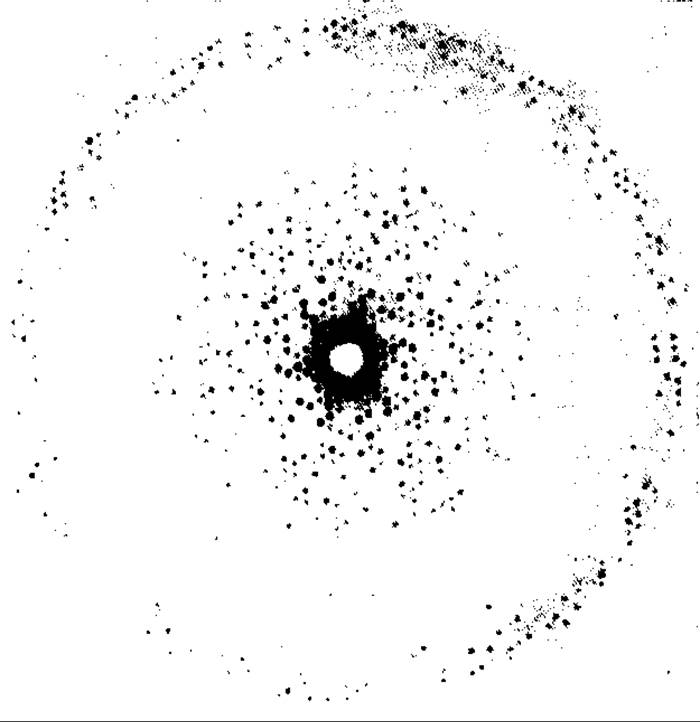
FIG. 20.4. Diffraction pattern of a C-phycocyanin crystal obtained using a precession camera (amplitude information is available, but the Phases of the diffraction maxima are not).

Coefficients A and B are related to the intensities F2(hkl) of the diffraction peaks and their phases φ:
A(hkl) = F2(hkl) ∙ cos φ
B(hkl) = F2(hkl) ∙ sin φ
The main difference between protein crystallography and small-molecule crystallography lies in the Methods used for phase determination. In the case of small molecules, phase information can be obtained through the statistical analysis of diffraction peak intensity data collected from the crystal. When studying Proteins, it is necessary to measure the diffraction peak intensities of the protein crystal as well as those of two or more derivative crystals of the same protein. Such derivatives are prepared by attaching heavy metal atoms to the protein either before or after crystallization. A derivative crystal should differ from the parent crystal only by the presence of heavy atoms, while the protein itself must maintain the same conformation, orientation, and packing as in the native crystal. In this case, the derivative is referred to as isomorphous.
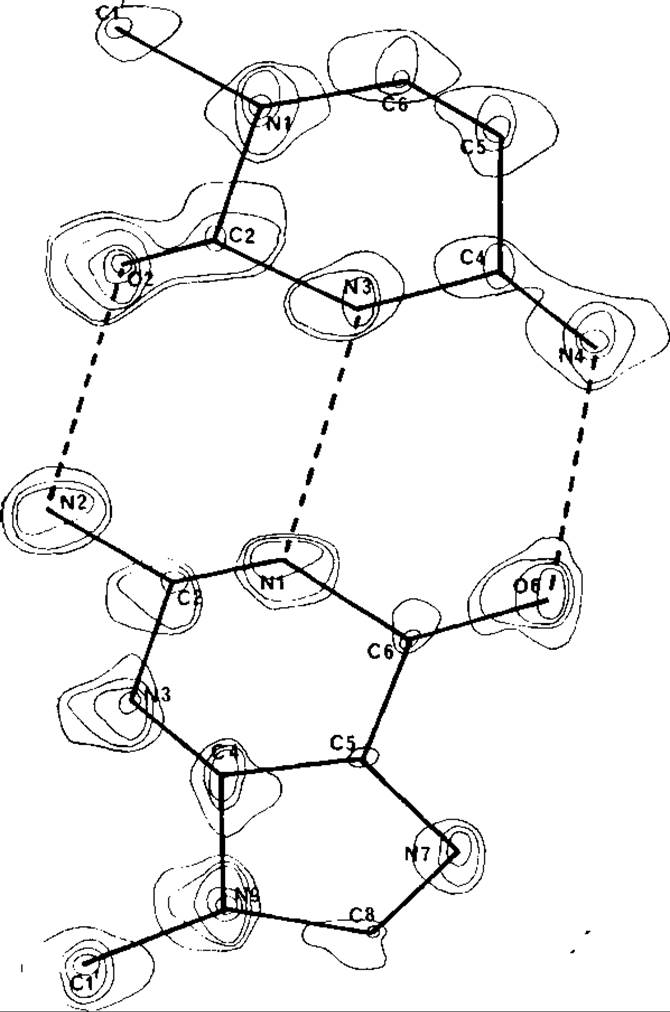
FIG. 20.5. Electron density map with the superimposed structural layout of a small molecule. Atoms appear on the map as discrete peaks of electron density.
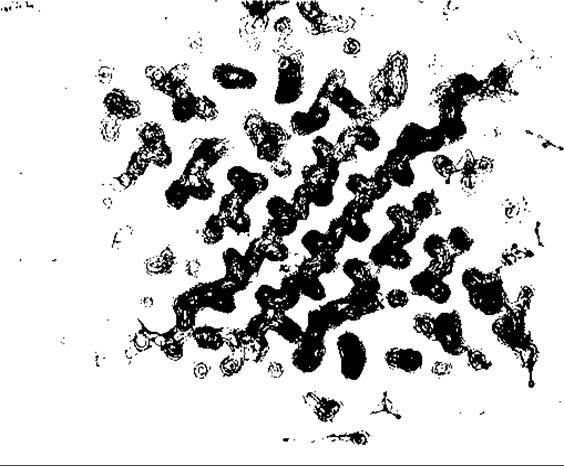
FIG. 20.6. Section of the electron density map of prealbumin. A region of the polypeptide chain forming a flat ß-sheet is clearly visible, whereas individual atoms are not resolved.
Once the native crystal and an adequate number of its isomorphous derivatives have been obtained, the next stage of the study involves collecting diffraction peak intensity data for all these crystals. The gathered intensity information can then be processed to determine the positions of the heavy atoms within the derivative crystals. This, in turn, makes it possible to determine the phases for all reflections of the native crystal [1].
20.1.4.1. Stages of structural analysis. The process of Cell/13.html">Protein Structure determination can be divided into several stages (Fig. 20.8). Serious difficulties may arise at some of these steps, requiring a return to earlier phases of the work (as indicated by the arrows in the figure). The diagram also omits the stage related to protein Isolation and Purification, where the primary role is played by the biochemist.
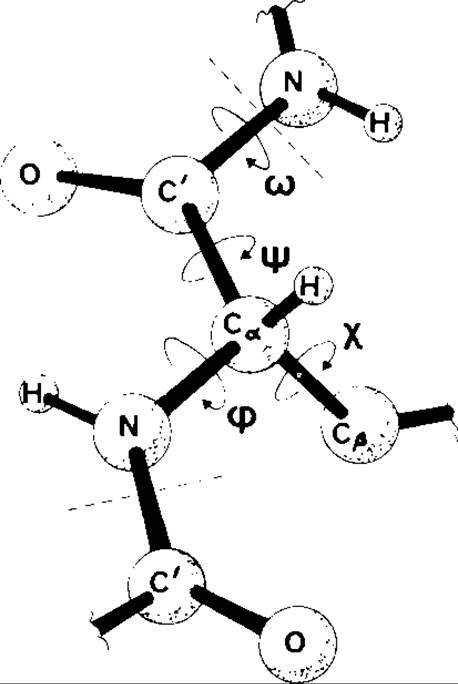
FIG. 20.7. Three-dimensional skeletal diagram of a polypeptide backbone region as a chain with a fixed conformation, generated by rotating individual units around chemical bonds of fixed length.
20.1.4.2. Crystallization. Obtaining an X-Ray Diffraction pattern requires crystals with a minimum dimension of several tenths of a millimetre—that is, significantly larger than those typically formed during crystallization. However, preliminary confirmation that a protein can be obtained in a microcrystalline state is extremely useful for finding conditions and methods to grow larger crystals suitable for structural analysis. Several crystal growth techniques are known, but none of them is universal. Therefore, if sufficient starting material is available, it is advisable to set up several parallel experiments using different techniques. Conditions must be optimized accordingly, and given that protein crystallization is a slow process, obtaining protein crystals is a highly meticulous task that demands immense patience from the experimenter. All existing crystallization techniques are based on producing supersaturated protein solutions and initiating crystal nuclei formation within them. For example, a supersaturated protein solution can be obtained by adding a saturated ammonium sulfate solution (salting out). In contrast to this simple approach, one can use so-called gradient supersaturation, driven by Temperature changes, salt diffusion across a dialysis membrane, or Water evaporation (vapor-diffusion). Furthermore, driving a solution into a supersaturated state can also be achieved by adding organic Solvents to the protein solution, such as through vapor-phase diffusion via evaporation [1, 9, 10]. The quality of the resulting crystals typically improves if the protein is thoroughly purified from contaminants, for instance, by means of isoelectric focusing [2].
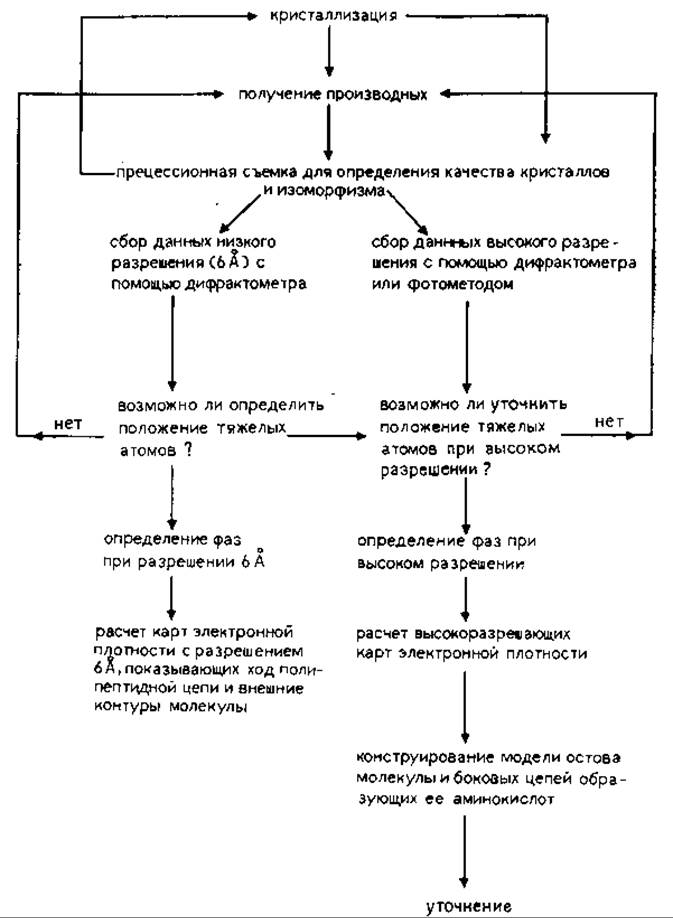
FIG. 20.8. Protein crystallographic study. The stages where results must be carefully analyzed before proceeding further are also indicated.
The choice of a specific crystallization technique often depends on The amount of protein available to the experimenter. For water-soluble proteins, solutions with a concentration of ~20 mg/mL are typically used. In hanging- or sitting-drop crystallization, the volume of a single sample is ~10 µL. When employing microdialysis or micro-volume methods, similar sample sizes are handled. Consequently, 1 mL of solution (or 200 mg of protein) can be sufficient for ~100 samples. With careful handling of the protein solution and a good crystallization yield, 20 mg of protein may suffice to sustain the entire structural study with crystals, or at least to evaluate the feasibility of further work.
Obtaining crystals of a sufficiently large size does not yet guarantee that the structural study will be successful. First, X-ray Diffraction Analysis—using a precession camera, for instance—must confirm that the crystals are sufficiently well-ordered and that diffraction data can thus be collected to high resolution. Second, the crystals must be of an appropriate space group, since an overly complex ( or overly simple) Molecular Packing within the unit cell can render structure determination impossible. Third, the crystals must be stable under X-ray exposure so that multiple high-resolution diffraction images can be recorded from a single crystal. Fourth, the crystallization technique must be highly reproducible to ensure that the complete structural analysis is supported by identical crystals, as a full diffraction dataset typically cannot be acquired from a single crystal alone.
20.1.4.3. Preparation of heavy-atom derivatives. Generally speaking, one cannot rule out the possibility that introducing a heavy atom into a protein molecule in solution might alter its crystal structure, causing the modified protein to crystallize differently than the native one. In most cases, however, heavy-atom derivatives are prepared by soaking protein crystals in solutions of suitable metal salts. This is because structural analysis requires the crystals of the native and modified proteins to share an identical molecular packing, differing only by the presence of a few heavy metal atoms per protein molecule. Therefore, it is practical to attempt modifying protein molecules that are already packed in the desired manner. Nevertheless, it is possible that the molecules within the crystal are packed in such a way that the relevant binding sites remain inaccessible.
Difficulties in preparing derivatives arise from the inability to reliably predict The properties of protein molecules. Consequently, a trial-and-error approach must be employed. In the case of Metalloproteins (i.e., in rather limited instances), metal atoms can be substituted with other ones, enabling The production of a series of derivatives. Additionally, specific heavy-atom attachment can be achieved via chemical Modification of the protein or through The addition of Cofactors or inhibitors. However, as a rule, heavy-atom binding sites can only be identified after the structure has been solved; the binding of these heavy atoms is governed by the specific three-dimensional arrangement of amino acid side chains within the crystal. Since the Spatial Organization of exposed side chains can depend on pH and Ionic strength, these very parameters serve as key variables when searching for derivative preparation conditions. Special care must be taken to optimize derivative preparation conditions so that they yield reproducible products while keeping the number of attached metal atoms per molecule low. Furthermore, soaking crystals for varying durations and/or in solutions containing different concentrations of the same heavy-metal salt may result in two products with different heavy-atom contents (with the atom bound at one site in one derivative and at two sites in another).
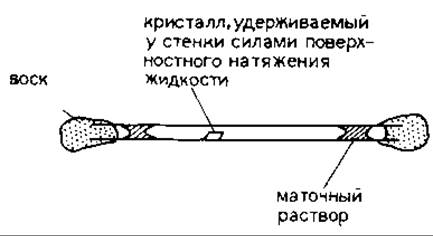
FIG. 20.9. Placement of a protein crystal and mother liquor droplets inside a thin-walled capillary for X-ray diffraction analysis.
The number of substitution sites is determined through crystallographic analysis; this parameter characterizes the probability of heavy metal presence in any of the molecules forming the crystal. It is crucial that the derivative preparation conditions reproducibly yield crystals with a high degree of binding site occupancy [1, 9].
20.1.4.4. Preparation for X-ray diffraction analysis of native protein crystals or their derivatives. Mounting crystals in capillaries. Once crystals and their derivatives have been obtained, they must be examined using X-ray diffraction to determine their suitability for further work. There are two primary criteria: resolution and isomorphism. To perform X-ray exposures, the crystal must be placed in a thin-walled capillary (Fig. 20.9). Using a fine Pasteur pipette, the crystal along with a drop of mother liquor is transferred from the crystallization cell into the capillary. To prevent changes in ionic strength during exposure (e.g., resulting from drying), an additional drop of mother liquor is placed at one end of the capillary, and the open end is hermetically sealed with dental wax. To remove excess liquid near the crystal, thin strips of filter paper are used. Removing excess liquid reduces Background X-ray scattering and helps retain the crystal in a fixed position through the surface tension of the trace amounts of liquid surrounding it. Another drop of mother liquor is introduced into the remaining open end of the capillary and sealed with wax (Fig. 20.9). Typically, the process begins by pre-coating the ends of a thin-walled capillary (30–40 mm in length) with wax so that it can be plugged quickly and hermetically after the crystal and mother liquor have been introduced.
20.1.4.5. Checking crystal quality. Initial testing of crystals is performed using a precession camera exposure, yielding a diffraction pattern similar to the one shown in Fig. 20.4. Such an exposure provides a general characterization of crystal quality. The diffraction pattern should consist of discrete spots located at the nodes of a regular lattice, which in successful cases reaches the edge of the image on the photographic plate. Resolution is determined by how far from the center of the photographic plate diffraction spots are still observed. However, the geometric CHARACTERISTICS OF THE precession camera must be taken into account. For instance, if an excessively large precession angle is chosen to obtain reflections down to a 0.1 nm resolution, the actual resolution on the images may not exceed 0.6 nm. At the same time, reducing the precession angle to a value limiting resolution—say to 0.3 nm—might lead to the appearance of reflections corresponding to that resolution on the images.
Another important property of the crystal that needs to be tested is its radiation stability. For this purpose, a series of diffraction patterns is recorded under standard conditions at defined time intervals. Radiation damage to the crystal is assessed by a decrease in resolution. Crystals suitable for work must withstand at least a one-day exposure in the X-ray beam without any visible changes on the precession photograph.
The isomorphism of derivatives is indicated by the constancy of crystal lattice parameters, which are calculated using the reciprocal lattice parameters mapped on the photographs. When overlaying such photographs from native and derivative crystals, the diffraction spots must coincide. Information on the positions of heavy atoms in the unit cell and, consequently, on the phases of the diffraction maxima is contained in the changes of their intensities. These changes should be noticeable but not excessively large, as large changes might stem from conformational shifts in the protein molecules. If no changes in spot intensities are detected, another derivative should be employed. Special Methods of Protein crystallography are applied to determine heavy metal positions. However, this task is not always successful because metal binding can disrupt isomorphism due to conformational or orientational Changes in the molecules. Another reason may be multiple heavy atom attachment, which renders the interpretation of diffraction patterns impossible.
20.1.4.6. Specific features of macromolecular crystallography. In protein crystallography, molecular structure is determined by calculating the electron density distribution throughout the volume of the native crystal's unit cell. This requires elucidating the positions of heavy atoms in the derivatives, which in turn allows the calculation of the phases of all diffraction maxima of the native crystal. Serious difficulties frequently arise during this work due to the large size of the studied molecules. Unlike small-molecule crystallography, it is necessary here to measure the intensities of a vast number of diffraction maxima, work with large electron density maps, and construct models of molecules consisting of A large number of atoms.
20.1.4.7. Collection of experimental data. With the advancement of protein crystallography methods, diffractometers have been developed that measure scattered radiation intensities using a counter. Such a diffractometer automatically positions the counter in the region of a diffraction maximum and appropriately orients the crystal in the X-ray beam. Devices have also been designed to account for crystal lattice defects and background scattered radiation. Automated diffractometers make it possible to measure entire datasets of diffraction maximum intensities and record them on punch cards, paper tape, or any other medium suitable for computer data entry. Furthermore, the diffractometer can be directly interfaced with a computer, facilitating the experimenter's work and enabling measurements with higher accuracy and reliability. Currently, these instruments are widely used for structural studies at low resolution (up to 0.6 nm), where the number of analyzed reflections is relatively small. Nevertheless, it must be acknowledged that the efficiency of such instruments is still insufficiently high. Due to the large size of the unit cell, protein crystals scatter X-rays over a wide angular range, whereas a conventional counter can only process a single reflection at any given moment. Consequently, the time required to collect a complete dataset often exceeds the lifespan of the crystal in the X-ray experiment. This, in turn, necessitates combining data obtained from different crystals.
For work at low resolution or with low-molecular-weight proteins, the limited lifetime of crystals does not pose major problems. However, as the Molecular Weight of the studied molecule increases or higher resolution is required, improving data collection efficiency becomes necessary. One approach to enhancing efficiency is The Use of a two-dimensional detector, which is a periodic array of counters capturing every photon scattered by the crystal. Designs for such computer-controlled devices are currently under active development.
The problem of increasing data collection efficiency has been partially solved using the photographic method. When using precession photographs, the most challenging part of the work involves indexing the reflections, i.e., assigning the corresponding Miller indices h, k, and l to each reflection. At the same time, obtaining such photographs requires metal screens that block reflections from all layers of the reflection sphere except the one under study. Consequently, some information is lost. Screenless photography appears to be more effective. Indexing photographs obtained by this method—which represent a superposition of many layers of the reflection sphere—is performed via computer. Therefore, one of the stages of experimental data Processing involves converting the diffraction pattern into a two-dimensional optical density distribution map using automated densitometers.
Last update: 06/08/2026
Editorial and Educational Adaptation: This material has been compiled based on the primary/original source text. The project team performed an editorial review, corrected technical inaccuracies, structured sections, and adapted the content for an educational format.
What was processed:
- elimination of formatting defects (OCR errors, structural breaks, corrupted characters);
- editorial organization of content;
- standardization of terminology in accordance with academic sources;
- verification of factual statements against the original source text.
All mentions of the author, publication year, and origin of the primary text have been preserved in accordance with the source.