Biological Chemistry - Berezov T. T., Korovkin B. F. 1998
Blood
Respiratory Function of Blood
Oxygen Transport by Blood
The core RESPIRATORY FUNCTION OF Blood is to deliver oxygen from the Lungs to the Tissues and carbon dioxide from the tissues to the lungs (Table 17.4).
Blood performs its respiratory function primarily due to the presence of Hemoglobin. The physiological function of Hemoglobin as an oxygen carrier relies on its ability to reversibly bind oxygen. Consequently, blood is oxygenated in the pulmonary capillaries, whereas in tissue capillaries—where the partial pressure of oxygen drops sharply—oxygen is released to the tissues.
Class="center">Table 17.4. Composition of inspired, alveolar, and expired air (adapted from White et al., 1981)
|
Gas |
Inspired air |
Alveolar air |
Expired air |
|||
P (hPa) |
vol % |
P (hPa) |
vol % |
P (hPa) |
vol % |
|
O2 |
210,9 |
20,95 |
134,9 |
14,0 |
154,9 |
16,1 |
СО2 |
0,4 |
0,04 |
53,3 |
5,6 |
38,0 |
4,5 |
N2 |
795,3 |
79,0 |
762,4 |
80,0 |
757,7 |
79,2 |
H2O |
6,7 |
— |
62,7 |
— |
62,7 |
— |
Total... |
1013,3 |
99,99 |
1013,3 |
99,6 |
1013,3 |
99,8 |
At rest, human tissues and Organs consume about 200 mL of oxygen per minute. During heavy physical exertion, tissue oxygen consumption increases tenfold or more (up to 2–3 L/min). Transporting this amount of oxygen from the lungs to the tissues as a gas physically dissolved in plasma is impossible due to the low solubility of oxygen in Water and Blood Plasma (Table 17.5).
Table 17.5. Absorption (solubility) coefficients of inhaled gases (in milliliters per 1 mL of medium at a pressure of 1013.3 hPa — 760 mmHg)
|
Medium |
t°C |
Gas |
||
O2 |
СО2 |
N2 |
||
Water |
0 |
0,049 |
1,71 |
0,024 |
20 |
0,031 |
0,87 |
0,016 |
|
Plasma |
40 |
0,023 |
0,53 |
0,012 |
38 |
0,024 |
0,51 |
0,012 |
|
Based on the data presented in Table 17.5, and knowing that PO2 in arterial blood is 107–120 hPa (80–90 mmHg), it is easy to see that The amount of physically dissolved oxygen in blood plasma cannot exceed 0.3 vol %. This value can be neglected when calculating the oxygen capacity of blood.
Thus, hemoglobin acts as the body's oxygen carrier. Recall that a hemoglobin molecule is composed of 4 subunits (polypeptide chains), each bound to a heme group (see Chapter 2). Consequently, a hemoglobin molecule contains 4 heme groups capable of binding oxygen, during which hemoglobin is converted into oxyhemoglobin.
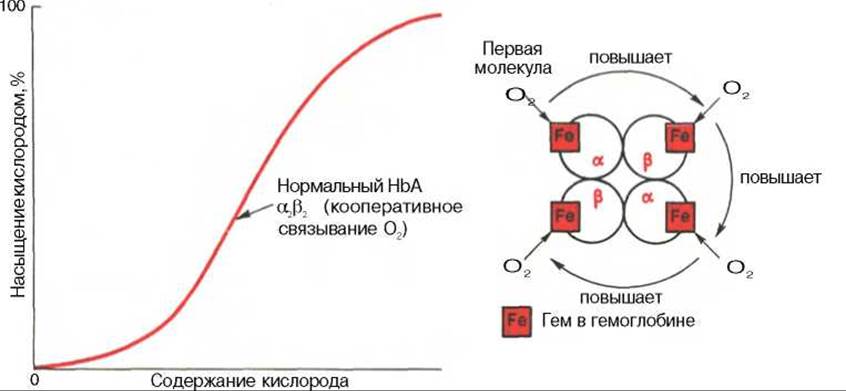
Fig. 17.6. Oxygen-hemoglobin dissociation curve. Explanation in the text.
Human hemoglobin contains 0.335% iron. Each gram-atom of iron (55.84 g) within hemoglobin binds 1 gram-molecule of oxygen (22,400 mL) upon full saturation. Therefore, 100 g of hemoglobin can bind

and each gram of hemoglobin binds 1.34 mL of oxygen. The hemoglobin concentration in the blood of a healthy person is 13–16%, meaning that 100 mL of blood contains 13–16 g of hemoglobin. At an arterial blood PO2 of 107–120 hPa, hemoglobin is 96% saturated with oxygen. Consequently, under these conditions, 100 mL of blood contains 19–20 vol % of oxygen:

In resting venous blood, PO2 = 53.3 hPa, and under these conditions, hemoglobin is only 70–72% saturated with oxygen, meaning the oxygen content in 100 mL of venous blood does not exceed

The arteriovenous oxygen difference* will be approximately 6 vol %. Thus, at rest, tissues receive 200–240 mL of oxygen per minute (assuming a resting Cardiac Output of 4 L).
An increase in The rate of oxidative processes in tissues, such as during intense muscular work, is always associated with a more complete extraction of oxygen from the blood. Furthermore, physical exertion drastically increases blood flow velocity. The relationship between hemoglobin oxygen saturation and PO2 can be represented as the oxygen-hemoglobin saturation curve, or oxyhemoglobin dissociation curve, which has a sigmoid (S-shaped) profile and reflects the affinity of hemoglobin for oxygen (Fig. 17.6).
* The arteriovenous oxygen difference varies considerably across different organs, depending on their metabolic rate. It is 12 vol % in the myocardium, 6 in the Brain, 3 in the digestive tract, and 1.5 in the Kidneys.
The characteristic sigmoid oxygen saturation curve of hemoglobin indicates that the binding of the first oxygen molecule to one of the Hemes facilitates the binding of subsequent oxygen molecules by the remaining three hemes. For a long time, the mechanism underlying this effect remained a mystery because, according to X-Ray Diffraction data, the 4 heme groups in a hemoglobin molecule are quite far apart and unlikely to exert a direct mutual influence. Recently, the following explanation for the sigmoid curve has been widely accepted. It is believed that the tetrameric hemoglobin molecule can reversibly dissociate into two halves, each containing one a-chain and one ß-chain:

When an oxygen molecule interacts with one of the four heme groups, Oxygen binds to one half of the hemoglobin molecule (for instance, to the a-chain of that half). Once this binding occurs, the a-polypeptide chain undergoes conformational changes that are transmitted to the closely associated ß-chain, which also undergoes conformational shifts. The ß-chain then binds oxygen with a higher affinity. In this way, the binding of the first oxygen molecule promotes the binding of the second (a phenomenon known as cooperative interaction).
Following the oxygenation of one half of the hemoglobin molecule, a new internal strained state arises in the molecule, which forces the second half of hemoglobin to alter its conformation as well. Two more oxygen molecules are then likely bound sequentially to the second half* of the hemoglobin molecule, forming oxyhemoglobin.
The sigmoid shape of the hemoglobin oxygen saturation curve is of major physiological importance. This curve profile ensures that the blood can maintain adequate oxygen saturation despite wide fluctuations in PO2. For instance, the respiratory function of blood is not significantly impaired when alveolar PO2 drops from 133.3 to 80–93.3 hPa. Therefore, ascending to altitudes of up to 3.0–3.5 km above sea level is not accompanied by The Development of severe hypoxemia.
The oxygen affinity of hemoglobin is typically expressed as the P50 value, which represents the partial pressure of oxygen at which 50% of hemoglobin is saturated with oxygen (at pH 7.4 and 37°C). The normal P50 value is approximately 34.67 hPa (see Fig. 17.6). A rightward shift of the oxygen-hemoglobin dissociation curve indicates a decrease in hemoglobin's oxygen-binding capacity and is consequently accompanied by an increase in P50. Conversely, a leftward shift reflects an increased oxygen affinity of hemoglobin, resulting in a lowered P50.
The shape and position of the oxygen-hemoglobin saturation (or oxyhemoglobin dissociation) curve depend on several factors. Hemoglobin's affinity for oxygen is primarily regulated by pH. The lower the pH, the lower the oxygen-binding capacity of hemoglobin and the higher the P50. In tissue capillaries, the pH is lower (due to the influx of large amounts of CO2), enabling hemoglobin to readily release oxygen. In the lungs, CO2 is eliminated, the pH rises, and hemoglobin avidly binds oxygen.
* The term "subunit" is somewhat ambiguous when applied to the hemoglobin molecule, as it contains four structural elements (two a-chains and two ß-chains) while possessing only two functional subunits, namely two aß-dimers.
The oxygen-binding capacity of hemoglobin is also Temperature-dependent. The higher the temperature (with tissue temperature exceeding that of the lungs), the lower the hemoglobin's oxygen affinity. Conversely, a drop in temperature produces the opposite effect.
The blood hemoglobin concentration, as well as its oxygen-binding properties to some extent (reflected by the shape of the oxyhemoglobin dissociation curve), vary somewhat with age. For instance, in newborns, hemoglobin levels can reach 20–21% (compared to the typical adult range of 13–16%). Humans possess several hemoglobin variants that are expressed in varying proportions at different Stages of Ontogeny and exhibit distinct oxygen affinities.
Let us examine impairments in the respiratory function of blood under certain pathological conditions.
Last update: 06/08/2026
Editorial and Educational Adaptation: This material has been compiled based on the primary/original source text. The project team performed an editorial review, corrected technical inaccuracies, structured sections, and adapted the content for an educational format.
What was processed:
- elimination of formatting defects (OCR errors, structural breaks, corrupted characters);
- editorial organization of content;
- standardization of terminology in accordance with academic sources;
- verification of factual statements against the original source text.
All mentions of the author, publication year, and origin of the primary text have been preserved in accordance with the source.