Post-infarction angina: mechanisms of development, clinical features, treatment, and prognosis - Bobrov V. O. 2009
Features of hemodynamic parameters in patients with early post-infarction angina
The impact of early post-infarction angina on The Development of early left ventricular remodeling in the post-infarction period. Left ventricular dysfunction is one of the most critical predictors of cardiac death following acute myocardial infarction (AMI). The process of early left ventricular remodeling after AMI involves structural alterations in both infarcted and non-infarcted myocardial regions. Within the first 24 hours of symptom onset, localized expansion and thinning of the infarct zone occur.
Parietal thinning of the left ventricular (LV) infarct zone results from decreased resistance in the affected myocardium under systolic wall stress and is mediated by several mechanisms, including myocyte stretching with a reduced diameter and myocyte slippage relative to one another. The myocardium distant from the infarct zone experiences an acute increase in diastolic myocardial stress, driven, as noted previously, by myocyte slippage and hypertrophy. Myocardial hypertrophy exhibits features of combined pressure and volume overload.
The extent of the infarct zone significantly alters LV volume and geometry, predisposing The Heart to acute aneurysm formation and myocardial rupture.
To identify hemodynamic determinants and assess systolic and diastolic LV function in patients with early post-infarction angina (EPIA), an echocardiographic evaluation was performed (Table 5). Given the selected patient cohort—consisting exclusively of individuals with primary Q-wave myocardial infarction—our findings regarding the increase in LVEDV and LVESV in patients with EPIA are consistent with data reported by other authors (M. Galiji et al.).
Early changes in LV volume and geometry carry substantial prognostic significance. Reports indicate that even a relatively modest increase in LVEDV and LVESV post-MI multiplies the risk of mortality by 4 to 5 times. LVESV assessed at 1 month post-MI serves as a predictor of survival, and its prognostic value exceeds that of the LV ejection fraction. This is further supported by the increased LVEDI and LVESI observed in patients with EPIA, which can be regarded as an indicator of an unfavorable prognosis in patients with AMI.
Table 5 Characteristics of LV hemodynamic parameters in patients with AMI during the early post-infarction period according to myocardial ischemia
|
Parameters |
Without EPIA |
With EPIA |
P |
|
EF, % |
45.30±2.25 |
44.66±7.72 |
>0.05 |
|
ESV, mL |
86.36±8.58 |
90.87±11.86 |
<0.001 |
|
ESI, mL/m2 |
45.55±5.84 |
47.45±6.34 |
0.0053 |
|
EDV, mL |
165.24±15.66 |
178.67±20.38 |
<0.001 |
|
EDI, mL/m2 |
86.64±7.96 |
93.30±8.16 |
<0.001 |
|
SV, mL |
78.61±8.41 |
79.78±10.7 |
<0.001 |
|
SI, mL/m2 |
41.59±3.01 |
41.66±4.05 |
>0.05 |
|
IVST, mm |
1.11±0.20 |
1.13±0.17 |
>0.05 |
|
PWT, mm |
0.96±0.19 |
0.96±0.18 |
>0.05 |
On the other hand, post-AMI LV dilation can be considered a compensatory mechanism that maintains stroke volume when more than 20% of the myocardium is damaged.
Regarding the development of myocardial hypertrophy, it should be noted that no statistically significant differences were observed between the patient groups. According to P. Gaudron et al., the development of LV myocardial hypertrophy following AMI is essential for restoring functional capacity; however, a rapid and excessive increase in LV myocardial mass can also lead to Heart Failure. Hypertrophy of the uninjured heart Muscle represents an early physiological response to myocardial injury. The beneficial effects of the early phase of LV hypertrophy include normalization of the systolic function of the damaged ventricular wall and maintenance of stroke volume.
Nevertheless, most researchers indicate that prolonged exposure to high myocardial stress facilitates the transition from adaptive muscle hypertrophy to heart failure.
Thus, LV dilation is observed more frequently in patients with EPIA than in those without ischemia. The presence of pain does not significantly affect the hemodynamic parameters of patients with EPIA. Signs of LV myocardial hypertrophy are more commonly found in patients without EPIA, which may point to the compensatory nature of myocardial hypertrophy in AMI patients.
The Effect of post-infarction angina on the development of late left ventricular remodeling. The process of early left ventricular remodeling may continue for up to 72 hours following the onset of AMI, whereas late remodeling extends over several months or years. Furthermore, late remodeling affects all Regions of the left ventricular myocardium, consisting of dilation and hypertrophy of non-infarcted segments in response to lost contractility and increased myocardial wall stress. Several studies have demonstrated that with reperfusion therapy, the period required for the complete recovery of regional myocardial contractility can range from several days to several months.
Immediately after an MI, the LV cavity undergoes deformation characterized by systolic compression at the border zone between the scar tissue and the unaffected myocardium due to high myocardial stress.
In the later stages of remodeling, the transition zone between the scar and healthy myocardium becomes smoothed out. This occurs As a result of late LV spherification, leading to progressive chamber enlargement. Later increases in the systolic sphericity index exceed those of the diastolic index, thereby perpetuating the distortion of LV geometry. This culminates in a relative reduction in stroke volume (SV), a process that must be compensated for by increased myocyte contractility or LV dilation. Ultimately, this leads to the development of heart failure.
To investigate the impact of EPIA on late LV remodeling, a prospective observational study of hemodynamic status and late remodeling processes was conducted in 93 post-MI patients over an 18-month period following AMI. Patients received standard combination therapy.
A comparative analysis of clinical and hemodynamic parameters in patients without myocardial ischemia revealed an increase in LVEDI and LVESI at 18 months post-MI (Table 6).
Table 6 Hemodynamic parameters of patients without angina during the 18-month follow-up
|
Parameters |
1 month (n=62) |
3 months (n=57) |
12 months (n=34) |
18 months (n=21) |
|
EDV, mL |
166.46±14.28 |
166.44±14.1 |
167.97±13.0 |
174.76±9.09 |
|
Significance |
P 1,2>0.05 |
P 1,3>0.05 P 2,3>0.05 |
P1,4=0.0074 |
|
|
P2,4=0.0081 |
||||
|
P3,4=0.0081 |
||||
|
EDI, mL/m2 |
88.07±7.56 |
88.06±8.15 |
88.87±5.58 |
92.46±8.45 |
|
Significance |
P 1,2>0.05 |
P 1,3>0.05 P 2,3>0.05 |
P1,4=0.0260 |
|
|
P2,4=0.0370 |
||||
|
P3,4=0.0326 |
||||
|
ESV, mL |
85.89±9.16 |
85.75±9.27 |
87.65±8.41 |
92.29±2.81 |
|
Significance |
P 1,2>0.05 |
P 1,3>0.05 P 2,3>0.05 |
P1,4=0.0012 |
|
|
P2,4=0.0011 |
||||
|
P3,4=0.00015 |
||||
|
ESI, mL/m2 |
45.44±3.16 |
45.37±5.15 |
46.37±4.15 |
48.83±3.59 |
|
Significance |
P 1,2>0.05 |
P 1,3>0.05 P 2,3>0.05 |
P1.4=0.0001 |
|
|
P2.4=0.0006 |
||||
|
P3,4=0.0026 |
||||
|
EF, % |
46.35±7.32 |
45.49±2.54 |
45.26±1.93 |
44.33±1.15 |
|
Significance |
P>0.05 |
P>0.05 |
P>0.05 |
|
|
SV, mL |
70.03±10.39 |
69.74±9.37 |
71.26±8.83 |
76.62+2.73 |
|
Significance |
P 1,2>0.05 |
P 1,3>0.05 P 2,3>0.05 |
P1,4=0.0027 |
|
|
P2,4=0.0007 |
||||
|
P3,4=0.0047 |
||||
|
SI, mL/m2 |
37.05±5.26 |
36.89±4.25 |
37.70±3.68 |
40.54±3.58 |
|
Significance |
P 1,2>0.05 |
P 1,3>0.05 P 2,3>0.05 |
P1,4=0.0060 |
|
|
P2,4=0.0008 |
||||
|
P3.4=0.0069 |
||||
|
IVST, cm |
0.95±0.15 |
0.95±0.14 |
0.96±0.13 |
0.95±0.14 |
|
Significance |
P 1,2>0.05 |
P 1,3>0.05 P 2,3>0.05 |
P1,4>0.05 |
|
|
P2,4>0.05 |
||||
|
P3,4>0.05 |
||||
|
PWT, cm |
1.15±0.14 |
1.13±0.14 |
1.15±0.11 |
1.12±0.15 |
|
Significance |
P 1,2>0.05 |
P 1,3>0.05 P 2,3>0.05 |
P1,4>0.05 |
|
|
P2.4>0.05 |
||||
|
P3,4>0.05 |
Prior to this time point, changes in these parameters were not statistically significant. Thus, in patients without EPIA, significant LV dilation occurred only after 1.5 years of follow-up following AMI.
Table 7 Hemodynamic parameters of patients with early post-infarction angina during the 18-month follow-up
|
Parameters |
1 month (n=24) |
3 months (n=23) |
12 months (n=15) |
18 months (n=14) |
|
EDV, mL |
180.96±10.34 |
182.35±12.21 |
193.27±18.824 |
199.71 ±20.34 |
|
Significance |
P1,2>0.05 |
P1,3=0.0060 P2,3=0.0181 |
P1,4=0.0003 |
|
|
P2,4=0.0013 |
||||
|
P3,4>0.05 |
||||
|
EDI, mL/m2 |
95.24±5.67 |
95.97±4.48 |
101.72±9.15 |
105.11±10.58 |
|
Significance |
P1,2>0.05 |
P1,3=0.0094 P2,3=0.0433 |
P1,4=0.0006 |
|
|
P2,4=0.0044 |
||||
|
P3,4>0.05 |
||||
|
ESV, mL |
92.96±4.58 |
94.13±3.89 |
97.80±5.97 |
100.50±7.35 |
|
Significance |
P1,2>0.05 |
P1,3=0.0035 P2,3>0.05 |
P1,4=0.0002 |
|
|
P2,4=0.0007 |
||||
|
P3,4>0.05 |
||||
|
ESI, mL/m2 |
48.92±3.61 |
49.54±3.59 |
51.47±3.56 |
56.89±6.58 |
|
Significance |
P1,2>0.05 |
P1,3=0.0374 P2,3>0.05 |
P1,4=0.0000 |
|
|
P2,4=0.0001 |
||||
|
P3,4>0.05 |
||||
|
EF, % |
45.29±3.90 |
44.34±3.82 |
44.27±4.09 |
44.85±3.56 |
|
Significance |
P1,2>0.05 |
P1,3>0.05 P2,3>0.05 |
P1,4>0.05 |
|
|
P2,4>0.05 |
||||
|
P3,4>0.05 |
||||
|
SV, mL |
73.05±5.52 |
70.94±2.76 |
73.98±4.13 |
70.39±5.61 |
|
Significance |
P1,2>0.05 |
P2,3>0.05 P 1,3>0.05 |
P1,4>0.05 |
|
|
P2,4>0.05 |
||||
|
P3,4>0.05 |
||||
|
SI, mL/m2 |
38.45±4.26 |
37.34±3.04 |
38.94±4.25 |
37 ,05±3.95 |
|
Significance |
P1,2>0.05 |
P2,3>0.05 P 1,3 >0.05 |
P1,4>0.05 |
|
|
P2,4>0.05 |
||||
|
P3,4>0.05 |
||||
|
IVST, cm |
0.93±0.19 |
0.96±0.18 |
0.97±0.22 |
0.96±0.19 |
|
Significance |
P1,2>0.05 |
P1,3>0.05 P2,3>0.05 |
P1,4>0.05 |
|
|
P2,4>0.05 |
||||
|
P3,4>0.05 |
||||
|
PWT, cm |
1.13±0.10 |
1.13±0.09 |
1.14±0.07 |
1.11±0.1 |
|
Significance |
P1,2>0.05 |
P1,3>0.05 P2,3>0.05 |
P1,4>0.05 |
|
|
P2,4>0.05 |
||||
|
P3,4>0.05 |
State of left ventricular diastolic function in patients with post-infarction myocardial ischemia. Early post-infarction angina (EPIA) is the single most significant clinical syndrome in the course of myocardial infarction that markedly worsens prognosis by increasing the risk of fatal and non-fatal reinfarction and sudden cardiac death. Recognizing the crucial role of EPIA in the progression of AMI, 201 patients with primary acute Q-wave myocardial infarction were evaluated to further investigate the impact of EPIA on LV diastolic function.
In the group of patients with EPIA, Holter ECG monitoring revealed an increased duration of ischemia per 24 hours up to 102.72±14.33 min, an average number of episodes per 24 hours of 13.24±1.82, a mean duration of the maximum ischemic episode reaching 26.31±4.75 min, and an average ST-segment deviation depth during ischemic episodes of 1.9±0.12 mm (p<0.05 for all parameters compared to the group without myocardial ischemia). The results are presented in Table 8.
Table 8 ST-segment dynamics in patients with EPIA
|
Parameter |
Without MI (n=22) |
EPIA (n=47) |
|
ST min, min. |
37.9±11.94 |
102.72±14.33* |
|
ST ep |
7.9±2.31 |
13.24±1.82* |
|
ST dep, mm |
1.6±0.15 |
1.9±0.12* |
|
ST max, min. |
13.1±3.87 |
26.31±4.75* |
* p<0.05
Depending on LVEF, the E/A ratio (n=1.07–2.35), IVRT (n=70–90 ms), and early transmitral filling deceleration time (n=170–210 ms), all patients were divided into three groups:
1) with normal diastolic function — 15 (7.5%) patients (IVRT=70–90 ms, E/A=1.07–2.35, DT=170–210 ms);
2) with impaired LV relaxation — 142 (70.6%) patients (IVRT>90 ms, E/A<1.07, DT>210 ms);
3) with a restrictive transmitral Blood flow pattern — 44 (21.9%) patients (IVRT<70 ms, E/A>2.35, DT<170 ms).
A normal Doppler transmitral flow pattern with an LVEF<40% or DT<170 ms was interpreted as "pseudonormalization"; therefore, these patients were assigned to the restrictive group.
Doppler parameters differed significantly among the three studied groups. While LVEF did not differ between the first two groups, it was significantly lower in the group with restrictive LV diastolic dysfunction. SI and EDI were significantly higher In the second group compared to the normal LV diastolic function group (p<0.01), and in the restrictive LV diastolic dysfunction group compared to both other groups (p<0.01). The results are presented in Table 9.
To determine The rate of LV remodeling depending on the presence of myocardial ischemia in patients after acute myocardial infarction (AMI) over an 18-month follow-up period, a comparative analysis of Changes in the EDI-to-follow-up-duration ratio (±EDIL) was performed, where t is the follow-up duration. Patients were re-examined at fixed follow-up intervals — 3, 12, and 18 months from the onset of AMI, with the calculation of end-diastolic and end-systolic indices. The difference between the obtained arithmetic means of the end-diastolic index across the observation groups was divided by the follow-up period to yield a specific value for each group at each examination time point. Statistical analysis was performed to evaluate The Significance of changes in the "±Δ EDI/t" parameter within the same group across the control follow-up periods, as well as the differences in these parameters between groups of patients with and without post-infarction ischemia at each control time point. A positive sign indicated progression of left ventricular remodeling, whereas a negative sign indicated its reversion (Tables 10, 11).
Table 9 Results of the echocardiographic examination of the studied patients
|
Parameter |
Normal diastolic function (n=15) |
Impaired LV relaxation (n=142) |
Restrictive pattern (n=44) |
|
EF, % |
49.9±0.07 |
50.4±0.11 |
41.9±0.04** |
|
EDV, mL |
153.9±24.1 |
157.3±32.8* |
180.4±29.9** |
|
ESV, mL |
77.4±17.5 |
78.1±24.7 |
97.6±21.7** |
|
EDI, mL/m2 |
81.7±11.8 |
88.1 ±8.3* |
91.1 ±9.4** |
|
ESI, mL/m2 |
44.0±5.6 |
46.1±3.9 |
46.5±4.0 |
|
E/A |
1.24±0.17 |
0.74±0.12* |
1.78±0.47** |
|
EI/TI |
0.66±0.17 |
0.49±0.11* |
0.79±0.11** |
|
AI/TI |
0.34±0.16 |
0.47±0.11* |
0.22±0.11** |
|
IVRT, ms |
81.4±5.7 |
110.9±9.8* |
62.0±5.3** |
|
DT, ms |
190.7±12.8 |
237.4±18.4* |
138.1 ±9.2** |
*p<0.05 compared to the first group;
**p<0.05 compared to the second group
Table 10 Comparative analysis of LV remodeling rates using the "±Δ EDI/t" index in patients with post-infarction myocardial ischemia over an 18-month follow-up period
|
Patient groups |
3 months |
12 months |
18 months |
Significance |
|
Without ischemia |
-0.01±0.0 |
0.07±0.02 |
0.26±0.01 |
p1,2<0.001 p1,3<0.001 p2,3<0.001 |
|
SMI |
0.34±0.04* |
0.62±0.03* |
0.56±0.07* |
p1,2<0.001 p1,3<0.001 p2,3=0.0012 |
* Significance p≤0.001 — increase in the "±Δ EDI/t" index compared to the group of patients without ischemia
Table 11 Comparative analysis of LV remodeling rates using the "±Δ EDI/t" index in patients with SMI over an 18-month follow-up period
|
Patient groups |
3 months |
12 months |
18 months |
Significance |
|
Without ischemia |
-0.01±0.0 |
0.07±0.02 |
0.26±0.01 |
p1,2<0.001 p1,3<0.001 p2,3<0.001 |
|
SMI |
0.37±0.02** |
0.59±0.03** |
0.58±0.02** |
p1,2<0.001 p1,3<0.001 p2,3=0.30 |
* Significance p<0.001 — increase in the "±Δ EDI/t" index compared to patients with silent myocardial infarction (SMI) versus the group of patients without ischemia;
** Significance p<0.001 — increase in the "±Δ EDI/t" index in patients with SMI compared to the group of patients without ischemia
In all patients with post-infarction ischemia, the "±Δ EDI/t" index exceeded 0.5 after 18 months, whereas in the group without myocardial ischemia, none of the patients reached this level. This indicates a more pronounced rate of post-infarction left ventricular remodeling in patients with post-infarction ischemia and may serve as an indirect sign of myocardial ischemia in the remote period following acute myocardial infarction.
Thus, the "±Δ EDI/t" index reflects the rate of LV remodeling in patients after acute myocardial infarction and, when its value is >0.5, indicates pronounced post-infarction left ventricular remodeling, which may suggest the presence of myocardial ischemia in the remote period (more than 18 months) after AMI.
Considering the possibility of LV diastolic function disorders developing in patients with pre-existing cardiovascular pathology prior to AMI, it is also appropriate to analyze the distribution of previous Hypertension (HTN) cases among patients According to the type of LV diastolic filling (since it is known that HTN and concomitant LV hypertrophy more frequently lead to LV diastolic dysfunction, typically manifesting as impaired LV relaxation).
Thus, 75 patients with a history of prior HTN (79.8% of all cases) had impaired LV relaxation according to Doppler echocardiography; 17 patients with a history of HTN (18.1% of HTN cases) demonstrated a restrictive type of LV filling, and only 3 (3.2%) showed no impairment of left ventricular diastolic function (LVDF) on Doppler echocardiography — see Fig. 4.
The distribution of SMI cases relative to patient groups categorized by LV diastolic function status was as follows: in the group with normal LVDF according to Doppler echocardiography, 1 (6.6%) patient had silent myocardial infarction (SMI), 4 (26.7%) patients had SMI, and 10 (66.7%) patients had no SMI detected. In the group with impaired LV relaxation, SMI was detected in 44 (31.0%) patients, of whom 17 (12.0%) had SMI and 27 (19%) had silent myocardial infarction; no SMI was detected in 98 (69.0%) patients. In the group of patients with restrictive LV diastolic dysfunction, 20 (45.5%) patients had post-infarction myocardial infarction: 4 (9.1%) had silent myocardial infarction, 16 (36.4%) had SMI, meaning that SMI was not registered in 54.5% of patients in this group. Thus, in the impaired LV relaxation group, silent myocardial infarction slightly predominated among patients with post-infarction myocardial infarction, whereas in the restrictive LV diastolic dysfunction group, SMI predominated in the majority of patients with post-infarction myocardial infarction (Fig. 5).
Class="center">
Fig. 4. Distribution of history of AH cases in the examined patients depending on the type of LV diastolic filling (the difference between groups is significant; p<0.01)
Thus, the cumulative incidence of PSI was significantly higher in the group with the restrictive type of intracardiac hemodynamics, where a significantly greater number of patients developed both SCMI and RHD compared to both other groups. Specifically, in the group with LV DD of the restrictive type, 45.5% of patients had RHD, whereas in the group with impaired LV relaxation, RHD occurred in only 31.0% (p<0.01) of patients. At the same time, the incidence of SCMI in both LV DD groups was significantly higher compared to the group without LV DF impairment. The absence of a significant difference in the cumulative incidence of RHD between the groups without LV DF impairment and with impaired LV relaxation can be explained, on the one hand, by the small Sample size in the former, and on the other hand, by the fact that the latter was dominated by patients with AH and LV hypertrophy, which is compensatory in nature in these patients. This is due to the fact that impaired LV relaxation, unlike the restrictive type of LV DD, is more closely associated with MI, LV hypertrophy, and age, serving as a compensatory response to LV stretch and overload. It is well known that the prognosis in such patients is also significantly better than in the presence of restrictive LV DD.
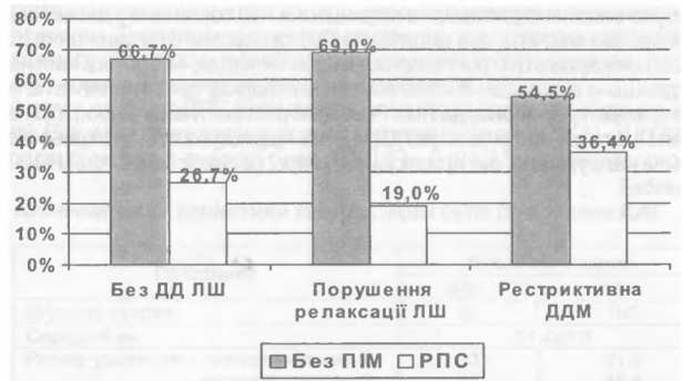
Fig. 5. Distribution of RHD cases depending on LV DD (the difference between the impaired relaxation group and the restrictive LV DD group is significant; p<0.01)
This correlates with the assertion that patients with the restrictive type of LV DD often exhibit a significantly worse functional status and prognosis. In this study, the restrictive type of LV filling was detected in approximately a quarter (21.9%) of the examined patients, which is consistent with the findings of other researchers. The same applies to the fact that LV DD is more frequently encountered in patients with moderate and severe LV systolic dysfunction (which aligns with the data from our study).
The restrictive type of LV DD in patients with preserved LV systolic function could not be determined in this study due to the small sample size (all patients in this group had LV systolic dysfunction).
The decrease in effective LV compliance may be caused by increased stiffness (or elevated pericardial resistance) or volume overload. In the present study, patients with the restrictive type of LV DD showed a significant increase in EDV compared to the other two groups, indicating LV dilation and a more pronounced reduction in myocardial compliance in this patient cohort. Myocardial necrosis, interstitial edema, and increased Collagen deposition in the infarct zone also contribute to increased LV myocardial stiffness. The development of a restrictive filling profile and early LV dilation are bound to increase intramyocardial stress, leading to progressive LV dilation.
Last update: 08/08/2026
Editorial and Educational Adaptation: This material has been compiled based on the primary/original source text. The project team performed an editorial review, corrected technical inaccuracies, structured sections, and adapted the content for an educational format.
What was processed:
- elimination of formatting defects (OCR errors, structural breaks, corrupted characters);
- editorial organization of content;
- standardization of terminology in accordance with academic sources;
- verification of factual statements against the original source text.
All mentions of the author, publication year, and origin of the primary text have been preserved in accordance with the source.