MEDICAL BIOLOGY, ANATOMY, HUMAN PHYSIOLOGY AND PATHOLOGY - Ya.I. Fedonyuk 2010
BIOLOGY
CHAPTER 1. BIOLOGICAL BASES OF HUMAN VITAL ACTIVITY
1.3. MOLECULAR-GENETIC AND CELLULAR LEVELS OF LIFE ORGANIZATION
1.3.2. Structural-chemical and functional organization of eukaryotic cells
Chromosome Analysis
Karyotype study (karyotyping) is performed on microphotographs of metaphase plates, or less commonly, by direct Cell/15.html">Microscopy. For this purpose, tissue Cells that actively undergo mitotic division are used. Most frequently, cell cultures grown ex vivo in a nutrient medium are employed, particularly peripheral Blood Leukocytes and Skin fibroblasts. A plant poison, colchicine, is added to The Cell culture; it disrupts the microtubules of the spindle apparatus and arrests mitosis at the metaphase stage, ensuring the accumulation of metaphase plates. Prior to staining, the cells are treated with a hypotonic solution, which causes the Chromosomes to spread out so they do not overlap on the preparations.
To identify chromosomes, the following features are used: chromosome size, centromere position, centromere index (The ratio of the short arm length to the total chromosome length, %), and the presence of secondary constrictions and satellites. In metacentric chromosomes, the centromere index is about 50 %, whereas in submetacentric ones, it is less than 50 %. The size of metaphase chromosomes ranges from 11 to 2.3 µm. The final result is presented as an idiogram.
An idiogram (karyogram) is the arrangement of chromosome pairs in descending order of their size. A unified international Classification of Human chromosomes was established (Denver, USA, 1960), according to which all chromosome pairs are numbered and divided into 7 groups (A, B, C, D, E, F, G). The largest pair of chromosomes is designated as number 1, the next as number 2, and so forth. Sex chromosomes (XX and XY) are placed at the end of the idiogram (Fig. 1.36, Table 1.2).
Class="center">
Fig. 1.36. Human Karyotype: left — female, right — male:
Top — metaphase plates, bottom — idiograms. In the idiograms, chromosomes are arranged in pairs in order of decreasing length.
Sex chromosomes are highlighted separately: XX in females, XY in males.
However, the identification of homologous chromosome pairs within groups is often associated with considerable difficulties and can be performed with absolute certainty for only a few of them (chromosome pairs 1, 2, 3, 16, 17, 18). Since 1970, differential chromosome banding techniques (Q, G, R, C) utilizing fluorochromes and Giemsa stain have been developed. These Methods have made it possible to reveal a transverse banding pattern along the length of metaphase chromosomes, which is specific to each chromosome pair and allows for their precise identification. Dark bands represent stained regions, while light bands are unstained. In 1971, maps of linear differentiation of human chromosomes were developed in Paris, and a system for their nomenclature was proposed. Each arm (short p and long q) is divided into regions (numbered from the centromere to the telomere). There are usually 2–3 regions, and segments within a region are numbered (Fig. 1.37). For example, the designation 2p24 means: the 4th segment of the 2nd region of the short arm of the 2nd chromosome.
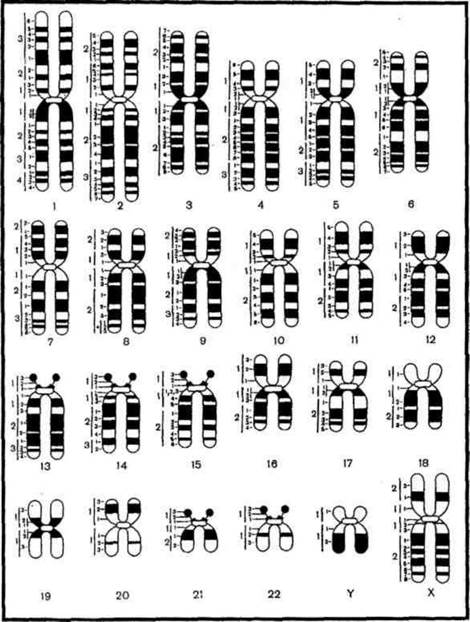
Fig. 1.37. Schematic representation of differential G-banding of chromosomes.
Fluorescence in situ Hybridization (FISH) method. This is a novel technique that allows the precise localization of various genes on chromosomes through the hybridization of test chromosomes with a cloned DNA probe capable of binding a fluorochrome. The latter can be visualized using a fluorescence Microscope. In modern scientific practice, chromosome identification is performed using the "Metascan" optical-electronic system equipped with computer software designed for karyotype generation. The image of a metaphase plate under the microscope is transmitted to a computer via a video camera. On the monitor, several researchers can simultaneously examine the karyotype and analyze Chromosomal aberrations. The resulting output can be printed along with the patient's identification data.
Table 1.2.
Classification of human chromosomes by size and centromere position
Chromosome groups |
Chromosome pair numbers |
Chromosome characteristics |
A (I) |
1,2,3 |
1, 3 — large metacentric, 2 — large submetacentric |
B (II) |
4,5 |
Large submetacentric |
C (III) |
6-12 |
Medium submetacentric |
D(IV) |
13-15 |
Medium acrocentric |
E(V) |
16-18 |
Small submetacentric |
F(VI) |
19,20 |
Smallest metacentric |
G (VII) |
21,22 |
Smallest acrocentric |
X chromosome (Group III) |
23 |
Medium metacentric |
Y chromosome (Group VII) |
23 |
Small acrocentric |
Last update: 08/08/2026
Editorial and Educational Adaptation: This material has been compiled based on the primary/original source text. The project team performed an editorial review, corrected technical inaccuracies, structured sections, and adapted the content for an educational format.
What was processed:
- elimination of formatting defects (OCR errors, structural breaks, corrupted characters);
- editorial organization of content;
- standardization of terminology in accordance with academic sources;
- verification of factual statements against the original source text.
All mentions of the author, publication year, and origin of the primary text have been preserved in accordance with the source.